Báo cáo y học: "The global role of ppGpp synthesis in morphological differentiation and antibiotic production in Streptomyces coelicolor A3(2)" pdf
Bạn đang xem bản rút gọn của tài liệu. Xem và tải ngay bản đầy đủ của tài liệu tại đây (987.03 KB, 18 trang )
Genome Biology 2007, 8:R161
comment reviews reports deposited research refereed research interactions information
Open Access
2007Heskethet al.Volume 8, Issue 8, Article R161
Research
The global role of ppGpp synthesis in morphological differentiation
and antibiotic production in Streptomyces coelicolor A3(2)
Andrew Hesketh
*
, Wenqiong Joan Chen
†‡
, Jamie Ryding
†
,
Sherman Chang
†§
and Mervyn Bibb
*
Addresses:
*
Department of Molecular Microbiology, John Innes Centre, Norwich Research Park, Colney, Norwich, NR4 7UH, UK.
†
Verenium
Corporation, San Diego, CA 92121, USA.
‡
Biology Department, San Diego State University, San Diego, CA 92182, USA.
§
Dermtech International,
San Diego, CA 92121, USA.
Correspondence: Andrew Hesketh. Email:
© 2007 Hesketh et al.; licensee BioMed Central Ltd.
This is an open access article distributed under the terms of the Creative Commons Attribution License ( which
permits unrestricted use, distribution, and reproduction in any medium, provided the original work is properly cited.
Effect of ppGpp on antibiotic production<p>The induction of ppGpp synthesis in Streptomyces coelicolor influenced the expression of several genomic elements characteristic of streptomycete biology, including antibiotic gene clusters, conservons, and morphogenetic proteins.</p>
Abstract
Background: Regulation of production of the translational apparatus via the stringent factor
ppGpp in response to amino acid starvation is conserved in many bacteria. However, in addition
to this core function, it is clear that ppGpp also exhibits genus-specific regulatory effects. In this
study we used Affymetrix GeneChips to more fully characterize the regulatory influence of ppGpp
synthesis on the biology of Streptomyces coelicolor A3(2), with emphasis on the control of antibiotic
biosynthesis and morphological differentiation.
Results: Induction of ppGpp synthesis repressed transcription of the major sigma factor hrdB,
genes with functions associated with active growth, and six of the thirteen conservons present in
the S. coelicolor genome. Genes induced following ppGpp synthesis included the alternative sigma
factor SCO4005, many for production of the antibiotics CDA and actinorhodin, the regulatory
genes SCO4198 and SCO4336, and two alternative ribosomal proteins. Induction of the CDA and
actinorhodin clusters was accompanied by an increase in transcription of the pathway regulators
cdaR and actII-ORF4, respectively. Comparison of transcriptome profiles of a relA null strain, M570,
incapable of ppGpp synthesis with its parent M600 suggested the occurrence of metabolic stress in
the mutant. The failure of M570 to sporulate was associated with a stalling between production of
the surfactant peptide SapB, and of the hydrophobins: it overproduced SapB but failed to express
the chaplin and rodlin genes.
Conclusion: In S. coelicolor, ppGpp synthesis influences the expression of several genomic
elements that are particularly characteristic of streptomycete biology, notably antibiotic gene
clusters, conservons, and morphogenetic proteins.
Background
Free-living bacteria are at the mercy of environmental condi-
tions, and must possess mechanisms for rapidly responding
and adapting to changing circumstances to survive. Strepto-
mycetes are non-motile, mycelial soil bacteria that are unri-
valled producers of bioactive secondary metabolites,
Published: 3 August 2007
Genome Biology 2007, 8:R161 (doi:10.1186/gb-2007-8-8-r161)
Received: 14 May 2007
Revised: 11 June 2007
Accepted: 3 August 2007
The electronic version of this article is the complete one and can be
found online at />R161.2 Genome Biology 2007, Volume 8, Issue 8, Article R161 Hesketh et al. />Genome Biology 2007, 8:R161
including a wide variety of antibiotics with important uses in
medicine and agriculture. On encountering conditions of
famine and unable to actively seek out new sources of nutri-
ents, Streptomyces colonies initiate a developmental pro-
gram that culminates in the production of spores for
dispersal, and involves transitioning from vegetative growth
on and within the (now exhausted) food substrate to the erec-
tion of aerial hyphae (reviewed in [1,2]). Concomitantly, the
colonies start producing antibiotics, perhaps to protect for
their own use nutrients released upon lysis of a proportion of
the substrate hyphae, an event that occurs at the onset of aer-
ial mycelium formation. The regulation of antibiotic produc-
tion is complex, involving many different families of
regulatory proteins, and both extracellular and intracellular
signaling molecules (reviewed in [3]).
One important system for sensing nutrient starvation and
triggering adaptive responses in bacteria involves the highly
phosphorylated guanine nucleotide ppGpp, also known as
stringent factor. This has long been known to effect a rapid
response to amino acid starvation in Escherichia coli, down-
regulating both rRNA biosynthesis and ribosome production
[4,5]. Under amino acid limiting conditions, the RelA protein
associated with ribosomes synthesises ppGpp in response to
occupancy of the ribosomal A-site by uncharged tRNAs. The
mode of action of ppGpp has been studied extensively in E.
coli, and involves reorienting gene transcription via binding
to RNA polymerase (reviewed in [6]).
In Streptomyces coelicolor A3(2), RelA appears to be the only
source of ppGpp synthesis [7,8]. Moreover, when grown
under nitrogen-limiting conditions, a ΔrelA mutant is defec-
tive in the production of two antibiotics: the blue-pigmented
polyketide actinorhodin (Act) and the red pigmented tri-
pyrolle undecylprodigiosin (Red); the mutant is also delayed
in the onset and extent of morphological differentiation [7].
Hesketh et al. [9] used a carboxy-terminally truncated deriv-
ative of relA expressed from a thiostrepton-inducible pro-
moter to achieve controllable levels of ppGpp production in S.
coelicolor independently of amino acid starvation, and dem-
onstrated a link between induction of ppGpp synthesis and
increased transcription of the activator gene controlling Act
biosynthesis, actII-ORF4. This supported previous work in a
number of different Streptomyces species where ppGpp had
been shown to influence antibiotic biosynthesis [10-14]. The
suggestion that ppGpp serves to regulate cellular functions
other than ribosome biogenesis agrees with the results of
studies in other bacterial species, where it plays a role in
diverse processes, including social behavior (quorum sensing
and biofilm formation), pathogenesis, symbiosis, stress sur-
vival and morphological development (reviewed in [15]).
Indeed, in E. coli, ppGpp is now considered much more as a
global regulator rather than simply as a regulator of ribosome
production, redirecting transcription so that genes important
for starvation survival and virulence are favored at the
expense of those required for growth and proliferation [6].
The purpose of this study was to use methods for the genome-
wide analysis of gene transcription to more fully characterize
the regulatory influence of ppGpp synthesis on the biology of
S. coelicolor, with particular emphasis on the processes of
morphological differentiation and secondary metabolite pro-
duction. Classically, the effects of ppGpp have been analysed
following induction of ppGpp production via starvation for
one or more amino acids. This complicates interpretation of
the results since the changes observed include responses both
to the increase in ppGpp concentration, and to the ppGpp-
independent effects of starvation. The levels of ppGpp pro-
duced in this way are also often artificially high in comparison
to those observed when starvation occurs naturally. In this
work we utilize a system that enables controlled induction of
more physiologically relevant levels of ppGpp in the absence
of amino acid starvation, allowing the effects of ppGpp syn-
thesis to be viewed in isolation. This is supplemented by a
comparison of relA+ (ppGpp+) and relA- (ppGpp-) strains to
observe the longer term differences in gene expression result-
ing from an absence of ppGpp synthesis, and how this affects
the transition to antibiotic production and morphological dif-
ferentiation during growth. The results extend the known
involvement of ppGpp synthesis in the regulation of antibiotic
and secondary metabolite production, and paint a picture of a
global regulatory mechanism with inhibitory and stimulatory
effects on the transcription of a broad range of genes with
diverse cellular functions. Although the direct regulatory
routes remain unclear, it appears that, at least under certain
growth conditions, ppGpp synthesis is required for correctly
redirecting and coordinating gene transcription in S. coeli-
color to allow it to progress normally through its developmen-
tal life-cycle.
Results and discussion
Description and overview of datasets
To determine the effect of ppGpp synthesis on global gene
expression in S. coelicolor we used two complementary strat-
egies. In the first approach, to study the immediate effects of
ppGpp production, we activated ppGpp synthesis in exponen-
tially growing cells in the absence of amino acid starvation by
using a strain (M653 [ΔrelA tipAp::relA(1.46 kb)]) that
expresses a truncated portion of relA under the control of a
thiostrepton-inducible promoter [9]. Samples were harvested
at 30 minute intervals following induction for comparison to
a control set of samples from aliquots of the same cultures
that were not induced. Dry cell weight measurements in the
two sets of cultures were similar, indicating that the induction
of ppGpp synthesis had no gross effect on growth. As a control
for the effect of thiostrepton on gene expression, a similar
study was undertaken using strain M667 [ΔrelA tipAp::],
which lacks the truncated relA gene downstream of the thios-
trepton-inducible promoter but grows at a similar rate to
strain M653 [ΔrelA tipAp::relA(1.46 kb)] [9]. In the second
approach, we sampled cultures of a relA deletion mutant
strain that is completely defective in the ability to synthesise
Genome Biology 2007, Volume 8, Issue 8, Article R161 Hesketh et al. R161.3
comment reviews reports refereed researchdeposited research interactions information
Genome Biology 2007, 8:R161
ppGpp, but which shows no growth rate defect [7], during
growth on a complex medium over a five day period. These
were compared to similar samples of the parent strain grown
under the same conditions. Details of the microarray data
analysis methods are given in the Materials and methods.
Changes in gene expression upon induction of ppGpp synthesis in
M653 [
Δ
relA tipAp::relA(1.46 kb)]
Induction of exponentially growing cultures of S. coelicolor
strain M653 [ΔrelA tipAp::relA(1.46 kb)] by treatment with
thiostrepton (25 μg ml
-1
) resulted in an approximately three-
fold increase in intracellular ppGpp concentration after 60-
90 minutes (Figure 1a). The maximum concentration
achieved was approximately 25 pmol mg
-1
dry cell weight,
which is 15-20% of the levels typically obtained following
starvation of actively growing S. coelicolor by amino acid
shift-down but similar to those measured in cultures natu-
rally progressing to starvation during transition to stationary
phase [16]. Control cultures to which thiostrepton was not
added were consistently low in ppGpp over the same period,
at around 6 pmol mg
-1
dry weight at all times, attributable to
synthesis derived from basal expression of the tipA promoter.
This is approximately three- to six-fold higher than the
amount of ppGpp usually detected in the wild-type strain
under similar conditions, but has no observable effect on
growth rate [9]. Levels of GTP in the induced cultures showed
a three-fold decrease over the 90 minute period studied, but
remained approximately constant in the non-induced cells.
The fall in GTP upon stimulation of ppGpp synthesis in S. coe-
licolor is consistent with previous results (for example, [7]),
and is at least in part due to conversion of GTP to ppGpp.
Since it is not possible to elicit ppGpp synthesis without also
causing a reduction in GTP concentrations, downstream
effects of ppGpp synthesis on gene expression reported in this
work could in principle be attributable to the change in con-
centration of either nucleotide. ATP concentrations were sim-
ilar between the two experiments, and also did not change
significantly with time. In contrast, in the control strain M667
[ΔrelA tipAp::] ppGpp was not detected in any sample, and
levels of GTP were similar in the induced and non-induced
cultures (Figure 1b). ATP concentrations were again similar
in these two sets of cultures, and also did not change signifi-
cantly with time, but were generally lower in M667 [ΔrelA
tipAp::] than in M653 [ΔrelA tipAp::relA(1.46 kb)].
RNA was extracted from the same cultures used for the nucle-
otide analysis detailed above, and gene expression measure-
ments obtained by hybridization to Affymetrix diS_div712a
GeneChips containing oligo probes for 97% of the 7,825 pro-
tein-encoding genes in S. coelicolor. Data analysis revealed a
total of 752 genes whose expression profiles were significantly
influenced by the induction (Additional data file 1). Genes in
this list include not only those affected as a result of induction
of ppGpp synthesis, but also those changed in abundance as a
result of thiostrepton addition. Using strain M667 [ΔrelA
tipAp::] it was possible to identify those genes altered by the
addition only of thiostrepton (see Materials and methods),
resulting in a final list of 589 genes that had been significantly
affected by induction of ppGpp synthesis alone. To reduce the
number of genes for consideration and to focus in on only the
largest changes, the data for these 589 genes were subjected
to further tests (see Materials and methods). These were
based on analysing fold-change ratios between induced and
non-induced samples to identify those that are clearly
induced or repressed by ppGpp synthesis, and gave lists of 98
and 189 genes, respectively (Additional data file 2). These
lists of genes were analysed further to identify over-repre-
sented (P < 0.05) pathways or functions (Tables S1 and S2 in
Additional data file 3).
Changes in gene expression between non-induced samples of strains
M653 and M667
Non-induced cultures of strain M653 [ΔrelA tipAp::relA(1.46
kb)] exhibit a constitutively low level of ppGpp synthesis
(about 6 pmol mg
-1
dry weight) whereas those of the control
strain M667 [ΔrelA tipAp::] are completely defective in
ppGpp production (Figure 1). The two strains grow at a simi-
lar rate [9]. Comparison of the datasets for these non-induced
samples should, therefore, reveal changes in global gene
expression resulting from intracellular ppGpp levels chang-
ing from 0 to 6 pmol mg
-1
dry weight, supplementing the
results from the induction experiments, which involved
increases in ppGpp concentrations from approximately 6 to
25 pmol mg
-1
dry weight. Data analysis identified 428 genes
that were significantly (P < 0.01) differentially expressed
between the two strains (Additional data file 4). Of these
genes, 76 were selected by visual inspection as clearly more
highly expressed in strain M653 (ppGpp = 6 pmol mg
-1
dry
weight) compared to M667 (0 pmol mg
-1
dry weight), while
352 genes were expressed at lower levels. Both lists of genes
were analysed further to identify over-represented (P < 0.05)
pathways or functions (Tables S3 and S4 in Additional data
file 3).
Changes in gene expression as a result of the relA mutation
Gene expression patterns during growth on a rich nutrient
agar medium (MYMTE) were compared between M570, a
relA deletion mutant strain that is completely defective in the
ability to synthesise ppGpp [7,8], and the parental strain
M600. MYMTE was selected since the mutant strain is clearly
defective in both morphological differentiation and produc-
tion of pigmented antibiotics when cultured on this medium
(Figure 2). M600 progressed normally through its develop-
mental cycle, beginning to erect aerial hyphae after 24 h, and
to produce Red after 36 h and Act after 48 h. Grey spores were
detectable by microscopy from 60 h onwards. M570 failed to
produce detectable amounts of pigment at any time, and
formed only a very sparse covering of aerial mycelium,
observable after 24 h. It did not sporulate in the duration of
the experiment, although when grown on MYMTE lacking
cellophane discs it exhibited a significant delay in sporulation
rather than a complete deficiency. RNA samples were isolated
R161.4 Genome Biology 2007, Volume 8, Issue 8, Article R161 Hesketh et al. />Genome Biology 2007, 8:R161
from cultures of each strain at 12 time points during growth,
and gene expression profiles compared following hybridiza-
tion to microarrays. Quality control of the array data failed
two chips, corresponding to replicate 2 of the 60 h sample for
both M600 and M570, and these were therefore omitted from
further analysis. A further 12 chips, for M600 cultures har-
vested after 18, 30, 42, and 72 h, were processed separately
from the other 60 samples, and when the results were dis-
played in GeneSpring they exhibited subtly different expres-
sion levels for a minor subset of genes when compared to the
other M600 samples. These, and the M570 data from the cor-
responding times, were therefore omitted from the detailed
statistical consideration of the data, although they were used
as a resource to supplement information on gene expression
trends when necessary.
Two-way ANOVA analysis of the filtered data from the 12, 24,
36, 48, 60, 84, 96, and 120 h samples identified 2,031 genes
that were significantly differentially expressed at the 1% prob-
ability level according to strain only, 3,074 genes according to
time only and 1,033 genes according to a combination of
strain and time (Additional data file 5). The 2,031 genes sig-
nificantly altered by mutation in relA represent approxi-
mately 25% of the genome and indicate extensive alterations
in patterns of gene expression in the mutant strain. Cluster
analysis can be used to identify groups of genes that are either
co-ordinately controlled or participate in common cellular
processes. These genes were therefore clustered according to
their expression profiles using the QT (quality threshold)
clustering algorithm, applying a requirement for a minimum
Pearson correlation of 0.9 and minimum cluster size of 5
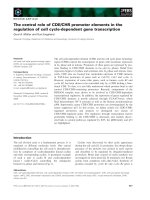
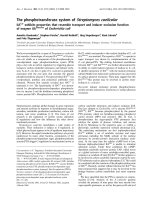
Changes in intracellular nucleotide concentrations in induced (grey bars) and non-induced (black bars) cultures of (a) M653 [ΔrelA tipAp::relA(1.46 kb)] and (b) M653 [
Δ
relA tipAp::]Figure 1
Changes in intracellular nucleotide concentrations in induced (grey bars) and non-induced (black bars) cultures of (a) M653 [ΔrelA tipAp::relA(1.46 kb)] and
(b) M653 [
Δ
relA tipAp::]. Cultures were grown to an OD
450
of approximately 0.5 before treatment with 25 μg ml
-1
thiostrepton (induced) or DMSO (non-
induced), and intracellular levels of nucleotides measured by HPLC analysis of extracts of cells harvested at 0, 30, 60 and 90 minutes. Values shown are in
pmol mg
-1
dry cell weight and are the average of biological triplicate experiments for (a) and duplicates for (b), with standard deviations marked with error
bars.
0306090
ppGpp GTP ATP
0
1000
2000
3000
4000
5000
6000
Time after induction (min)
Nucleotide concentration
(pmol mg
-1
dry wt)
0
100
200
300
400
500
600
700
800
900
1000
0306090
0
5
10
15
20
25
30
35
030 6090030 6090
0
100
200
300
400
500
600
700
800
900
1000
0
1000
2000
3000
4000
5000
6000
0
5
10
15
20
25
30
35
030 60900 30 60 90 0 30 60 900 30 60 90 0 30 60 90030 6090
Nucleotide concentration
(pmol mg
-1
dry wt)
(a) M653 [ΔrelA tipAp::relA(1.46kb)]
Time after induction (min)
ppGpp GTP ATP
(b) M667 [ΔrelA tipAp::]
Genome Biology 2007, Volume 8, Issue 8, Article R161 Hesketh et al. R161.5
comment reviews reports refereed researchdeposited research interactions information
Genome Biology 2007, 8:R161
genes. This produced 100 clusters containing a total of 1,093
genes, with 92 genes present in the largest cluster (Additional
data file 6). The upstream regions of genes in each QT cluster
were analysed for common promoter elements as detailed in
the Materials and methods and those referred to in the text
are noted in Additional data file 6.
The list of significantly differently expressed genes was fur-
ther analysed as detailed in the Materials and methods to
identify biological pathways significantly over-represented (P
< 0.05) by the data (Table S5 in Additional data file 3).
ppGpp synthesis represses many genes associated with
active growth, transport processes, and conservons in
S. coelicolor
Classically, the stringent response mediated by ppGpp
involves a reduction in rRNA biosynthesis and ribosome pro-
duction, and stringent control of the rrnD rRNA gene set in S.
coelicolor has been reported [16]. Probes for rRNA operons
are not present on the microarrays used, but the identifica-
tion of 14 genes encoding ribosomal proteins, plus 6 also
associated with ribosome biogenesis and function, in the list
of 189 ppGpp-repressed genes following induction in strain
M653 [ΔrelA tipAp::relA(1.46 kb)] is also consistent with this
occurring in S. coelicolor (Figure 3, Additional data file 2).
Indeed, ribosome production was top of the list of pathways
and processes repressed by ppGpp induction (Table S1 in
Additional data file 3). Moreover, the data indicate that a fur-
ther 51 genes whose functions are clearly associated with
active cell growth, that is, carbon metabolism, oxidative phos-
phorylation, cell wall biosynthesis, ATP synthesis, fatty acid
biosynthesis, purine/pyrimidine biosynthesis, co-factor pro-
duction and amino acid biosynthesis were also repressed.
This suggests an extended role for ppGpp in S. coelicolor in
coordinating the suppression of processes associated with cell
proliferation, even in the presence of sufficient nutrients to
support exponential growth. A global proteome/transcrip-
tome analysis of the response of Bacillus subtilis to ppGpp
synthesis induced in exponentially growing cells by addition
of the leucyl- and isoleucyl-tRNA aminoacylation inhibitor
DL-norvaline reported similar results [17]. However, the
observed repression of genes involved in central carbon
metabolism and purine/pyrimidine biosynthesis in B. subtilis
was said to occur independently of relA, and, therefore, pre-
sumably also of ppGpp synthesis, in contrast to our findings
in S. coelicolor. In Corynebacterium glutamicum, transcrip-
tion of the majority (though not all) of the ribosomal protein
genes is reported to be controlled in a rel-independent man-
ner, and the list of stringently controlled genes is instead
dominated by those with a role in nitrogen metabolism [18].
This suggests some degree of variation between genera in the
core functions regulated by ppGpp. Conway and co-workers
have also reported a central role for ppGpp in coordinating
the global down-regulation of sets of genes involved in active
growth in E. coli during glucose-lactose diauxie, and in
response to growth arrest induced by H
2
O
2
, and proposed a
model wherein the ppGpp-dependent redistribution of RNA
polymerase across the genome is the driving force behind
control not only of the stringent response, but also the general
stress response and starvation-induced carbon scavenging
[19,20]. In this study, the observed ppGpp-dependent down-
regulation of the Sec protein secretion apparatus, plus 16
other genes encoding proteins with transport functions, also
suggests a significant role for ppGpp in S. coelicolor in repro-
gramming the import/export of nutrients. An additional eight
genes encoding putative transporters were also found to be
induced by ppGpp synthesis (see below). Interestingly, the
ROK-family transcriptional repressor SCO6008 was ppGpp-
repressed while the first gene from the adjacent putative car-
bohydrate transport operon SCO6005-6007 [21] was ppGpp-
induced, perhaps suggesting that expression of this operon is
usually repressed by SCO6008. A two-fold repression of
SCO6008 following induction of ppGpp synthesis in M653
[ΔrelA tipAp::relA(1.46 kb)] was confirmed by quantitative
RT-PCR (qRT-PCR; data not shown).
Biosynthesis of the vitamin B12 co-factor appears to be at
least partially regulated by ppGpp in S. coelicolor (Additional
data file 2 and Table S1 in Additional data file 3), with three
genes from the cob locus at SCO1847-1859 being ppGpp-
repressed. Although not present in the significantly differ-
ently expressed genes in the array data, qRT-PCR confirmed
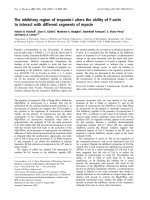
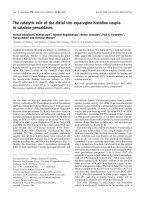
Illustration of the growth and sampling of cultures of (a) M600 (relA+ ppGpp+) and (b) M570 (relA- ppGpp-) on MYM TE agarFigure 2
Illustration of the growth and sampling of cultures of (a) M600 (relA+
ppGpp+) and (b) M570 (relA- ppGpp-) on MYM TE agar. M600 progressed
normally through its developmental cycle, beginning to erect aerial hyphae
after 24 h and to produce the antibiotics Red after 36 h and Act after 48 h.
Grey spores were also detectable from 60 h onwards. M570 failed to
produce detectable amounts of pigment, and formed only a very sparse
covering of aerial mycelium, first observable at 24 h. Samples 1-8
correspond to 12, 24, 36, 48, 60, 84, 96, and 120 h, respectively.
(a) M600 (relA+, ppGpp+)
(b) M570 (relA-, ppGpp-)
Spore
inocul um
Gr owt h o f su bstrate
mycelium into agar.
Develo pment of aerial
mycelium and onset
of th e prod uctio n
of Act and Re d.
Maturation of aerial
hyph ae int o sp ores
(DN A cond ens ation/
for mation of s epta).
Spore
inocul um
Gr owt h o f su bstrate
mycelium into agar.
Delayed development of
aerial myceliu m. N o
detectable Act and
Red pr od uction.
Sparse a erial hyph ae
even tu all y form .
No spor ulation.
12 18 60, 72, 84, 9 6, 12 024, 30, 3 6, 4 2, 48Time (h): 12 18 60, 72, 84, 9 6, 12 024, 30, 3 6, 4 2, 48Time (h):
12 18 60, 72, 84, 9 6, 12 024, 30, 3 6, 42, 48Time (h): 12 18 60, 72, 84, 9 6, 12 024, 30, 3 6, 42, 48Time (h):
R161.6 Genome Biology 2007, Volume 8, Issue 8, Article R161 Hesketh et al. />Genome Biology 2007, 8:R161
that the first gene in the putative SCO1847-53 transcription
unit that comprises half of this locus was approximately 2-
fold reduced 60 minutes after induction of ppGpp synthesis
in M653 [ΔrelA tipAp::relA(1.46 kb)] (data not shown). In
addition, many genes in this cluster were significantly down-
regulated in strain M600 compared to the relA mutant strain
(QT52 in Additional data file 6), and 6 of the 38 genes identi-
fied as possessing B12 riboswitches [22] were repressed upon
induction of ppGpp synthesis.
Interestingly, 11 genes associated with 6 of the 13 conservons
(cvns) present in the genome of S. coelicolor were ppGpp-
repressed. Cvns, first identified in S. coelicolor by Bentley et
al. [23], are conserved operons typically consisting of four
genes, two of unknown function sandwiched between a sen-
sor histidine kinase homologue and a gene encoding an ATP/
GTP-binding protein. They are also present in the genomes of
Streptomyces avermitilis (12 copies) [24] and Streptomyces
scabies (13 copies) [25], in some cases with cytochrome P450
genes associated with them, and to date have only been found
in the genomes of Actinomycetales [26]. Genes from cvn1,
cvn4, cvn6, cvn10 (the cytochrome genes only), cvn12 and
cvn13 were repressed following ppGpp synthesis, while none
were identified in the ppGpp-induced list. qRT-PCR analysis
of the samples taken 60 minutes following induction con-
firmed that transcription of the first genes from each of cvns
1, 10 and 13 were reproducibly approximately two-fold or
more repressed following induction of ppGpp synthesis in
strain M653 [ΔrelA tipAp::relA(1.46 kb)] (Table 1; Figure S1
in Additional data file 7). Mutation of the ATP/GTP-binding
homologue in cvn9 of S. coelicolor affected both morphologi-
cal differentiation and production of pigmented antibiotics,
as did mutation of the kinase homologue of cvn9 or cvn10
[26,27]. The suggested signaling role for cvns is supported
from the results of a biochemical analysis that indicates that
the proteins from cvn9 comprise a membrane-associated het-
ero-complex resembling the eukaryotic G-protein-coupled
receptor system [26]. Twenty-one genes from a total of eight
cvns, including all genes from cvn9, were significantly altered
in their transcription when comparing the parent (ppGpp+)
and relA mutant (ppGpp-) strains (Table S5 in Additional
data file 3, and Additional data file 5), and it is interesting to
speculate that some of the wide-ranging effects on transcrip-
tion that are exerted by ppGpp may be mediated via
controlling the level of expression of the cvns. Given the
reported influence of certain cvns over production of the pig-
mented antibiotics in S. coelicolor, it is also possible that
ppGpp exerts at least some of its effects on the regulation of
Act and Red synthesis via this route. The ATP/GTP-binding
protein homologue present as the fourth gene in each cvn has
both GTP-hydrolysing and GTP/GDP-binding activities [26],
and the decrease in GTP concentration associated with the
synthesis of ppGpp could also influence any signaling activity
of the cvns.
Eight genes whose annotated function is associated with
amino acid biosynthesis were significantly repressed follow-
ing induction of ppGpp synthesis in M653 [ΔrelA
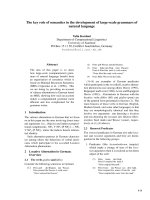
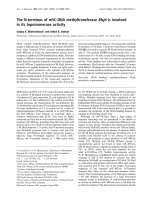
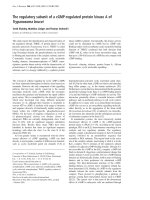
Induction of ppGpp synthesis in S. coelicolor represses genes associated with active growth, but stimulates transcription from the act and cda antibiotic clustersFigure 3
Induction of ppGpp synthesis in S. coelicolor represses genes associated
with active growth, but stimulates transcription from the act and cda
antibiotic clusters.
179 88 10
5 genes from
cda
cluster
1 gene from hopanoids cluster
& others
18 genes from
cda
cluster
5 genes from
act
cluster
4 genes from 2 sugar transport systems
4 genes from other transport systems
3 regulatory genes
2 adenosine deaminase genes
1 gene from hopanoids cluster
1 sigma factor
32 FUN genes
& others
20 genes for translational apparatus
10 genes for central carbon metabolism
8 genes for cell wall biosynthesis
8 genes for energy production
6 genes for purine/pyrimidine biosynthesis
4 genes for protein secretion
7 genes for co-factor biosynthesis
11 genes from conservons (6/13 clusters)
13 genes for amino acid transport/metabolism
10 genes from other transport systems
40 FUN genes
& others
ppGpp-induced ppGpp-repressed
Table 1
qRT-PCR analysis of the transcription of cvns 1, 10 and 13
M653 transcript abundance ratio 0/I60* M667 transcript abundance ratio 0/I60*
Gene Cvn number Induction replicate R1 Induction replicate R2 Induction replicate R1 Induction replicate R2
SCO5544 1 1.78 1.95 0.97 0.66
SCO7422 10 5.26 1.70 0.98 0.72
SCO7463 13 5.26 2.87 0.92 0.71
*The value for transcript abundance (measured by qRT-PCR) immediately prior to induction (0 minutes) divided by the abundance 60 minutes after
addition of thiostrepton to the culture (I60). The data confirm that transcription of the first gene in each of cvns 1, 10 and 13 is repressed following
induction of ppGpp synthesis in M653 [ΔrelA tipAp::relA(1.46 kb)] but unaffected in the control strain M667 [ΔrelA tipAp::].
Genome Biology 2007, Volume 8, Issue 8, Article R161 Hesketh et al. R161.7
comment reviews reports refereed researchdeposited research interactions information
Genome Biology 2007, 8:R161
tipAp::relA(1.46 kb)] (Additional data file 2). These are
hisC1, aroB, dapB, thrB, argH, glyA1, cysD and cysH. Previ-
ous reports in different organisms have also indicated a role
for ppGpp in the regulation of at least some amino acid bio-
synthesis genes, although both positive and negative effects
have been reported depending on the organism and the
amino acid. In C. glutamicum, both the histidine and serine
biosynthetic genes are under strong positive stringent control
[18], and the his operon in E. coli and Salmonella typhimu-
rium is de-repressed following accumulation of ppGpp
[28,29]. However, stringent control of serine and histidine
biosynthetic gene expression was not observed in B. subtilis,
but genes associated with the biosynthesis of branched chain
amino acids did exhibit a RelA-dependent induction [17]. In
contrast, glutamine synthetase I is negatively stringently con-
trolled in C. glutamicum [18], and in E. coli approximately
one-half of the genes encoding amino acid biosynthetic
enzymes are down-regulated in response to growth arrest
[19].
Transcription of the major vegetative sigma factor σ-
hrdB is repressed following ppGpp synthesis, while the
alternative ECF sigma factor σ-SCO4005 is induced
Sigma factors dictate selection of gene transcription by RNA
polymerase by specifying recognition of only certain
promoter sequences. σ-HrdB is essential for cell viability, and
is the major sigma factor for transcription of genes required
for active, vegetative growth in S. coelicolor [30]. Although
not represented on the GeneChip used in the microarray
analyses, transcription of
σ
-hrdB was analysed using qRT-
PCR and found to be approximately three- to four-fold
repressed 60 minutes after induction of ppGpp synthesis in
M653 [ΔrelA tipAp::relA(1.46 kb)] (Figure 4a). It was not sig-
nificantly affected in the control experiments. In similar stud-
ies looking at stringent control of gene expression in E. coli
[19,20], B. subtilis [17] and C. glutamicum [18], transcription
of the principal vegetative sigma factors was not found to be
significantly stringently controlled. The alternative extra-
cytoplasmic function (ECF) sigma factor
σ
-SCO4005 is
among the 98 genes identified as being significantly induced
following ppGpp synthesis in S. coelicolor (see below); this
was confirmed by qRT-PCR, which indicated a three- to five-
fold increase in transcription 60 minutes after the induction
of ppGpp production (Figure 4b). Two alternative sigma fac-
tors have previously been reported as being positively strin-
gently controlled in other bacteria: the stationary phase
sigma factors RpoS in E. coli [31,32] and SigB in C. glutami-
cum [18]. The stationary phase sigma factor in B. subtilis is
not directly regulated by ppGpp [33], although there is evi-
dence that its activity can be regulated in a RelA-dependent
manner [34]. In S. coelicolor, the four-fold decrease in
σ
-
hrdB transcription following ppGpp synthesis has the poten-
tial to strongly influence the promoters selected for transcrip-
tion by RNA polymerase, thereby leading to significant re-
orientation of genome expression. The concomitant and cor-
responding increase in expression of
σ
-SCO4005 can readily
be imagined to further contribute to this, although the extent
of this contribution is currently unknown. It is clear however
that SCO4005 is not involved in mediating the increase in
expression of the Act cluster that follows induction of ppGpp
synthesis, since induction of ppGpp in a relA SCO4005 dou-
ble mutant strain results in an increase rather than a decrease
in Act production (data not shown).
ppGpp synthesis induces transcription of the act and
cda antibiotic biosynthesis clusters, the hopanoids
cluster and a limited number of genes with regulatory
functions
In contrast to ppGpp-repression, the list of genes induced fol-
lowing ppGpp synthesis is dominated by those associated
with secondary metabolic processes (Figure 3; Table S2 in
Additional data file 3). Of the 98 identified as ppGpp-induced
in strain M653 [ΔrelA tipAp::relA(1.46 kb)], 23 belong to the
cluster of genes responsible for producing the antibiotic CDA,
5 are from the Act antibiotic biosynthetic cluster, and 2 are
from the hopanoids cluster. This is the first report linking
ppGpp synthesis to the regulation of the cda cluster, while
ppGpp-dependent induction of the act cluster has previously
been documented, acting via increasing transcription of the
pathway regulator actII-ORF4 [9]. No effect on transcription
of the Red biosynthetic gene cluster was observed. Although
not in the list of significantly ppGpp-induced genes, the array
data show an upward trend for transcription of the pathway-
specific regulatory gene controlling CDA production, cdaR,
following the initiation of ppGpp synthesis, and qRT-PCR
confirmed that it was induced two- to four-fold in a ppGpp-
dependent manner, similar to actII-ORF4 (Figure S2 in Addi-
tional data file 7). qRT-PCR also verified the induction of the
CDA non-ribosomal peptide synthase I gene, SCO3230, fol-
lowing ppGpp synthesis (data not shown). Four other genes
with putative regulatory functions (SCO4005, SCO4198,
SCO4263 and SCO4336) were also significantly induced by
ppGpp, and it is formally possible that they play a role in
mediating the ppGpp-dependent rise in transcription of the
actII-ORF4 and cdaR regulators. The induction in transcrip-
tion of SCO4005, SCO4198, and SCO4336 was confirmed by
qRT-PCR (Figure 4; Figure S3 in Additional data file 7). Tran-
scription of the sigma factor gene SCO4005 is, however,
paradoxically significantly up-regulated in the ppGpp- defi-
cient strain M570 (see below), and insertion mutagenesis of
SCO4005 produced no change in Act production (data not
shown). Similar mutant strains carrying transposon inser-
tions in the DNA-binding protein gene SCO4198 or the MarR-
family regulatory gene SCO4336 were reduced in their ability
to synthesise Act, but only on certain media (data not shown).
A deletion mutant of SCO4263, a TTA-containing regulatory
gene, possesses no antibiotic production phenotype [35].
Transcript abundances of regulatory genes previously
reported to positively influence expression of actII-ORF4
and/or cdaR, including afsR [36,37], afsS [38,39], scbR
[40],
and SCO4118 [41], were not significantly altered by induction
of ppGpp synthesis. In particular, qRT-PCR and S1 nuclease
R161.8 Genome Biology 2007, Volume 8, Issue 8, Article R161 Hesketh et al. />Genome Biology 2007, 8:R161
protection analysis confirmed that transcription of SCO4118,
encoding a TetR-family regulator known to bind to the pro-
moter of actII-ORF4 and activate its transcription [41], was
unaffected at levels of ppGpp induction resulting in signifi-
cant increases in transcription of the act cluster (data not
shown). It therefore appears that ppGpp is not acting on the
CDA and Act clusters via transcriptional control of these reg-
ulators (although post-transcriptional effects cannot be ruled
out), and a direct effect on pathway-regulator promoter activ-
ity seems more likely. However, it is interesting to note that
transcription of SCO6264, a reductase immediately adjacent
to the scbR-scbA locus, is up-regulated following ppGpp syn-
thesis, with a two-fold or higher induction confirmed by qRT-
PCR (Figure S4 in Additional data file 7). The enzyme
encoded by this gene is believed to play a role in modification
of the γ-butyrolactone signaling molecule putatively synthe-
sised by ScbA and known to influence production of both Act
and Red [40,42]. A SCO6264 deletion mutant is defective in
the synthesis of γ-butyrolactones (T Nihara, personal
communication).
Production of hopanoids in S. coelicolor occurs during the
transition from substrate to aerial hyphae, and they have
been proposed to play a role in alleviating stress associated
with membrane permeability [43]. The observed activation of
the hopanoid biosynthetic cluster upon ppGpp synthesis
could similarly represent a response to physiological stress.
Ten genes were found in both the ppGpp-repressed and the
ppGpp-induced gene lists, including five from the cda cluster.
All appear repressed in the 30 minute sample, but induced in
the 60 and 90 minute samples, possibly reflecting different
responses to the intracellular concentration of ppGpp, which
after 30 minutes is intermediate between the pre-induction
level and the maximum achieved in the later two time points.
ppGpp synthesis induces transcription of two genes
encoding alternative ribosomal proteins with a
putative role in zinc homeostasis
In contrast to the general trend for transcription of genes
associated with ribosome biogenesis to be repressed by
ppGpp, the ribosomal protein gene SCO0569 was induced by
the stringent factor following induction of the tipAp::relA
construct in strain M653 [ΔrelA tipAp::relA(1.46 kb)].
SCO0569 (rpmJ2) is predicted to encode an alternative form
of the L36 ribosomal protein specified by SCO4726 (rpmJ1).
The major difference between the two forms is that SCO0569
lacks cysteine residues and does not contain the CxxC zinc-
binding motif present in SCO4726 [44]. Transcription of
SCO0569 was also significantly different in the growth curve
comparison of M600 (relA+) and M570 (relA-), exhibiting a
lower level of expression in the mutant, and the pattern of
expression in the parent strain was different to the majority of
ribosomal protein genes (Figure 5a). The adjacent ribosomal
protein gene SCO0570 (rpmG3) encodes an analogous
cysteine-less alternative to the RpmG protein, and has a
similar pattern of expression to SCO0569 in the parent strain.
Although not present in the initial list of genes induced by
ppGpp, qRT-PCR indicates that it is in fact positively strin-
gently controlled, showing an approximately four-fold
increase in transcription 60 minutes after induction (Figure
5b).
In B. subtilis, the ability to replace certain ribosomal proteins
possessing zinc-binding motifs with alternative versions lack-
ing this property has been proposed to play a role in zinc
homeostasis, causing the release of the metal ions locked up
in the ribosome when conditions are limiting [45,46]. The
existence of alternative ribosomal proteins that do not require
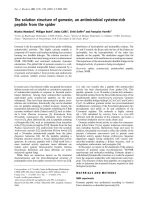
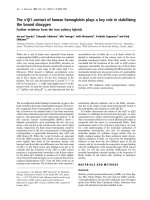
qRT-PCR shows transcription of the major vegetative sigma factor hrdB is repressed following induction of ppGpp synthesis, while the alternative ECF sigma factor encoded by SCO4005 is inducedFigure 4
qRT-PCR shows transcription of the major vegetative sigma factor hrdB is
repressed following induction of ppGpp synthesis, while the alternative
ECF sigma factor encoded by SCO4005 is induced. In each biological
replicate experiment, R1-R3, using strain M653 [ΔrelA tipAp::relA(1.46 kb)]
or the control strain M667 [ΔrelA tipAp], lane 1 corresponds to the pre-
induction sample (0 minutes) and lanes 2 and 3 correspond to the samples
taken 60 minutes after induction or non-induction with thiostrepton,
respectively. The average of three qRT-PCR determinations is shown, and
standard deviations are marked with error bars.
0
20000
40000
60000
80000
100000
120000
1.4 1) 0 1.4 1)
I60
1.4 1)
NI60
1.4 2) 0 1.4 2)
I60
1.4 2)
NI60
1.4 2) 0 1.4 3)
I60
1.4 3)
NI60
VEC 1)
0
VEC 1)
I60
VEC 1)
NI60
VEC 2)
0
VEC 2)
I60
VEC 2)
NI60
0
20000
40000
60000
80000
100000
120000
1.4 1) 0 1.4 1)
I60
1.4 1)
NI60
1.4 2) 0 1.4 2)
I60
1.4 2)
NI60
1.4 2) 0 1.4 3)
I60
1.4 3)
NI60
VEC 1)
0
VEC 1)
I60
VEC 1)
NI60
VEC 2)
0
VEC 2)
I60
VEC 2)
NI60
0
50000
100000
150000
200000
250000
300000
350000
1.4 1) 0 1.4 1)
I60
1.4 1)
NI60
1.4 2) 0 1.4 2)
I60
1.4 2)
NI60
1.4 2) 0 1.4 3)
I60
1.4 3)
NI60
VEC 1)
0
VEC 1)
I60
VEC 1)
NI60
VEC 2)
0
VEC 2)
I60
VEC 2)
NI60
Normalized transcript abundance
123123123231231231232312312312323 1231231232312312312323
R1 R2 R3 R1 R2
M653 M667
(b) SCO4005 (ECF σ)
(a) SCO5820 (σ−HrdΒ)
Genome Biology 2007, Volume 8, Issue 8, Article R161 Hesketh et al. R161.9
comment reviews reports refereed researchdeposited research interactions information
Genome Biology 2007, 8:R161
zinc for their function is also thought to provide a fail-safe
mechanism for de novo synthesis of ribosomes under zinc-
limiting conditions [47]. Recent work in S. coelicolor where a
zinc-specific regulator, Zur, was shown to control the expres-
sion of at least five such alternative ribosomal proteins sug-
gests that a similar system operates in streptomycetes
[48,49]. Our results indicate that ppGpp may have a role to
play in these processes in S. coelicolor, promoting the synthe-
sis of non-zinc-dependent ribosomes and increasing intracel-
lular zinc concentrations during times of nutritional stress
through induction of SCO0569 (rpmJ2) and SCO0570
(rpmG3) transcription. Owen et al. [48] found that SCO0569
and SCO0570 are co-transcribed from a single promoter that
is controlled by the alternative sigma factor SigR rather than
Zur, and it is possible that ppGpp mediates its effect on tran-
scription of these genes via SigR. However, transcription of
sigR is unaffected following induction of ppGpp synthesis,
suggesting the influence is post-transcriptional, or mediated
via an as yet unidentified SigR-independent promoter.
The phenotypic differences between M600 (relA+
ppGpp+) and M570 (relA- ppGpp-) during growth on
MYMTE are reflected in the significantly differently
expressed genes identified in the transcriptome data
Genes associated with morphological differentiation
Mutants of S. coelicolor that lack an obvious aerial mycelium
are called bld (for bald), while those that produce an aerial
mycelium but do not generate normal mature spores are
called whi (for white, reflecting a lack of grey spore pigment).
Studies of bld, whi and other mutant strains have established
models for the regulation of morphological development in S.
coelicolor (reviewed in [1,2]), where the bld cascade controls
checkpoints that eventually lead to the onset of aerial growth,
resulting in the formation of surface active molecules that
lower the water surface tension enabling hyphae to break free
and grow into the air. Once aerial, the hyphae are then cov-
ered with self-assembling layers of hydrophobic proteins
(hydrophobins) encoded by the rodlin (rdl) and chaplin (chp)
genes, and subsequently differentiate into chains of unige-
nomic spores in a process dependent on the whi genes. Inter-
estingly, the transcriptome data suggest that M570 (relA-
ppGpp-) fails to fully erect aerial hyphae and generate spores
because it is stalled between the two processes of surfactant
synthesis, and coating of the aerial hyphae with hydrophobins
(Figure 6a). The ram genes (SCO6681-85) responsible for the
production of the surfactant peptide SapB [50] were signifi-
cantly over-expressed in M570 from 24 h onwards, whereas
transcription of the rdl genes and seven of the eight chp genes
(the exception being chpB) was massively reduced in the
mutant strain. qRT-PCR analysis of the 48 h culture samples
confirmed a reproducible 40-fold or higher over-expression
of sapB in M570 when compared to the parent strain; a com-
parable increase in the level of the corresponding protein
product present in extracellular extracts at this time was con-
firmed by Western blotting (Figure 7). This is presumably the
result of increased transcription of the regulator of the ram
cluster, ramR (SCO6685), observed in strain M570; conceiv-
ably, transcription of ramR may be directly linked to the
nitrogen nutritional status of the cell via ppGpp synthesis.
RamR is also known to activate transcription of the rag clus-
ter SCO4072-75 that modulates both aerial hyphae formation
and sporulation in S. coelicolor [51]. Interestingly, however,
this operon is not over-expressed in M570 relative to the par-
ent strain, suggesting that an increase in ramR transcription
alone is not always sufficient for its activation (Figure 6a).
Perhaps this division in the two processes regulated by RamR
is the root cause of the stalling in the morphological differen-
tiation of M570 when grown on MYMTE. Mutation of
SCO4005 in the M570 background had no affect on SapB lev-
els (detected by western blotting; data not shown), and SapB
overproduction in the relA mutant is, therefore, not associ-
ppGpp synthesis and the expression of alternative ribosomal protein genesFigure 5
ppGpp synthesis and the expression of alternative ribosomal protein
genes.(a) Different growth-phase dependent expression of genes encoding
the alternative ribosomal proteins SCO0569 and SCO0570 compared to
the 50S ribosomal protein genes. In each panel, the x-axis represents
culture age, and the y-axis is normalized transcript abundance in log
10
scale. (b) qRT-PCR shows transcription of SCO0570 is activated following
induction of ppGpp synthesis. In each biological replicate experiment, R1-
R3, using strain M653 [ΔrelA tipAp::relA(1.46 kb)] or the control strain
M667 [ΔrelA tipAp], lane 1 corresponds to the pre-induction sample (0
minutes), and lanes 2 and 3 correspond to the samples taken 60 minutes
after induction or non-induction with thiostrepton, respectively. The
average of three qRT-PCR determinations is shown, and standard
deviations are marked with error bars.
M570 M600
12 – 1 20 h 12 – 1 20 h
50S ribosomal protein genes
M570
M600
12 – 1 20 h
12 – 1 20 h
SCO0569 and SCO0570
0
50000
100000
150000
200000
250000
300000
350000
1.4 1) 0 1.4 1)
I60
1.4 1)
NI60
1.4 2) 0 1.4 2)
I60
1.4 2)
NI60
1.4 2) 0 1.4 3)
I60
1.4 3)
NI60
VEC 1)
0
VEC 1)
I60
VEC 1)
NI60
VEC 2)
0
VEC 2)
I60
VEC 2)
NI60
Normalized transcript
abundance
123123123 123123
R1 R2 R3 R1 R2
M653 M667
0
50000
100000
150000
200000
250000
300000
350000
1.4 1) 0 1.4 1)
I60
1.4 1)
NI60
1.4 2) 0 1.4 2)
I60
1.4 2)
NI60
1.4 2) 0 1.4 3)
I60
1.4 3)
NI60
VEC 1)
0
VEC 1)
I60
VEC 1)
NI60
VEC 2)
0
VEC 2)
I60
VEC 2)
NI60
0
50000
100000
150000
200000
250000
300000
350000
1.4 1) 0 1.4 1)
I60
1.4 1)
NI60
1.4 2) 0 1.4 2)
I60
1.4 2)
NI60
1.4 2) 0 1.4 3)
I60
1.4 3)
NI60
VEC 1)
0
VEC 1)
I60
VEC 1)
NI60
VEC 2)
0
VEC 2)
I60
VEC 2)
NI60
Normalized transcript
abundance
123123123231231231232312312312323 1231231232312312312323
R1 R2 R3 R1 R2
M653 M667
(a)
(b)
R161.10 Genome Biology 2007, Volume 8, Issue 8, Article R161 Hesketh et al. />Genome Biology 2007, 8:R161
ated with the observed over-expression of the ECF sigma fac-
tor gene.
Transcription of the whiE genes specifying production of the
grey polyketide spore pigment of S. coelicolor was predictably
absent in M570, while transcripts of whiA (SCO1950),
together with those of the regulatory genes whiB (SCO3034)
and whiI (SCO6029), were also significantly reduced. In
addition, three of the seven bld genes, bldD, bldC and bldM,
were significantly differently expressed between the two
strains, with the transcriptional repressor bldD consistently
reduced in its expression in M570 compared to the parental
strain from 24 h onwards.
Genes associated with production of the pigmented antibiotics
Genes encoding the enzymes, transport systems and path-
way-specific regulatory elements necessary for the produc-
tion of the blue- (actinorhodin) or red- (undecylprodigiosin)
pigmented antibiotics are found within the act (SCO5071-92)
and red (SCO5877-98) gene clusters, respectively. Previous
studies of a relA null mutant grown in liquid culture indicated
diminished levels of transcription of the regulatory genes
actII-ORF4 and redD [7,9]. In this study, the peak in tran-
Transcription profiles of genes associated with (a) morphological differentiation, and (b) pigmented antibiotic production that were significantly differently expressed between strain M600 (relA+ ppGpp+) and M570 (relA- ppGpp-)Figure 6
Transcription profiles of genes associated with (a) morphological differentiation, and (b) pigmented antibiotic production that were significantly differently
expressed between strain M600 (relA+ ppGpp+) and M570 (relA- ppGpp-). In each panel, the x-axis represents culture age, and the y-axis is normalized
transcript abundance in log
10
scale.
M570
M600
12 – 120 h
12 – 120 h
ram
genes
M570
M600
12 – 120 h
12 – 120 h
rdl
genes
M570
M600
12 – 120 h
12 – 120 h
chp
genes
M570
M600
12 – 120 h
12 – 120 h
whiE
cluster
M570
M600
12 – 120 h
12 – 120 h
whiI
M570
M600
12 – 120 h
12 – 120 h
bldD
M570
M600
12 – 120 h
12 – 120 h
bldC
M570
M600
12 – 120 h
12 – 120 h
bldM
M570
M600
12 – 120 h
12 – 120 h
act
cluster
M570
M600
12 – 120 h
12 – 120 h
red
cluster
M570
M600
12 – 120 h
12 – 120 h
SCO4118
M570
M600
12 – 120 h
12 – 120 h
absR
locus
M570
M600
12 – 120 h
12 – 120 h
afsS
M570
M600
12 – 120 h
12 – 120 h
rag
genes
M570
M600
12 – 120 h
12 – 120 h
whiA
whiB
(a)
(b)
Genome Biology 2007, Volume 8, Issue 8, Article R161 Hesketh et al. R161.11
comment reviews reports refereed researchdeposited research interactions information
Genome Biology 2007, 8:R161
scription of genes from the red cluster observable in the par-
ent strain at 42 h is completely absent in the mutant (Figure
6b). Transcription of the act cluster genes, however, appears
to be switched on to almost similar levels in both M600
(relA+ ppGpp+) and M570 (relA- ppGpp-), but where
transcription persists to 120 h in the parent, levels in the
mutant decrease to a minimum by 60 h and production of the
blue pigment is not observed. Induction of ppGpp synthesis
has previously been reported to increase transcription of the
act cluster regulator actII-ORF4 [9], and similar results were
also found in this study (see below), offering an explanation
for the observed differences in expression of the act cluster
between the ppGpp+ (M600) and ppGpp- (M570) strains.
Genes with a reported role in controlling actinorhodin pro-
duction, and perhaps also influencing actII-ORF4 transcrip-
tion in this experiment, include SCO4118 [41], the absR locus
(SCO6992-93) [52], afsR [36,37] and afsS [38,39]. With the
exception of afsR (which functions via changes in the phos-
phorylation state of the gene product: reviewed in Horinouchi
[53]), all showed significantly reduced levels of transcription
in M570 (Figure 6b). However, knockout mutants in afsS,
SCO4118 and the absR locus were able to produce Act nor-
mally when grown on MYM TE (data not shown), indicating
that none were individually responsible for the reduction in
Act production observed in the mutant strain.
Other secondary metabolic gene clusters and
processes are affected in the relA mutant strain
Bentley et al. [23] identified 21 genes or gene clusters in the
genome of S. coelicolor predicted to specify for secondary
metabolites. Analysis of the list of genes that were found to be
significantly differently expressed between M570 (relA-
ppGpp-) and M600 (relA+ ppGpp+) to identify pathways
represented in the data indicated that, in addition to act, red
and whiE mentioned above, clusters for coelichelin
(SCO0489-99) the hopanoids (SCO6759-71), eicosapentae-
noic acid (SCO0124-29), CDA (SCO3210-49), an unknown
deoxysugar/glycosyltransferase product (SCO0381-0401),
and an unknown type I polyketide synthase product
(SCO6273-88) were affected, as illustrated in Figure S5 in
Additional data file 7 (see also Additional data file 5 and Table
S5 in Additional data file 3). Transcription of the cda antibi-
otic cluster had already been shown to be positively activated
by ppGpp (see above), and it was perhaps surprising to find
that only four cda cluster genes were apparently significantly
affected in the ppGpp- mutant strain M570. However, inspec-
tion of the data for all 12 time points initially gathered sug-
gested that the entire cluster was in fact influenced, with
transcription being delayed by 6 h and significantly reduced
in strain M570. This was confirmed by qRT-PCR analysis of
representative genes from the cluster, which showed that in
the 18 h samples, transcription of the regulator cdaR was two
to three-fold higher in strain M600 in each biological repli-
cate, and the gene encoding CDA peptide synthase I
(SCO3230) was five- to eight-fold higher (data not shown).
Transcription of the eicosapentaenoic acid (EPA) cluster
appears to be temporally associated with sporulation, peak-
ing at 60 h in the parent strain but not in the mutant. Nishida
et al. [54] have shown that EPA can directly protect E. coli
cells against oxidative damage by shielding the entry of reac-
tive oxygen species, and it is possible that it provides similar
protection for the spores of S. coelicolor.
Other functionally related sets of genes associated with sec-
ondary cellular processes that were significantly altered in
expression in the mutant strain include one of the gene clus-
ters annotated as being responsible for gas vesicle synthesis
(SCO0649-58
[55]), and also the two sets of genes involved in
carbon storage via production of glycogen/trehalose [56,57]
(Figure S6 in Additional data file 7). Yeo and Chater [57]
found that the glgBI genes (SCO5440-44) are responsible for
glycogen deposition in vegetatively growing cells, whereas
carbon storage in aerial and sporulating cells was performed
by the glgBII cluster (SCO7732-38). In agreement with this,
the profiles in Figure S6 (Additional data file 7) indicate that
the glgBI genes are transcribed transiently during early
growth of the parent strain M600, with expression of the glg-
BII cluster coinciding with morphological differentiation. In
contrast, the mutant strain exhibits transcription of only the
glgBI genes throughout its growth curve, consistent with the
idea that it is unable to switch from vegetative to aerial growth
on this media.
Co-expressed sets of genes induced only in the relA
mutant strain provide evidence that it is suffering from
prolonged stress
QT cluster analysis highlighted many sets of putatively co-
expressed genes that were over-expressed at around 24 h in
Comparison of SapB expression in M600 (relA+ ppGpp+) and M570 (relA- ppGpp-)Figure 7
Comparison of SapB expression in M600 (relA+ ppGpp+) and M570 (relA-
ppGpp-). (a) qRT-PCR confirms that transcription of sapB in the 48 h
samples is approximately 40-fold increased as a result of relA mutation. (b)
This is reflected in a large increase in SapB extracted from M570 (relA-)
cells harvested after 48 h growth on MYM TE agar, as detected by
Western blotting. Lanes 1, 2 and 3 indicate biological replicate samples.
The average of three qRT-PCR determinations is shown, and standard
deviations are marked with error bars. Western analysis was performed
on biological duplicate samples, and a representative result is shown.
0
1
2
3
4
5
6
7
600 t48 1 600 t48 2 600 t48 3 570 t48 1 570 t48 2 570 t48 3
12312 3
M570
relA
-
M600
relA
+
Normalized transcript
abundance
(a) (b)
M570
relA
-
M600
relA
+
R161.12 Genome Biology 2007, Volume 8, Issue 8, Article R161 Hesketh et al. />Genome Biology 2007, 8:R161
strain M570 (relA- ppGpp-) compared to the relA+ strain
(Additional data file 6). Strikingly, the vast majority of the
genes (55/59) from the four most populous clusters (QT6, 14,
27 and 42) were also found to be swiftly up-regulated follow-
ing addition of thiostrepton to liquid grown S. coelicolor
strain M667 [ΔrelA tipAp::]. The data for the genes present in
QT cluster 6 are presented in Figure 8 as an example. This
suggests that after 24 h growth, the M570 culture begins to
suffer a stress similar to that experienced by cells following
addition of the antibiotic thiostrepton. Approximately 50%
(26/55) of the affected genes are of completely unknown
function, but 12 are annotated as GNAT-family acetyltrans-
ferases, and 6 are from ABC transport systems. Whether
these are involved in alleviating stress by acetylating proteins
or toxic metabolites, and exporting endogenously produced
toxins from the cells remains to be determined.
The induction of ppGpp synthesis in liquid cultures of S. coe-
licolor was shown to influence ribosome biogenesis, certain
transport systems, and a number of genes from major carbon
metabolic pathways, amino acid metabolism and purine/
pyrimidine biosynthesis (see above). A consideration of the
pathways and functions represented by the genes found to be
differentially expressed between the ppGpp- mutant M570
and the parental strain M600 indicates considerable differ-
ences in processes central to metabolism and transport
(Table S5 in Additional data file 3, and also Additional data
file 5). Significant alterations in the expression of genes
involved in oxidative phosphorylation, amino acid biosynthe-
sis and metabolism, the urea cycle, aminoacyl-tRNA synthe-
sis, ubiquinone biosynthesis, and ribosome production were
all observed, despite the fact that the mutant strain grew as
rapidly as the parent during the early vegetative growth
phase. The suggestion that strain M570 (relA- ppGpp-) was
inducing some kind of stress response from 24 h onwards
during growth is perhaps related to the disturbances in cen-
tral metabolism, and may also be the root cause of the mutant
strain's failure to proceed correctly through its developmental
program under these growth conditions.
Strikingly, a total of 97 ABC transport system genes were sig-
nificantly altered in expression in the mutant strain, plus 9
associated with protein export. The latter include six genes
from the general Sec protein export system, which was found
to be repressed by induction of ppGpp synthesis (see above),
and one, tatC, from the TAT system responsible for exporting
folded proteins [58]. The differentially expressed ABC
transport systems included those predicted to be involved in
translocation of oligopeptides, siderophores, amino acids,
sugars and the RamAB transporter for export of the sur-
factant peptide SapB. Three genes encoding a putative sugar
permease (SCO3482-84) are up-regulated in M600 from 60
h onwards, but not in the relA mutant. These are adjacent to
dagA on the chromosome, encoding the secreted agarase
enzyme [59], and may be involved in uptake of the products
of agar degradation. They are clustered in their expression
pattern with nine other genes from the same chromosomal
locus, and an inverted repeat motif was identified upstream of
four of these genes, suggesting a potential site for co-regula-
tion (QT17 in Additional data file 6). Although M570 pro-
duces agarase normally on minimal media lacking sugars,
dagA was not apparently expressed in the mutant strain on
the MYMTE agar used for growth in this experiment, and
agarase activity could not be detected (data not shown). Per-
turbations in transport systems required for correct nutrition
could be envisaged to contribute to metabolic stress.
Evidence for gross alterations in the regulation of the
global transcriptional machinery associated with
mutation of relA
S. coelicolor possesses 65 sigma factors capable of directing
gene transcription via their ability to recruit RNA polymerase
to specific sets of promoters. The mRNA abundance of 23 of
these was significantly altered in the relA mutant strain
M570, which, if translated into alterations in sigma factor
protein abundance, could mediate wide-ranging effects on
gene transcription. Of the four principal sigma factors σ-
HrdA, B, C and D [30,60], transcription of hrdD was up-reg-
ulated in the mutant strain from 36 h to 60 h, while hrdC was
higher in the parent in all but the earliest time point (Figure
S7 in Additional data file 7). Transcription of hrdA was simi-
lar between the two strains (the gene for the major vegetative
sigma factor hrdB is not represented on the GeneChip used).
Interestingly, expression of the ECF-family sigma factor SigU
(SCO2954) identified by Gehring et al. [61] as playing a role
in morphological differentiation in S. coelicolor was mas-
sively up-regulated in the parent strain from 24 h onwards,
but not at all in the mutant strain, which fails to differentiate.
A group of 18 genes was identified by QT clustering that
shared a similar expression profile (QT cluster 11 in Addi-
tional data file 6), and a common ECF sigma-like promoter
Genes in QT cluster 6 that were identified as being significantly over-expressed in (a) M570 (relA- ppGpp-) relative to M600 (relA+ ppGpp+) during growth on agar plates, are also induced (b) following addition of thiostrepton (THIO) to strain M667 [ΔrelA tipAp::]Figure 8
Genes in QT cluster 6 that were identified as being significantly over-
expressed in (a) M570 (relA- ppGpp-) relative to M600 (relA+ ppGpp+)
during growth on agar plates, are also induced (b) following addition of
thiostrepton (THIO) to strain M667 [ΔrelA tipAp::]. In each panel, the x-
axis represents time (culture age in (a); time after induction in (b)), and the
y-axis is normalized transcript abundance in log
10
scale.
M570 M600
12 – 120 h
12 – 120 h
+THIO -THIO
0 - 90 min
0 - 90 min
M667
[
Δ
relA ti
p
A
p
::
]
(a) (b)
Genome Biology 2007, Volume 8, Issue 8, Article R161 Hesketh et al. R161.13
comment reviews reports refereed researchdeposited research interactions information
Genome Biology 2007, 8:R161
sequence was found upstream of 8 of these genes, suggesting
a regulon for SigU that includes transcription of its own pro-
moter. Eleven genes reported to form part of the SigR regulon
[62] were significantly differently expressed between the par-
ent and mutant strain, with the abundance of mRNA from
sigR itself being higher in the mutant strain between 24 and
60 h (Figure S7 in Additional data file 7). Transcription of one
of the two relA promoters is at least partially dependent on
SigR, suggesting a link with the ppGpp signaling mechanism.
SigR transcribes the RNA polymerase binding protein RbpA,
which, in contrast to the activity of ppGpp, exerts positive
control over transcription from a rRNA promoter [63]. rbpA
was significantly over-expressed in the ppGpp- mutant strain
M570 from 24 h to 60 h (Figure S7 in Additional data file 7),
perhaps suggesting that the mutant not only lacks the ability
to stringently shut down rRNA synthesis, but is employing
RbpA to actively stimulate rRNA production (and perhaps
transcription of other genes) following the initial period of
exponential growth.
Genes involved in nitrogen metabolism are
significantly over-expressed in strain M667 [ΔrelA
tipAp::] compared to M653 [ΔrelA tipAp::relA(1.46 kb)]
A total of 428 genes were significantly differently expressed
between non-induced cultures of strain M653 [ΔrelA
tipAp::relA(1.46 kb)], which exhibits a constitutively low
level of ppGpp synthesis (about 6 pmol mg
-1
dry weight), and
the control strain M667 [ΔrelA tipAp::], which is totally
defective in the ability to produce ppGpp (Additional data file
4). Interestingly, of the 352 genes that were more highly
expressed in strain M667 (ppGpp = 0), those with functions
related to nitrogen metabolism were significantly repre-
sented, and, in particular, transcription of glutamine syn-
thase II (glnII) and the amtB-glnK-glnD operon was
massively up-regulated (Figure S8 in Additional data file 7).
This may reflect repression of these genes by the low levels of
ppGpp present in strain M653 [ΔrelA tipAp::relA(1.46 kb)],
although increasing ppGpp levels from 6 to 20 pmol mg
-1
dry
cell weight in the induction experiments had no significant
affect on their expression. Another, perhaps more likely, pos-
sibility is that it is associated with the differing intracellular
ATP concentrations between the two strains, where strain
M667 [ΔrelA tipAp::] has approximately 30% of the levels
observed in M653 [ΔrelA tipAp::relA(1.46 kb)] (Figure 1).
Genes from the antibiotic biosynthesis clusters Red, Act and
CDA were also more highly expressed in strain M667 [ΔrelA
tipAp::] (Table S3 in Additional data file 3). The Act and CDA
clusters were found to be activated following induction of
ppGpp-synthesis in strain M653 [ΔrelA tipAp::relA(1.46 kb)]
(see above) and it seems paradoxical that a comparison of
samples derived from cells with intracellular ppGpp concen-
trations measured at 0 or 6 pmol mg
-1
dry cell weight would
show an over-expression of these clusters in the strain lacking
ppGpp. However, the CDA cluster, although ultimately
induced, appears to be repressed in the first 30 minutes after
induction of ppGpp synthesis in M653, suggesting that it
responds differently to subtly different concentrations of
ppGpp, and this may also be the case for the other clusters.
Indeed, different levels of ppGpp within the cells may create
specific states of 'regulatory poise' that are reflected in differ-
ent global patterns of gene transcription. The observation
that 11 genes from two-component regulatory systems are sig-
nificantly up-regulated in strain M667 (ppGpp = 0 pmol mg
-
1
) compared to M653 (ppGpp = 6 pmol mg
-1
) supports this
idea.
Conclusion
If transcription of the S. coelicolor genome approximates to
the situation described for E. coli by Bremer and Davies [64],
then stable RNA synthesis probably constitutes about 80% of
cellular transcription under optimal growth conditions.
Ribosomal RNA synthesis, resulting from transcription of
just six operons and directed by RNA polymerase containing
the major vegetative sigma factor σ-HrdB, would account for
85% of this figure. Thus, the vast majority of cellular RNA
polymerase during active growth would be concentrated into
transcription foci centered on the rRNA operons in the nucle-
oid, analogous to observations made in E. coli [65,66]. This
dominance of stable RNA synthesis is proposed to sequester
most of the RNA polymerase during active growth, reducing
its availability for transcription of other genes in the genome
with functions non-essential for growth (reviewed in [67]).
Induction of ppGpp synthesis in E. coli not only shuts down
rRNA transcription, but also causes the transcription foci to
rapidly disperse [65], thereby presumably freeing up RNA
polymerase and facilitating the subsequent redirection of
transcription, where genes important for starvation survival
and virulence are favored over those required for growth and
proliferation. The results of the present study portray the
occurrence of an analogous process in S. coelicolor, where
ppGpp synthesis causes a dramatic switch in cellular physiol-
ogy, with transcription of genes more usually associated with
stationary phase processes, including secondary metabolism
and alternative ribosomal protein synthesis, being activated
at the expense of those with functions important for active
growth. This is presumably also additionally influenced by
the observed significant decrease in transcription of the
major vegetative sigma factor σ-hrdB, and possibly also by
the corresponding induction of the alternative ECF sigma fac-
tor SCO4005.
S. coelicolor is a model organism for the streptomycetes,
industrially important producers of bioactive secondary
metabolites, and the observed ppGpp-mediated redirection
of gene transcription involves changes in operons and gene
clusters that are particularly characteristic of the genus: the
repression of conservons, the induction of antibiotic gene
clusters, and the expression of the morphogenetic sapB,
chaplin and rodlin genes. While the exact regulatory route by
which this is achieved remains to be determined (it may be a
R161.14 Genome Biology 2007, Volume 8, Issue 8, Article R161 Hesketh et al. />Genome Biology 2007, 8:R161
direct effect of ppGpp on the selection of the promoters of
these genes by RNA polymerase), this study has revealed a
number of genes with regulatory functions whose transcrip-
tion is significantly altered following ppGpp synthesis, and
has provided new insights and greatly advanced our under-
standing of the global regulatory influence of ppGpp in S.
coelicolor.
Materials and methods
Bacterial strains
S. coelicolor M600 is a prototrophic plasmid-free derivative
of S. coelicolor A3(2) [68]. M570 (ΔrelA) is a mutant of M600
in which relA has been replaced by a hygromycin resistance
cassette [7]. M653 [ΔrelA tipAp::relA(1.46 kb)] and M667
[ΔrelA tipAp::] are derivatives of M570 carrying the inte-
grated plasmids pIJ6083 and pIJ8600, respectively [8].
M653 can be induced to produce ppGpp by treatment with
thiostrepton, while M667 is a control strain that does not syn-
thesise ppGpp following addition of thiostrepton.
Culture conditions
For comparison of M600 and M570 (ΔrelA) during surface
growth on agar plates, NUNC bioassay dishes (245 × 245 × 25
mm) containing MYMTE agar (maltose 4 g l
-1
, yeast extract 4
g l
-1
, malt extract 10 g l
-1
, Difco Bacto agar 20 g l
-1
, R2YE trace
element solution [68] 2 ml l
-1
) overlain with sterile cellophane
were inoculated by evenly spreading 6 × 10
8
spores per plate,
and incubated at 30°C. Samples of mycelia were harvested at
12, 18, 24, 30, 36, 42, 48, 60, 72, 84, 96 and 120 h by scraping
off with a sterile spatula and immediately flash-frozen in liq-
uid nitrogen. Cultures were visually assessed for morphologi-
cal differentiation and production of pigmented antibiotics.
Growth curves were performed in triplicate using spore prep-
arations derived from independent single colonies (that is,
biological triplicates), and samples were stored frozen at -
80°C prior to RNA extraction.
The ppGpp induction experiments were performed using
M653 and M667 essentially as described in Hesketh et al. [9].
Briefly, spores (about 10
10
cfu ml
-1
) were germinated in 2 xYT
medium [68] for 7 h at 30°C. Germlings were harvested by
centrifugation (5 minutes at 4000 g), resuspended in mini-
mal medium supplemented with 0.2% Casamino acids
(SMM) [68], and briefly sonicated to disperse any aggregates
before inoculation into 50 ml SMM in 250 ml siliconized
flasks containing coiled stainless steel springs. Each flask
received the equivalent of 5 × 10
7
cfu, and flasks were incu-
bated with vigorous agitation at 30°C. For each strain, when
the OD450 nm reached 0.5-0.6, cultures were pooled to give
400 ml and the 0 minute sampling performed. The pooled
culture was re-divided into two equal aliquots, and one half
treated with 25 μg ml
-1
thiostrepton in DMSO to induce tran-
scription from tipAp while the other half acted as the negative
control and received only the equivalent volume of DMSO.
Incubation was continued (approximately 180 ml volumes in
1 l flasks) and further samples were taken from both induced
and control cultures after 30, 60 and 90 minutes. On sam-
pling, 20 ml aliquots were taken for ppGpp assays, 10 ml for
dry cell weight determination, and 10 ml for RNA extraction.
The culture aliquot for producing the RNA sample was imme-
diately treated with twice the volume of RNA protect bacteria
solution (Qiagen, Germantown, MD, USA) according to the
manufacturer's instructions to stabilize the RNA content of
the cells, and the resultant cell pellet stored at -80°C prior to
processing for RNA extraction. The experiments were per-
formed in triplicate for each strain, using spore preparations
derived from independent single colonies (that is, biological
triplicates).
RNA isolation and quality control
Total RNA was isolated from mycelia harvested and stored
from liquid cultures using the RNeasy midi kit from Qiagen
largely according to the manufacturer's instructions, but with
several modifications. Cell pellets were resuspended in TE
buffer (1 ml) containing 15 mg ml
-1
lysozyme and incubated
for 60 minutes at room temperature. After addition of RNe-
asy RLT buffer (4 ml) samples were sonicated for 3 cycles of
20 s (Sanyo Soniprep 150, amplitude 18 microns), resting on
ice for 1 minute between bursts, then extracted twice with
phenol-chloroform (4 ml) and once with chloroform (4 ml).
Extracts were then treated with ethanol (2.8 ml) and applied
to the RNeasy midi columns for purification according to the
supplied protocol, including an on-column DNaseI digestion
step for 60 minutes at room temperature. Purified RNA was
finally eluted in 300 μl RNase-free water. For purification of
RNA from mycelia harvested from agar plates using RNeasy
columns, cells were first disrupted by freeze-grinding under
liquid nitrogen. Aliquots (0.1-0.25 g) of the frozen powder
were transferred to a 2 ml Eppendorf tube containing RLT
buffer (0.7 ml) and sterile sand (0.25 g: Sigma -50+70 mesh;
Sigma, Gillingham, Dorset, UK), and vortexed vigorously for
90 s to shear genomic DNA and homogenize the sample. Cell
debris and sand were removed by centrifugation (13,000
rpm, 4 minutes) and the sample mixed with ethanol (0.5 ml)
then applied to an RNeasy mini column and processed
according to the protocols supplied, including an on-column
DNaseI digestion step for 60 minutes at room temperature.
Purified RNA was finally eluted in 100 μl RNase-free water.
RNA concentration was determined by absorbance at 260 nm
using a Nanodrop spectrophotometer, and absorbance ratios
at 260/280 nm and 260/230 nm used to assess quality. All
samples were also subjected to a final quality check by sepa-
rating 1 μl of each using Agilent RNA6000 nano LabChips
®
(Agilent Technology 2100 Bioanalyzer Version A.01.20 SI211;
Agilent, Santa Clara, CA, USA).
Affymetrix GeneChip hybridization and data collection
Purified total RNA (10 μg) was processed into labeled and
fragmented cDNA for hybridization to Streptomyces
diS_div712a GeneChip arrays according to the manufac-
Genome Biology 2007, Volume 8, Issue 8, Article R161 Hesketh et al. R161.15
comment reviews reports refereed researchdeposited research interactions information
Genome Biology 2007, 8:R161
turer's published protocol for Pseudomonas aeruginosa [69].
Briefly, cDNA synthesis was performed using 72% GC-con-
tent random primers and Superscript III reverse tran-
scriptase (Invitrogen). The resulting cDNA was fragmented to
approximately a 50-200 base-pair size range by partial diges-
tion with DNaseI, and then terminally labeled with biotin
using terminal transferase in the presence of biotinylated
ddUTP. The labeled fragmented cDNA was hybridized to the
GeneChips according to protocols provided by the
manufacturer in a Hybridization Oven model 640 (Affyme-
trix, Santa Clara, CA, USA). The GeneChips were washed and
stained with streptavidin-phycoerythrin using GeneChip flu-
idics workstation model 450, and then scanned with a Gene
Array Scanner. Model 2500 was used for scanning the Gene-
Chips from the M570 versus M600 comparison experiment,
while all other GeneChips were scanned using model 3000
7G.
General methods for Affymetrix GeneChip data
analysis
The gene expression data were preprocessed using the Robust
Multichip Average (RMA) algorithm of Irizarry et al. [70], as
implemented in RMAExpress version 0.2. This performs
steps for background adjustment, quantile normalization and
summarization of the probe-level data to produce a single
normalized value for expression of each gene on the chip. The
data were then imported into GeneSpring 7.0 (Agilent Tech-
nologies, Santa Clara, California, USA), converting to log
2
val-
ues and normalizing per gene to the median. Error models
based on replicate values were implemented.
The quality of the array data was checked using a variety of
tools, including the 'affyPLM', 'affy' and 'simpleaffy' packages
for the statistical computing environment R [71], quality con-
trol methods available within GeneSpring 7, and data from
report files generated in the Affymetrix GeneChip operating
software following scanning of the arrays. Three arrays for the
following samples failed quality control and were omitted
from the analysis: non-induced sample at 60 minutes for rep-
licate 1 of M667 [ΔrelA tipAp::]; M600 growth curve 60 h
sample replicate 2; M570 growth curve 60 h sample replicate
2.
Array data have been deposited at the MIAME-compliant
ArrayExpress database under accession numbers E- MEXP-
1098, E-MEXP-1119 and E-MEXP-1120 [72].
Identification and analysis of significantly differentially
expressed genes
Typically for each experiment detailed below, the quality con-
trolled array data were filtered in GeneSpring to remove
genes deemed to be expressed at a level below reliable detec-
tion by determining those with a raw signal value below a
defined background cut-off value (usually 20 or 25) in all
samples. The results were further filtered to remove genes not
significantly changing under the conditions of the experiment
by identifying those with normalized expression values
between 0.8 and 1.2 (1.5-fold change limit) or 0.667 and 1.334
(2-fold change limit) in all conditions, as stated in the text.
The filtered data were then subjected to two-way ANOVA to
identify genes significantly altered under the experimental
conditions. The two parameters tested were 'induction' and
'time' for the thiostrepton induction experiments, and 'strain'
and 'time' for the growth curve comparison of strains M570
and M600. Two-way ANOVA is able to assess the individual
effect on transcript abundance of each parameter in each
sample, and also whether there is an interaction or additive
effect between the parameters. Three probability values (P
values) are generated: one for each parameter independently,
and one measuring the interaction between the two parame-
ters. Two-way ANOVA was performed in GeneSpring using
the parametric test option with a false discovery rate of P <
0.01 or P < 0.05, and assuming variances to be equal. P values
were corrected using the Benjamini and Hochberg false dis-
covery rate multiple testing correction procedure. Details of
the statistical calculations used in the software can be
accessed through the manufacturer's manual.
Final lists of significantly differently expressed genes were
analysed to identify over-represented (P < 0.05) pathways or
functions using the 'biological pathway analysis' script in
GeneSpring, cross-comparing the gene lists to the pathways
listed in KEGG [73] and to in-house collated lists of secondary
metabolism clusters, and functional groups of genes. To iden-
tify groups of genes exhibiting similar expression profiles, QT
clustering was performed in GeneSpring with appropriate
user-defined correlation coefficient cut-off values. Where
mentioned, the upstream regions of co-expressed genes were
analysed for common promoter elements using the MEME
DNA motif search tool [74].
Upon induction of ppGpp synthesis in M653 [
Δ
relA
tipAp::relA(1.46 kb)]
Quality controlled data for genes were filtered to remove
those with raw signal values below 20 in all samples (992
genes removed), and with normalized expression values
between 0.8 and 1.2 in all 8 conditions (3,962 more genes
removed). The remaining list of 2,703 genes was subjected to
two-way ANOVA (P < 0.05) to identify those genes
significantly differentially expressed between the induced
and non-induced cultures.
A final list of ppGpp-affected genes was produced by remov-
ing those determined from the control experiment using
strain M667 [ΔrelA tipAp::] as being thiostrepton-affected
(see below). This was divided into clearly ppGpp-repressed
and ppGpp-induced genes as follows. For each of the 30, 60
or 90 minute induced samples, those genes with normalized
expression values >1.5-fold lower or higher than both the 0
minute sample and the non-induced sample taken at the cor-
responding time were identified, and the data for each time
point combined.
R161.16 Genome Biology 2007, Volume 8, Issue 8, Article R161 Hesketh et al. />Genome Biology 2007, 8:R161
Changes in gene expression in M667 [
Δ
relA tipAp::] upon
treatment with thiostrepton
Quality controlled data for genes (omitting the 60 minute
sample for which a full set of data was not available) were fil-
tered to remove those with raw signal values below 20 in all
samples (448 genes removed), and with normalized values
between 0.8 and 1.2 in all 8 conditions (3,685 more genes
removed). The remaining list of 3,524 genes was subjected to
two-way ANOVA (P < 0.05) to identify those genes signifi-
cantly affected by thiostrepton addition. Only four genes were
obtained using this approach (Additional data file 8), which is
clearly an underestimate, and likely to reflect the fact that the
analyses were performed only in duplicate for this study,
rather than triplicate as above, thus reducing the penetration
of the statistical analysis. To identify additional genes
induced or repressed by thiostrepton addition, the 30 and 90
minute sample data were used to determine those genes that
are 1.5-fold or higher up- or down-regulated in expression
over both the 0 minute sample and the non-induced sample
taken at the corresponding time. This yielded 172 and 258
genes for the 30 and 90 minute datasets, respectively, and a
combined list of 416 thiostrepton-affected genes that includes
the four genes previously identified as being significantly dif-
ferentially expressed (Additional data file 8). Comparison
with the 752 genes identified as being significantly affected by
thiostrepton-induction of ppGpp synthesis in strain M653
[ΔrelA tipAp::relA(1.46 kb)] revealed a total of 163 genes that
appear in both lists and whose expression can therefore be
considered as being reproducibly altered by addition of
thiostrepton.
Changes in gene expression between non-induced samples of strain
M653 and M667
The microarray data for the 0, 30 and 90 minute non-induced
samples of strains M653 and M667 were filtered to remove
those with raw signal values below 25 in all samples (956
genes removed), and with normalized values between 0.667
and 1.334 in all conditions (4,401 more genes removed). The
remaining list of 2,298 genes was subjected to two-way
ANOVA (P < 0.01) to identify those genes significantly differ-
ent between the two strains.
Changes in gene expression between M600 (relA+) and M570
(relA-) during growth on MYMTE
The microarray data for time points 12, 24, 36, 48, 60, 84, 96,
and 120 h were filtered to remove those with raw signal values
below 25 in all samples (2,882 genes removed), and with nor-
malized values between 0.667 and 1.334 in all conditions
(1,558 more genes removed). The remaining list of 3,217
genes was subjected to two-way ANOVA (P < 0.01) to identify
those genes significantly differently expressed between the
two strains.
Quantification of intracellular nucleotides
Extraction and HPLC analysis of ppGpp, ATP and GTP was
carried out as described by Strauch et al. [16].
qRT-PCR analysis of selected differentially expressed
genes
Specific primers for selected genes of interest were designed
using the web-based tool Primer3 [75]. Each RNA sample (5
μg) was subjected to RNase-free DNaseI treatment (Invitro-
gen (Carlsbad, CA, USA), amplification grade) in a 50 μl reac-
tion volume according to the manufacturer's instructions. For
cDNA synthesis, 8 μl of the resulting DNaseI-treated RNA
was used as template in a 20 μl reaction volume employing
Superscript III First Strand Synthesis Supermix (Invitrogen)
according to the manufacturer's instructions. PCR cycling
was performed at 25°C for 10 minutes, 42°C for 120 minutes,
50°C for 30 minutes, 55°C for 30 minutes and then 5 minutes
at 85°C. To control for DNA contamination inthe qRT-PCR, a
duplicate set of cDNA synthesis reactions were performed but
with the reverse transcriptase enzyme omitted. Following
RNaseH treatment, the samples were diluted 1:100 with Tris-
EDTA (10 mM to 1 mM, pH 8.0), and 2.5 μl were used in the
quantitative PCR reaction with SYBR Greener qPCR super-
mix (Invitrogen) according to the manufacturer's instruc-
tions. Each 25 μl reaction contained 200 nM of forward and
reverse primers, and 3 μl of 40% DMSO. PCR cycling was per-
formed in a Chromo4 machine (BioRad, CA, USA), typically
at 50°C for 2 minutes, 95°C for 10 minutes, followed by 40
cycles of 95°C for 15 s and 58°C for 60 s. Parallel reactions
were performed in the same 96-well plate using different
dilutions of genomic DNA to generate a standard curve for
each selected gene. All determinations were performed in
triplicate, and the results were analysed using Opticon 2
Monitor software (MJ Research, Waltham, MA, USA). All
values were ultimately normalized to an endogenous control
gene, SCO4742. This gene was selected from the microarray
data following a search for genes whose expression was unaf-
fected by induction of ppGpp synthesis, by mutation in relA,
and by sampling time. The control samples from cDNA syn-
thesis lacking reverse transcriptase gave values comparable
to background in all cases, indicating that the RNA samples
were not contaminated with genomic DNA.
Detection of SapB
SapB extraction and detection were performed according to
Willey et al. [76], using Western blots visualized with the
Amersham ECL Western Blotting detection system (GE
Healthcare, Uppsala, Sweden) according to the manufac-
turer's instructions. Biological duplicate cultures were
extracted after 48 h growth on MYMTE, and both sets gave
similar results.
Additional data files
The following additional data are available with the online
version of this paper. Additional data file 1 lists the changes in
gene expression upon induction of ppGpp synthesis in M653
[ΔrelA tipAp::relA(1.46 kb)]. Additional data file 2 lists genes
whose expression is significantly affected by ppGpp. Addi-
tional data file 3 contains supplementary Tables S1-S5.
Genome Biology 2007, Volume 8, Issue 8, Article R161 Hesketh et al. R161.17
comment reviews reports refereed researchdeposited research interactions information
Genome Biology 2007, 8:R161
Additional data file 4 lists changes in gene expression
between non-induced samples of strain M653 [ΔrelA
tipAp::relA(1.46 kb)] and M667 [ΔrelA tipAp::]. Additional
data file 5 lists significantly differently expressed genes
between strain M600 (relA+ ppGpp+) and M570 (relA-
ppGpp-) during growth on MYM TE agar. Additional data file
6 summarises the results of QT clustering of 2,031 genes
significantly differently expressed between M600 (relA+
ppGpp+) and M570 (relA- ppGpp-). Additional data file 7
contains supplementary Figures S1-S8. Additional data file 8
shows changes in gene expression in M667 [ΔrelA tipAp::]
upon treatment with thiostrepton.
Additional data file 1Changes in gene expression upon induction of ppGpp synthesis in M653 [ΔrelA tipAp::relA(1.46 kb)]Lists the results of two-way ANOVA of the microarray data obtained following the induction of M653 [ΔrelA tipAp::relA(1.46 kb)] cultures by treatment with thiostrepton.Click here for fileAdditional data file 2Genes whose expression is significantly affected by ppGppGenes whose expression is significantly affected by ppGppClick here for fileAdditional data file 3File containing supplementary Tables S1-S5The tables summarise the pathways and processes that are signifi-cantly represented by the 189 genes shown to be ppGpp-repressed (Table S1); the 98 genes shown to be ppGpp-induced (Table S2); the 352 genes more highly expressed in non-induced cultures of M667 compared to M653 (Table S3); the 76 genes reduced in expression in non-induced cultures of M667 compared to M653 (Table S4); and the 2031 genes significantly differently expressed in M570 compared to M600 (Table S5).Click here for fileAdditional data file 4Changes in gene expression between non-induced samples of strain M653 [ΔrelA tipAp::relA(1.46 kb)] and M667 [ΔrelA tipAp::]Lists the results of two-way ANOVA of the microarray data obtained when comparing the non-induced cultures of strains M653 and M667Click here for fileAdditional data file 5Significantly differently expressed genes between strain M600 (relA+ ppGpp+) and M570 (relA- ppGpp-) during growth on MYM TE agarLists the results of two-way ANOVA of the microarray data obtained when comparing strains M600 (relA+ ppGpp+) and M570 (relA- ppGpp-) during surface growth on solid mediaClick here for fileAdditional data file 6QT clustering of 2,031 genes significantly differently expressed between M600 (relA+ ppGpp+) and M570 (relA- ppGpp-)QT clustering of 2031 genes significantly differently expressed between M600 (relA+ ppGpp+) and M570 (relA- ppGpp-)Click here for fileAdditional data file 7File containing supplementary Figures S1-S8Figures S1-S4 present qRT-PCR data quantifying expression of genes following induction of ppGpp synthesis: S1 shows cvn1, cvn10 and cvn13; S2 shows actII-ORF4 and cdaR; S3 shows SCO4198 and SCO4336; and S4 shows SCO6264. Figures S5-S7 display expression profiles for genes that are significantly differ-ently expressed between M600 and M570: S5 shows secondary metabolite gene clusters; S6 shows glycogen biosynthesis clusters and the gvp2 cluster; and S7 shows hrdC, hrdD, sigR and rbpA. Figure S8 compares expression profiles of glnII, amtB, glnK and glnD in non-induced cultures of M667 and M653.Click here for fileAdditional data file 8Changes in gene expression in M667 [ΔrelA tipAp::] upon treat-ment with thiostreptonLists genes in S. coelicolor whose expression was identified as being affected by thiostrepton (as detailed in the Materials and methods)Click here for file
Acknowledgements
We thank James Hadfield for assistance with Affymetrix microarray proto-
cols, Govind Chandra for help with a variety of bioinformatics tasks, Paul
Dyson for supplying transposon mutagenised cosmids of S. coelicolor, and
Joanne Willey for the generous gift of SapB antibody. We thank Verenium
Corporation (formerly Diversa Corporation) for the S. coelicolor Affymetrix
GeneChips. This work was funded by a grant to the John Innes Centre from
the Biotechnology and Biological Sciences Research Council.
References
1. Chater KF: Regulation of sporulation in Streptomyces coeli-
color A3(2): a checkpoint multiplex? Curr Opin Microbiol 2001,
4:667-673.
2. Claessen D, de Jong W, Dijkhuizen L, Wosten HA: Regulation of
Streptomyces development: reach for the sky! Trends Microbiol
2006, 14:313-319.
3. Bibb MJ: Regulation of secondary metabolism in
streptomycetes. Curr Opin Microbiol 2005, 8:208-215.
4. Sands MK, Roberts RB: The effects of a tryptophan-histidine
deficiency in a mutant of Escherichia coli. J Bacteriol 63:505-511.
5. Stent GS, Brenner S: A genetic locus for the regulation of ribo-
nucleic acid synthesis. Proc Natl Acad Sci USA 1961, 47:2005-2014.
6. Magnusson LU, Farewell A, Nystrom T: ppGpp: a global regulator
in Escherichia coli. Trends Microbiol 2005, 13:236-242.
7. Chakraburtty R, Bibb MJ: The ppGpp synthetase gene (relA) of
Streptomyces coelicolor A3(2) plays a conditional role in anti-
biotic production and morphological differentiation. J
Bacteriol 1997, 179:5854-5861.
8. Sun J, Hesketh A, Bibb MJ: Functional analysis of relA and rshA,
two relA/spoT homologues of Streptomyces coelicolor A3(2).
J Bacteriol 2001, 183:3488-3498.
9. Hesketh A, Sun J, Bibb MJ: Induction of ppGpp synthesis in Strep-
tomyces coelicolor A3(2) grown under conditions of nutri-
tional sufficiency elicits actII-ORF4 transcription and
actinorhodin biosynthesis. Mol Microbiol 2001, 39:136-144.
10. Ochi K: A rel mutation abolishes the enzyme induction
needed for actinomycin synthesis by Streptomyces
antibioticus. Agric Biol Chem 1987, 51:829-835.
11. Ochi K: Metabolic initiation of secondary metabolism and dif-
ferentiation by Streptomyces griseus : significance of the strin-
gent response (ppGpp) and GTP content in relation to A
factor. J Bacteriol 1987, 169:3608-3616.
12. Ochi K: A relaxed (rel) mutant of Streptomyces coelicolor
A3(2) with a missing ribosomal protein lacks the ability to
accumulate ppGpp, A-factor and prodigiosin. J Gen Microbiol
1990, 136:2405-2412.
13. Ochi K: Streptomyces relC mutants with an altered ribosomal
protein ST-L11 and genetic analysis of a Streptomyces griseus
relC mutant. J Bacteriol 1990, 172:4008-4016.
14. Kelly KS, Ochi K, Jones GH: Pleiotropic effects of a relC muta-
tion in Streptomyces antibioticus. J Bacteriol 1991, 173:2297-2300.
15. Braeken K, Moris M, Daniels R, Vanderleyden J, Michels J: New hori-
zons for (p)ppGpp in bacterial and plant physiology. Trends
Microbiol 2006, 14:45-54.
16. Strauch E, Takano E, Bayliss HA, Bibb MJ: The stringent response
in Streptomyces coelicolor A3(2). Mol Microbiol 1991, 5:289-298.
17. Eymann C, Homuth G, Scharf C, Hecker M: Bacillus subtilis func-
tional genomics: global characterization of the stringent
response by proteome and transcriptome analysis. J Bacteriol
2002, 184:2500-2520.
18. Brockmann-Gretza O, Kalinowski J: Global gene expression dur-
ing stringent response in Corynebacterium glutamicum in
presence and absence of the rel gene encoding (p)ppGpp
synthase.
BMC Genomics 2006, 7:230.
19. Chang D-E, Smalley DJ, Conway T: Gene expression profiling of
Escherichia coli growth transitions: an expanded stringent
response model. Mol Microbiol 2002, 45:289-306.
20. Traxler MF, Chang D-E, Conway T: Guanosine 3',5'-bispyrophos-
phate coordinates global gene expression during glucose-lac-
tose diauxie in Escherichia coli. Proc Natl Acad Sci USA 2006,
103:2374-2379.
21. Bertram R, Schlicht M, Mahr K, Nothaft H, Saier MH Jr, Titgemeyer
F: In silico and transcriptional analysis of carbohydrate uptake
systems of Streptomyces coelicolor A3(2). J Bacteriol 2004,
185:1362-1373.
22. Borovok I, Gorovitz B, Schreiber R, Aharonowitz Y, Cohen G: Coen-
zyme B12 controls transcription of the Streptomyces class Ia
ribonucleotide reductase nrdABS operon via a riboswitch
mechanism. J Bacteriol 2006, 188:2512-2520.
23. Bentley SD, Chater KF, Cerdeno-Tarraga A-M, Challis GL, Thomson
NR, James KD, Harris DE, Quail MA, Kieser H, Harper D, et al.:
Complete genome sequence of the model actinomycete
Streptomyces coelicolor A3(2). Nature 2002, 417:141-147.
24. Genome Project of Streptomyces avermitilis [http://avermiti
lis.ls.kitasato-u.ac.jp/]
25. Wellcome Trust Sanger Institute: Streptomyces scabies
[ />26. Komatsu M, Takano H, Hiratsuka T, Ishigaki Y, Shimada K, Beppu T,
Ueda K: Proteins encoded by the conservon of Streptomyces
coelicolor A3(2) comprise a membrane-associated hetero-
complex that resembles eukaryotic G protein-coupled regu-
latory system. Mol Microbiol 2006, 62:1534-1546.
27. Komatsu M, Kuwahara Y, Hiroishi A, Hosono K, Beppu T, Ueda K:
Cloning of the conserved regulatory operon by its aerial
mycelium-inducing activity in an amfR mutant of Streptomy-
ces griseus.
Gene 2003, 306:79-89.
28. Stephens JC, Artz SW, Ames BN: Guanosine 5'-diphosphate 3'-
diphosphate (ppGpp): positive effector of histidine operon
transcription and general signal for amino acid deficiency.
Proc Natl Acad Sci USA 1975, 72:4389-4393.
29. Shand RF, Blum PH, Mueller RD, Riggs DL, Artz SW: Correlation
between histidine operon expression and guanosine 5'-
diphosphate 3'-diphosphate levels during amino acid down-
shift in stringent and relaxed strains of Salmonella
typhimurium. J Bacteriol 1989, 171:737-742.
30. Buttner MJ, Chater KF, Bibb MJ: Cloning, disruption, and
transcriptional analysis of three RNA polymerase sigma fac-
tor genes of Streptomyces coelicolor A3(2). J Bacteriol 1990,
172:3367-3378.
31. Gentry DR, Hernandez VJ, Nguyen LH, Jensen DB, Cashel M: Syn-
thesis of the stationary-phase sigma factor sigma s is posi-
tively regulated by ppGpp. J Bacteriol 1993, 175:7982-7989.
32. Lange R, Fischer D, Hengge-Aronis R: Identification of transcrip-
tional start sites and the role of ppGpp in the expression of
rpoS, the structural gene for the sigma S subunit of RNA
polymerase in Escherichia coli. J Bacteriol 1995, 177:4676-4680.
33. Eymann C, Hecker M: Induction of sigma(B)-dependent general
stress genes by amino acid starvation in a spo0H mutant of
Bacillus subtilis. FEMS Microbiol Lett 2001, 199:221-227.
34. Zhang S, Haldenwang WG: RelA is a component of the nutri-
tional stress activation pathway of the Bacillus subtilis tran-
scription factor Sigma B. J Bacteriol 2003, 185:5714-5721.
35. Kim DW, Chater KF, Lee KJ, Hesketh A: Effects of growth phase
and the developmentally significant bldA-specified tRNA on
the membrane-associated proteome of Streptomyces
coelicolor. Microbiology 2005, 151:2707-2720.
36. Horinouchi S, Malpartida F, Hopwood DA, Beppu T: afsB stimu-
lates transcription of the actinorhodin biosynthetic pathway
in Streptomyces coelicolor A3(2) and Streptomyces lividans.
Mol Gen Genet 1989, 215:355-357.
37. Floriano B, Bibb M: afsR is a pleiotropic but conditionally
required regulatory gene for antibiotic production in Strep-
tomyces coelicolor A3(2). Mol Microbiol 1996, 21:385-396.
38. Vogtli M, Chang PC, Cohen SN: afsR2 : a previously undetected
R161.18 Genome Biology 2007, Volume 8, Issue 8, Article R161 Hesketh et al. />Genome Biology 2007, 8:R161
gene encoding a 63-amino-acid protein that stimulates anti-
biotic production in Streptomyces lividans. Mol Microbiol 1994,
14:643-653.
39. Matsumoto A, Ishizuka H, Beppu T, Horinouchi S: Involvement of
a small ORF downstream of the afsR gene in the regulation
of secondary metabolism in Streptomyces coelicolor A3(2).
Actinomycetologica 1995, 9:37-43.
40. Takano E, Chakraburtty R, Nihira T, Yamada Y, Bibb MJ: A complex
role for the gamma-butyrolactone SCB1 in regulating
antibiotic production in Streptomyces coelicolor A3(2). Mol
Microbiol 2001, 41:1015-1028.
41. Uguru GC, Stephens KE, Stead JA, Towle JE, Baumberg S, McDowall
KJ: Transcriptional activation of the pathway-specific regula-
tor of the actinorhodin biosynthetic genes in Streptomyces
coelicolor. Mol Microbiol 2005, 58:131-150.
42. Takano E, Kinoshita H, Mersinias V, Bucca G, Hotchkiss G, Nihira T,
Smith CP, Bibb M, Wohlleben W, Chater K: A bacterial hormone
(the SCB1) directly controls the expression of a pathway-
specific regulatory gene in the cryptic type I polyketide bio-
synthetic gene cluster of Streptomyces coelicolor. Mol Microbiol
2005, 56:465-479.
43. Poralla K, Muth G, Hartner T: Hopanoids are formed during
transition from substrate to aerial hyphae in Streptomyces
coelicolor A3(2). FEMS Microbiol Lett 2000, 189:93-95.
44. Makarova KS, Ponomarev VA, Koonin EV: Two C or not two C:
recurrent disruption of Zn-ribbons, gene duplication, line-
age-specific gene loss, and horizontal gene transfer in evolu-
tion of bacterial ribosomal proteins. Genome Biol 2001,
2:RESEARCH0033.
45. Panina EM, Miranov AA, Gelfand MS: Comparative genomics of
bacterial zinc regulons: enhanced ion transport, pathogene-
sis and rearrangement of ribosomal proteins. Proc Natl Acad Sci
USA 2003, 100:9912-9917.
46. Moore CM, Helmann JD: Metal ion homeostasis in Bacillus
subtilis. Curr Opin Microbiol 2005, 8:188-195.
47. Natori Y, Nanamiya H, Akanuma G, Kosono S, Kudo T, Ochi K,
Kawamura F: A fail-safe system for the ribosome under zinc-
limiting conditions in Bacillus subtilis. Mol Microbiol 2007,
63:294-307.
48. Owen GA, Pascoe B, Kallifidas D, Paget MSB: Zinc-responsive reg-
ulation of alternative ribosomal protein genes in Streptomy-
ces coelicolor involves Zur and σR. J Bacteriol 2007,
189:4078-4086.
49. Shin J-H, Oh S-Y, Kim S-J, Roe J-H: The zinc-responsive regulator
Zur controls a zinc uptake system and some ribosomal pro-
teins in Streptomyces coelicolor A3(2). J Bacteriol 2007,
189:4070-4077.
50. Kodani S, Hudson ME, Durrant MC, Buttner MJ, Nodwell JR, Willey
JM: The SapB morphogen is a lantibiotic-like peptide derived
from the product of the developmental gene ramS in Strep-
tomyces coelicolor. Proc Natl Acad Sci USA 2004, 101:11448-11453.
51. San Paolo S, Huang J, Cohen SN, Thompson CJ: rag genes: novel
components of the RamR regulon that trigger morphologi-
cal differentiation in Streptomyces coelicolor. Mol Microbiol
2006, 61:1167-1186.
52. Uhnmee P, Suh JW, Hong SK: Genetic analysis of absR a new
locus of Streptomyces coelicolor. J Microbiol Biotechnol 2000,
10:169-175.
53. Horinouchi S: AfsR as an integrator of signals that are sensed
by multiple serine/threonine kinases in Streptomyces coeli-
color A3(2). J Ind Microbiol Biotechnol 2003, 30:462-467.
54. Nishida T, Orikasa Y, Watanabe K, Okuyama H: The cell-mem-
brane shielding function of eicosapentaenoic acid for
Escherechia coli against exogenously added hydrogen
peroxide. FEBS Lett 2006, 580:6690-6694.
55. van Keulen G, Hopwood DA, Dijkhuizen L, Sawers RG: Gas vesicles
in actinomycetes: old buoys in novel habitats? Trends Microbiol
2005, 13:350-354.
56. Schneider D, Bruton CJ, Chater KF: Duplicated gene clusters sug-
gest an interplay of glycogen and trehalose metabolism dur-
ing sequential stages of aerial mycelium development in
Streptomyces coelicolor A3(2). Mol Gen Genet 2000, 263:543-553.
57. Yeo M, Chater K: The interplay of glycogen metabolism and
differentiation provides an insight into the developmental
biology of Streptomyces coelicolor. Microbiology 2005,
151:855-861.
58. Widdick DA, Dilks K, Chandra G, Bottrill A, Naldrett M, Pohlschro-
der M, Palmer T: The twin-arginine translocation pathway is a
major route of protein export in Streptomyces coelicolor. Proc
Natl Acad Sci USA 2006, 103:17927-17932.
59. Kendall K, Cullum J: Cloning and expression of an extracellular-
agarase from Streptomyces coelicolor A3(2) in Streptomyces
lividans 66. Gene 1984, 29:315-321.
60. Tanaka K, Shiina T, Takahashi H: Nucleotide sequence of genes
hrdA, hrdC, and hrdD from Streptomyces coelicolor A3(2) hav-
ing similarity to rpoD genes. Mol Gen Genet 1991,
229:334-340.
61. Gehring AM, Yoo NJ, Losick R: RNA polymerase sigma factor
that blocks morphological differentiation by Streptomyces
coelicolor. J Bacteriol 2001, 183:5991-5996.
62. Paget MS, Molle V, Cohen G, Aharonowitz Y, Buttner MJ: Defining
the disulphide stress response in Streptomyces coelicolor
A3(2):identification of the sigmaR regulon. Mol Microbiol 2001,
42:1007-1020.
63. Newell KV, Thomas DP, Brekasis D, Paget MS: The RNA polymer-
ase-binding protein RbpA confers basal levels of rifampicin
resistance on Streptomyces coelicolor. Mol Microbiol 2006,
60:687-696.
64. Bremer H, Dennis P: Modulation of chemical composition and
other parameters of the cell by growth rate. In Escherichia coli
and Salmonella typhimurium Edited by: Neidhardt F. Washington DC:
American Society for Microbiology Press; 1996:1553.
65. Cabrera JE, Jin DJ: The distribution of RNA polymerase in
Escherichia coli is dynamic and sensitive to environmental
cues. Mol Microbiol 2003, 50:1493-1505.
66. Cabrera JE, Jin DJ: Active transcription of rRNA operons is a
driving force for the distribution of RNA polymerase in bac-
teria: effect of extrachromosomal copies of rrnB on the in
vivo localization of RNA polymerase. J Bacteriol 2006,
188:4007-4014.
67. Jin DE, Cabrera JE: Coupling the distribution of RNA polymer-
ase to global gene regulation and the dynamic structure of
the bacterial nucleoid in Escherichia coli. J Struct Biol 2006,
156:284-291.
68. Kieser T, Bibb MJ, Buttner MJ, Chater KF, Hopwood DA: Practical
Streptomyces Genetics Norwich: John Innes Foundation; 2000.
69. Affymetrix []
70. Irizarry RA, Bolstad BM, Collin F, Cope LM, Hobbs B, Speed TP:
Summaries of Affymetrix GeneChip probe level data. Nucleic
Acids Res 2003, 31:e15.
71. The R Project for Statistical Computing
[http://www.R-
project.org]
72. ArrayExpress [ />73. KEGG: Kyoto Encyclopedia of Genes and Genomes [http://
www.genome.jp/kegg/]
74. Multiple Em for Motif Elicitation [ />75. Rosen S, Skaletsky HJ: Primer3 on the WWW for general users
and for biologist programmers. In Bioinformatics Methods and Pro-
tocols: Methods in Molecular Biology Edited by: Krawetz S, Misener S.
Totowa, NJ: Humana Press; 2000:365-386.
76. Willey J, Santamaria R, Guijarro J, Geistlich M, Losick R: Extracellu-
lar complementation of a developmental mutation
implicates a small sporulation protein in aerial mycelium
formation by S. coelicolor. Cell 1991, 65:641-650.