Báo cáo y học: "Rooting the eutherian tree: the power and pitfalls of phylogenomics" potx
Bạn đang xem bản rút gọn của tài liệu. Xem và tải ngay bản đầy đủ của tài liệu tại đây (337.51 KB, 10 trang )
Genome Biology 2007, 8:R199
comment reviews reports deposited research refereed research interactions information
Open Access
2007Nishiharaet al.Volume 8, Issue 9, Article R199
Research
Rooting the eutherian tree: the power and pitfalls of phylogenomics
Hidenori Nishihara
*†
, Norihiro Okada
*
and Masami Hasegawa
†‡
Addresses:
*
Graduate School of Bioscience and Biotechnology, Tokyo Institute of Technology, 4259-B-21 Nagatsuta-cho, Midori-ku, Yokohama
226-8501, Japan.
†
Department of Statistical Modeling, Institute of Statistical Mathematics, 4-6-7 Minami-Azabu, Minato-ku, Tokyo 106-8569,
Japan.
‡
School of Life Sciences, Fudan University, Handan Road 220#, Shanghai 200433, China.
Correspondence: Norihiro Okada. Email:
© 2007 Nishihara et al.; licensee BioMed Central Ltd.
This is an open access article distributed under the terms of the Creative Commons Attribution License ( which
permits unrestricted use, distribution, and reproduction in any medium, provided the original work is properly cited.
Pitfalls of phylogenomics<p>In an attempt to root the eutherian tree using genome-scale data with the maximum likelihood method, a concatenate analysis supports a putatively wrong tree, whereas separate analyses of different genes reduced the bias.</p>
Abstract
Background: Ongoing genome sequencing projects have led to a phylogenetic approach based on
genome-scale data (phylogenomics), which is beginning to shed light on longstanding unresolved
phylogenetic issues. The use of large datasets in phylogenomic analysis results in a global increase
in resolution due to a decrease in sampling error. However, a fully resolved tree can still be wrong
if the phylogenetic inference is biased.
Results: Here, in an attempt to root the eutherian tree using genome-scale data with the
maximum likelihood method, we demonstrate a case in which a concatenate analysis strongly
supports a putatively wrong tree, whereas the total evaluation of separate analyses of different
genes grossly reduced the bias of the phylogenetic inference. A conventional method of
concatenate analysis of nucleotide sequences from our dataset, which includes a more than 1
megabase alignment of 2,789 nuclear genes, suggests a misled monophyly of Afrotheria (for
example, elephant) and Xenarthra (for example, armadillo) with 100% bootstrap probability.
However, this tree is not supported by our 'separate method', which takes into account the
different tempos and modes of evolution among genes, and instead the basal Afrotheria tree is
favored.
Conclusion: Our analysis demonstrates that in cases in which there is great variation in
evolutionary features among different genes, the separate model, rather than the concatenate
model, should be used for phylogenetic inference, especially in genome-scale data.
Background
In the post-genomic era, genome-scale approaches to phylo-
genetic inference (phylogenomics) are being applied exten-
sively to overcome the large sampling errors inherent in
commonly used approaches based on a single or a small
number of genes [1-3]. Sampling error diminishes as the
number of genes provided for the analysis increases, but the
fully resolved tree can still be wrong if the phylogenetic infer-
ence is biased (systematic error), and several such cases have
been reported [4-11]. To estimate a reliable tree from large
genomic datasets, it is imperative to establish how best to
overcome such an error. Currently, genome projects of vari-
ous mammalian species are ongoing at a rapid pace, and their
genome-scale sequence data are now available. Therefore, an
analysis of mammalian phylogeny based on such datasets is
Published: 21 September 2007
Genome Biology 2007, 8:R199 (doi:10.1186/gb-2007-8-9-r199)
Received: 15 December 2006
Revised: 2 July 2007
Accepted: 21 September 2007
The electronic version of this article is the complete one and can be
found online at />R199.2 Genome Biology 2007, Volume 8, Issue 9, Article R199 Nishihara et al. />Genome Biology 2007, 8:R199
expected to be useful in evaluating problems that are inherent
to phylogenomics.
Mammalian phylogenetics has developed rapidly during the
past decade, and most of the higher order relationships have
been resolved [12-16]. All eutherian (placental) mammals can
be classified into 18 orders, which are grouped into the three
higher groups: Afrotheria (for example, elephants, sirenians,
hyraxes, and so on, which originated in Africa), Xenarthra
(for example, armadillos, sloths, and anteaters, which origi-
nated in South America), and Boreotheria (all other euthe-
rians, comprising 11 orders that originated in Laurasia of the
Northern hemisphere). Phylogenetic relationships have been
analyzed primarily using sequences of several nuclear or
mitochondrial genes. However, the root of the eutherian tree
remains unclear. Even extensive phylogenetic analyses based
on several gene sequences failed to resolve the relationship
among the three groups [17-21]. On the other hand, two ret-
rotransposon inserted loci analyses have supported the basal
Xenarthra hypothesis [15], whereas Murphy and coworkers
[22] identified two loci that support the monophyly of Xenar-
thra and Afrotheria. However, the small number of loci does
not provide conclusive evidence to resolve the relationship
because of a possible ascertainment bias. The monophyly of
Xenarthra + Afrotheria might be considered a reasonable
hypothesis from a biogeographic point of view [17], because
the South American and African continents - where Xenar-
thra and Afrotheria, respectively, originated - constituted the
supercontinent Gondwana until about 105 million years ago
[23]. Indeed, the early split of eutherians is estimated to be
about 100 million years ago [24], which is consistent with the
biogeographic viewpoint. Thus, rooting the eutherian tree is
important not only to clarify the origin of eutherians but also
to elucidate the correlation between long-term continental
drift and mammalian migration and diversification.
Although genome-scale approaches have become popular
during the past few years, at most only a few hundreds of
genes (a few hundred kilobases for each species) have thus far
been used for phylogenetic inference [1,3,4,8]. In the present
study we collected 2,789 genes from ten mammalian genomic
sequences by screening whole-genome data, providing 1 meg-
abase (Mb) of sequence data for each species, and performed
an extensive maximum likelihood (ML) analysis to determine
the root of the eutherian tree.
Results and discussion
Megabase data collection to analyze the root of
eutherian tree
Whole-genome shotgun data from several mammalian spe-
cies are now available. In this study, we used about 2 giga-
bases of sequence data for each of the nine-banded armadillo
(Dasypus novemcinctus) in Xenarthra and the African ele-
phant (Loxodonta africana) in Afrotheria. We obtained the
armadillo and elephant homologs to the human exons. Subse-
quently, we extracted the relevant orthologs from a whole-
genome alignment of human with chimpanzee, rhesus
macaque, mouse, rat, dog, cow, or opossum, and finally we
constructed a 1,011,870 base pair (bp; 337,290 amino acids)
sequence dataset containing 2,789 genes for each species. In
our analysis, three possible trees among Afrotheria, Xenar-
thra, and Boreotheria were examined: tree 1 was basal Afroth-
eria, tree 2 was basal Xenarthra, and tree 3 was basal
Boreotheria, or Afrotheria/Xenarthra clade (Figure 1). The
branching orders within Boreotheria were fixed, as shown in
Figure 1, because previous studies have resolved them une-
quivocally [12-16]. Additionally, we confirmed the validity of
the phylogenetic relationships within Boreotheria using our
dataset (see Additional data file 1 [Supplementary Text and
Table S1]).
Incongruent maximum likelihood tree provided by
concatenate analyses
We mainly used the ML method because maximum parsi-
mony and neighbor-joining analyses led to an apparently arti-
ficial tree with rodents at the basal position among
eutherians, probably because of the long-branch attraction
(see Additional data file 1 [Supplementary Text and Figure
S1]). In contrast, the ML analyses supported the Boreotheria
monophyly robustly. The concatenated dataset of the 2,789
gene sequences was analyzed at the nucleotide level with the
GTR (General Time Reversible) + Γ
8
and codon substitution
[25] with Γ
4
models, and at the amino acid level with the JTT-
F (Jones-Tayor-Thornton (with the F-option)) + Γ
8
model
using the PAML version 3.15 [26] by fixing the relationships
within Boreotheria, as shown in Figure 1.
Interestingly, quite different results were generated depend-
ing on the method. Phylogenetic analysis of the concatenated
nucleotide sequence, which is a commonly used method in
mammalian phylogenetics, supported tree 3 (the Afrotheria/
Xenarthra clade) with extremely high significance (Table 1).
The other two hypotheses (basal Afrotheria and basal Xenar-
thra) were strongly rejected (0.0% bootstrap probability [BP],
P < 0.001 by the conservative weighted test of Shimodaira
and Hasegawa [wSH]) [27]. Even though three codon posi-
tions were separately analyzed, each position consistently
supported tree 3 as far as different genes were concatenated
(Additional data file 1 [Table S2]). If we had concluded our
analysis with these conventional methods, then tree 3 would
have appeared to reflect an apparently true evolutionary his-
tory. With the codon substitution model, however, tree 3 was
rejected (0.6% BP, P = 0.026 wSH) and tree 1 was the ML tree
instead. By amino acid analysis, tree 2 was rejected (0.2%
BP), and the other two hypotheses were nearly equally likely.
Thus, our large concatenated dataset, comprising 2,789 genes
(about 1 Mb), was very sensitive to the assumed model in
rooting the eutherian tree.
Genome Biology 2007, Volume 8, Issue 9, Article R199 Nishihara et al. R199.3
comment reviews reports refereed researchdeposited research interactions information
Genome Biology 2007, 8:R199
ML analysis using the separate method
Because our dataset was composed of a large number of
genes, variations in the tempos and modes of evolution
among genes were expected to be very large. Therefore, we
next carried out ML analyses with the separate model, which
takes account of this variety by assigning different parameters
to different genes [28]. Interestingly, the nucleotide, amino
acid, and codon substitution models all consistently sup-
ported tree 1 (Table 1). The separate model was superior to
the concatenate model based on the Akaike Information Cri-
terion (AIC) [29], except for the codon substitution model, in
which separation into 2,789 genes might have introduced too
many parameters.
We next categorized the 2,789 genes into several groups (5,
10, 56, 100, 200, 558, 930, 1,395, or 2,789 categories) accord-
ing to their evolutionary rates, and performed the separate
analyses, in which different parameters were assigned to each
category. For this categorization, we assessed the evolution-
ary rate for each of the 2,789 genes from the total branch
length (TBL) estimated by the ML analysis of the gene.
Because the AIC tends to favor complex model (with high
number of parameters), we also applied the second order cor-
rection of AIC (AICc) in this study. The AICc is recommended
when the number of characters or sites (#s) is small com-
pared to that of parameters (#p; in the case #s/#p < 40)
[30,31]. We compared the log-likelihood and AIC (or AICc)
among the results to find better model for the dataset (Table
2). At nucleotide level, separation into each of the 2,789 genes
exhibited the smallest AICc, supporting tree 1 with a BP of
86% (basal-Afrotheria hypothesis). In the codon substitution
model, separation into 100 categories supported tree 1 (BP =
94%) with the smallest AIC. At amino acid level, tree 1 was the
ML tree with separation into 56 categories, although the sup-
port for tree 3 is comparable to that for Tree 1. Accordingly,
all of the separate analyses among gene categories with the
smallest AIC or AICc favored tree 1 (see bold type in Table 2).
Removal of fast-evolving gene data
Because fast evolutionary rates are often associated with mis-
leading effects, such as long-branch attraction [8,32], compo-
sitional bias, and heterotachy [3], we successively constructed
datasets by removing the 50 most rapidly evolving genes at a
time [8,32] (in terms of the TBL), finally producing 56 data-
sets. For each dataset, we first performed a concatenate anal-
ysis and monitored the shift in BP for each of the three trees.
As expected, robust support (100% BP) for tree 3 showed a
sharp decline to 0% BP by nucleotide analysis as the number
of genes was reduced. In contrast, BPs for both trees 1 and 2,
but particularly tree 1, increased (Figure 2a). In addition, the
ambiguous support for trees 1 and 3 by the amino acid analy-
sis shifted to reject tree 3 and stably support tree 1 (Figure 2c).
Only for the concatenate analysis at codon level, we removed
100 genes at a time to produce 28 datasets (Figure 2b), and
tree 3 was not supported with any dataset. These support lev-
els became ambiguous when the majority of the genes were
removed (> 2,600), but this was probably due to the
extremely small number of remaining phylogenetically
informative sites included in the slowly evolving genes.
Additionally, for each of the 56 datasets, we used the separate
method so that a category includes 50 genes, and monitored
the BPs as well. The shift of BPs for each tree was very similar
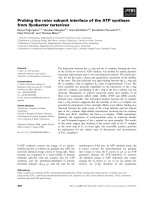
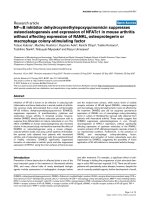
Three phylogenetic hypotheses for the root of theeutherian treeFigure 1
Three phylogenetic hypotheses for the root of theeutherian tree. (a) Tree
1: basal Afrotheria. (b) Tree 2: basal Xenarthra. (c) Tree 3: basal
Boreotheria, or Afrotheria/Xenarthra clade. The phylogenetic
relationships within Boreotheria (cow, dog, mouse, rat, human,
chimpanzee, and macaque) are fixed in this study.
Tree 3
Tree 2
Cow
Dog
Mouse
Human
Rat
Chimp
Macaque
Armadillo
Elephant
Opossum
Boreother
ia
Xenarthra
Afrotheria
Dog
Mouse
Human
Rat
Chimp
Macaque
Elephant
Armadillo
Opossum
Boreother
ia
Afrotheria
Xenarthra
Cow
Cow
Dog
Mouse
Human
Rat
Chimp
Armadillo
Elephant
Opossum
Boreother
ia
Xenarthra
Afrotheria
Tree 1
(a)
(
b)
(
c)
Macaque
R199.4 Genome Biology 2007, Volume 8, Issue 9, Article R199 Nishihara et al. />Genome Biology 2007, 8:R199
to those of concatenate analysis with any model (Figure 2d-f).
In the amino acid analysis, the separate analysis for this cate-
gorization (50 genes per category), using all of the 2,789
genes, showed ambiguous support for tree 1 and 3 with the
smallest AIC, but removal of rapidly evolving genes was asso-
ciated with decline in support for tree 3 (Figure 2f).
Furthermore, we conducted the separate analysis with sepa-
ration into each gene along with the nucleotide, amino acid,
and codon substitution models for each of the 56 datasets
(Figure 2g-i). Note that the separate analysis among each
gene showed the smallest AICc in the nucleotide analysis
(Table 2). In this analysis, tree 3 was not supported in any
model.
Therefore, our large dataset exhibit serious incongruence
among models; tree 3 is strongly supported (100% BP) by a
conventional method with a concatenate model of nucleotide
analysis, whereas the separate model among each gene with
the smallest AICc supported tree 1. Overall, tree 1 (basal
Afrotheria) appeared to be the most likely tree by comparing
BPs (Figure 2 and Table 1), but the alternative hypotheses
cannot be dismissed. Hallstrom and coworkers [33] recently
analyzed a dataset of 2,840 genes (> 2 Mb) with the concate-
nate model to resolve the root of the eutherian tree, and con-
cluded that the most likely tree supports the monophyly of
Xenarthra and Afrotheria (tree 3 in the present study). Based
on our results, however, we believe that further analysis of
their dataset with the separate model is necessary to take het-
erogeneity among the genes into account.
Possible cause of the misled tree
There are several factors that can lead to an incorrect tree,
even with use of genome-scale data: nucleotide or amino acid
compositional bias [1,5,9]; long-branch attraction caused by
unequal evolutionary rates among lineages [2,7,8,34]; sparse
taxon sampling [2,4,8]; and heterotachy (the shift of position
specific evolutionary rates) [8,32,35-39]. If the long branch
attraction artifact was operating, then large differences
among the relevant branch lengths would have been seen in
the tree. In the tree 3 analyzed with concatenate GTR + Γ
8
model (Additional data file 1 [Figure S2]), large differences in
branch lengths are observed only in the rodents (mouse/rat)
and cow lineages, which are within densely sampled Boreoth-
eria. Concerning the compositional bias, significant
differences are remarkable also in rodents and cow among
eutherians (Additional data file 1 [Table S3]).
To examine whether the misled support for tree 3 resulted
from the long branch attraction or compositional biases of the
rodents and cow sequences, we performed a concatenate
analysis with GTR + Γ
8
model excluding the rodents (mouse
Table 1
Comparison of the log-likelihood for the three hypotheses with each model
Concatenate or separate model Substitution model Tree < ln L > (Δ ln L ± SE)KH wSHBP #p AIC
Concatenate model GTR + Γ
8
1 -117.2 ± 31.1 0.000 0.000 0.0
2 -147.3 ± 29.7 0.000 0.000 0.0
3 < -4,076,316.3 > 100.0 26 8,152,684.6
Codon + Γ
4
1 < -3,828,351.7 > 88.1 81 7,656,865.4
2 -77.8 ± 64.5 0.112 0.185 11.3
3 -142.7 ± 65.0 0.014 0.026 0.6
JTT-F + Γ
8
1 < -1,905,933.9 > 51.6 37 3,811,941.8
2 -84.1 ± 37.4 0.014 0.028 0.2
3 -1.7 ± 41.9 0.478 0.637 48.2
Separate model (among 2,789 genes) GTR + Γ
8
1 < -3,963,489.9 > 86.2 72,514 8,072,007.8
2 -117.4 ± 72.3 0.050 0.092 4.1
3 -91.4 ± 72.7 0.104 0.174 9.7
Codon + Γ
4
1 < -3,621,322.1 > 89.6 225,909 7,694,462.2
2 -128.0 ± 103.2 0.107 0.164 10.4
3 -527.9 ± 96.3 0.000 0.000 0.0
JTT-F + Γ
8
1 < -1,799,245.4 > 93.4 103,193 3,804,876.8
2 -134.9 ± 88.5 0.064 0.112 6.6
3 -317.6 ± 85.5 0 0.000 0.0
Maximum likelihood (ML) trees varied depending on the substitution model used for the concatenate analysis, whereas the separate model analyses
consistently supported tree 1. The log-likelihood of the ML tree is given in angled brackets, and the differences in the log-likelihoods of alternative
trees from that of the ML tree ± 1 standard error were estimated using the formula of Kishino and Hasegawa [28]. Numbering of the trees
corresponds to that shown in Figure 1. KH and wSH denote P values derived using by the test of Kishino and Hasegawa [28] and the weighted test
of Shimodaira and Hasegawa [27], respectively, calculated by the CONSEL program [47]. AIC, the Akaike Information Criterion [29]; #p, number of
parameters of the model.
Genome Biology 2007, Volume 8, Issue 9, Article R199 Nishihara et al. R199.5
comment reviews reports refereed researchdeposited research interactions information
Genome Biology 2007, 8:R199
and rat) and/or cow data. If the rodents and cow data pro-
vided such misleading effects as in our concatenate analysis
shown in Table 1 and 2, then support for tree 3 should be
reduced when we remove these sequences. Contrary to this
expectation, however, tree 3 was still supported robustly
(100% BP; Additional data file 1 [Table S4]). Therefore, we
conclude that either the long branch attraction or the compo-
sition bias did not cause the misled support for tree 3. Fur-
thermore, if they had actually caused the problem, it is not
expected that the separate model could drastically improve
the situation, as demonstrated in this work. We therefore
expect that the heterogeneity among genes caused the
problem.
If the inclusion of paralogous genes is causing the problem in
our case, then it is expected that tree 3 supporting genes will
tend to contain more paralogous comparisons, and accord-
ingly their TBLs tend to be longer than average. We therefore
investigated the distribution of TBLs of 848 genes that prefer
tree 3, and compared the distribution with that of all 2,789
genes (Additional data file 1 [Figure S3]). The TBL was calcu-
lated using PAML 3.15 [26], with GTR + Γ
8
model for each
gene. However, no sign of more paralogs in the tree 3 sup-
porting genes than others was observed (Additional data file
1 [Figure S3]). Therefore, the specific cause of the misled sup-
port for tree 3 remains unclear.
Table 2
Comparison of BPs among trees 1 to 3 analyzed with concatenate and separate models
Model #c Ln L #p #s #s/#p AIC AICc Tree 1 Tree 2 Tree 3
Nucleotide (GTR + Γ
8
) 1 -4,076,316.3 26 1,011,870 38,918.1 8,152,684.6 8,152,684.6 0.0 0.0 100.0
5 -4,059,904.9 130 1,011,870 7,783.6 8,120,069.8 8,120,069.8 0.0 0.0 100.0
10 -4,058,547.6 260 1,011,870 3,891.8 8,117,615.2 8,117,615.3 0.0 0.0 100.0
56 -4,055,469.5 1,456 1,011,870 695.0 8,113,851.0 8,113,855.2 0.1 0.0 99.9
100 -4,053,634.1 2,600 1,011,870 389.2 8,112,468.2 8,112,481.6 0.1 0.0 99.9
200 -4,049,237.9 5,200 1,011,870 194.6 8,108,875.8 8,108,929.5 0.2 0.0 99.8
558 -4,035,535.0 14,508 1,011,870 69.7 8,100,086.0 8,100,508.1 1.7 0.0 98.3
930 -4,022,303.0 24,180 1,011,870 41.8 8,092,966.0 8,094,150.0 3.6 0.0 96.4
1,395 -4,006,623.4 36,270 1,011,870 27.9 8,085,786.8 8,088,483.7 25.0 0.7 74.3
2,789 -3,963,489.9 72,514 1,011,870 14.0 8,072,007.8 8,083,203.5 86.2 4.1 9.7
Codon (+ Γ
4
) 1 -3,828,351.7 81 337,290 4,164.1 7,656,865.4 7,656,865.4 88.1 11.3 0.6
5 -3,810,589.3 405 337,290 832.8 7,621,988.6 7,621,989.6 94.3 5.1 0.7
10 -3,808,198.7 810 337,290 416.4 7,618,017.4 7,618,021.3 93.3 5.9 0.8
56 -3,802,941.9 4,536 337,290 74.4 7,614,955.8 7,615,079.5 93.0 5.2 1.7
100 -3,799,324.6 8,100 337,290 41.6 7,614,849.2 7,615,247.9 94.0 4.9 1.1
200 -3,791,928.7 16,200 337,290 20.8 7,616,257.4 7,617,892.2 91.0 8.1 1.0
558 -3,766,336.0 45,198 337,290 7.5 7,623,068.0 7,637,056.1 96.7 2.9 0.3
930 -3,741,173.9 75,330 337,290 4.5 7,633,007.8 7,676,332.8 98.0 1.7 0.3
1,395 -3,712,084.5 112,995 337,290 3.0 7,650,159.0 7,764,009.4 96.2 3.8 0.0
2,789 -3,621,322.1 225,909 337,290 1.5 7,694,462.2 8,610,876.3 89.6 10.4 0.0
Amino acid (JTT-F + Γ
8
) 1 -1,905,933.9 37 337,290 9,115.9 3,811,941.8 3,811,941.8 51.6 0.2 48.2
5 -1,879,320.4 185 337,290 1,823.2 3,759,010.8 3,759,011.0 63.4 0.2 36.5
10 -1,877,405.7 370 337,290 911.6 3,755,551.4 3,755,552.2 63.9 0.3 35.9
56 -1,875,094.5 2,072 337,290 162.8 3,754,333.0 3,754,358.6 56.6 0.1 43.2
100 -1,873,607.4 3,700 337,290 91.2 3,754,614.8 3,754,696.9 58.7 0.5 40.9
200 -1,870,213.5 7,400 337,290 45.6 3,755,227.0 3,755,559.0 59.8 0.2 40.1
558 -1,858,842.6 20,646 337,290 16.3 3,758,977.2 3,761,669.7 81.2 1.1 17.7
930 -1,847,528.8 34,410 337,290 9.8 3,763,877.6 3,771,696.4 81.6 6.5 11.9
1,395 -1,834,624.0 51,615 337,290 6.5 3,772,478.0 3,791,129.7 87.1 10.9 2.0
2,789 -1,799,245.4 103,193 337,290 3.3 3,804,876.8 3,895,855.7 93.4 6.6 0.0
Maximum likelihood (ML) analyses with nucleotide, codon, and amino acid substitution models and comparison of bootstrap probabilities (BPs)
among trees 1 to 3. Concatenate (#c = 1) and separate analyses were performed for each dataset. The #c, #p, and #s represent the number of
categories separated according to the total branch length of the 2,789 genes, the number of parameters, and the number of characters (or sites),
respectively. AIC is the Akaike Information Criterion, and AICc is the AIC with second order correction. AIC with #s/#p > 40 and AICc with #s/#p
< 40 are shown in italics. The best models based on AIC or AICc are shown in bold.
R199.6 Genome Biology 2007, Volume 8, Issue 9, Article R199 Nishihara et al. />Genome Biology 2007, 8:R199
The number of genes that can be used for phylogenetic analy-
sis becomes large when genome-scale data are used. We
showed here an extreme case in which an analysis of a large
concatenated dataset of genes yields different results depend-
ing on the substitution model used. In our analysis, the
differing results were not due to long branch attraction and
compositional bias, but probably to large variation in tempos
and modes of evolution among genes. This serious pitfall is
more difficult to detect than long branch attraction or compo-
sitional bias. Furthermore, we demonstrated that this hidden
but probably common problem can be overcome using the
separate model. Therefore, given that increasing the
sequence length certainly reduces sampling error and that
large amounts of data are very powerful in phylogenetic anal-
yses, it must be noted that a simple concatenated dataset car-
ries with it the possibility of a seriously misleading artifact. To
estimate a true phylogenetic relationship, it is necessary to
give close attention to the data analysis and to improve the
method by explicitly taking into account variation in tempo
and mode of evolution among different genes.
Root of the eutherian tree
Rooting the eutherian tree is important in order to clarify
when and where early eutherians evolved in association with
ancient large-scale continental drift. With the best available
models (the separate and concatenated codon substitution +
Γ models), although tree 1 was preferred, we could not
completely exclude the alternative hypotheses. Given that
even the genome-scale sequence analyses with the best avail-
able model could not provide a definitive conclusion, as dem-
onstrated in this paper, it is important to increase the species
sampling and the number of genes in the phylogenetic analy-
ses of sequence data with improved models of molecular evo-
lution. Recently, it was demonstrated that extensive
phylogenetic analysis with increased taxon sampling tends to
prefer the concatenate model over the separate one based on
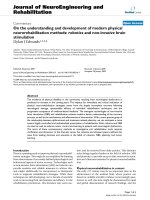
BPs of the three trees for the datasets constructed by successively removing the 50 most rapidly evolving genesFigure 2
BPs of the three trees for the datasets constructed by successively removing the 50 most rapidly evolving genes. The horizontal axis shows the number of
genes removed from the whole dataset of 2,789 genes. The dataset was analyzed using the (a) concatenate model; the (b) separate model, in which a
category contains 50 genes grouped according to their total branch length; and (c) the separate model, in which different parameters were provided to
each gene. Each analysis was performed using nucleotide (GTR + Γ
8
; the left-most column of panels), codon (+ Γ
4
; the middle column of panels), and
amino acid (JTT + Γ
8
; the right-most column of panels) substitution models.
0
10
20
30
40
50
60
70
80
90
100
0
200
400
600
800
1
,0
00
1,
2
00
1,
4
00
1
,6
00
1
,8
00
2
,0
00
2
,2
00
2
,4
00
2
,6
00
0
10
20
30
40
50
60
70
80
90
100
0
2
00
4
00
6
00
80
0
1,0
00
1,2
00
1
,4
00
1,6
00
1,80
0
2,0
00
2,2
00
2,4
00
2,6
00
0
10
20
30
40
50
60
70
80
90
100
0
2
00
4
00
6
00
8
00
1,00
0
1,20
0
1,40
0
1,60
0
1,80
0
2,00
0
2,20
0
2,40
0
2,60
0
0
10
20
30
40
50
60
70
80
90
100
0
2
00
4
00
6
00
8
00
1,00
0
1,20
0
1,40
0
1,60
0
1,80
0
2,00
0
2,20
0
2,40
0
2
,60
0
0
10
20
30
40
50
60
70
80
90
100
0
2
00
4
00
6
00
8
00
1,00
0
1,20
0
1,40
0
1,60
0
1,80
0
2,00
0
2,2
00
2,40
0
2,60
0
0
10
20
30
40
50
60
70
80
90
100
0
2
00
4
00
6
00
8
00
1,0
00
1,2
00
1,4
00
1,6
00
1,80
0
2,0
00
2,2
00
2,4
00
2,6
00
0
10
20
30
40
50
60
70
80
90
100
0
2
00
4
00
6
00
8
00
1,00
0
1
,20
0
1,40
0
1,60
0
1,80
0
2,00
0
2,20
0
2,40
0
2,60
0
0
10
20
30
40
50
60
70
80
90
100
0
2
00
4
00
6
00
8
00
1,00
0
1,20
0
1,40
0
1,60
0
1,8
00
2,00
0
2,20
0
2,4
00
2,60
0
0
10
20
30
40
50
60
70
80
90
100
0
2
00
4
00
6
00
8
00
1,00
0
1,20
0
1,40
0
1,60
0
1,80
0
2,00
0
2,20
0
2,40
0
2,60
0
(a)
Concatenate model
Nucleotide Codon Amino acid
(b) Separate model (50 genes per category)
Nucleotide Codon Amino acid
(c) Separate model (one gene per category)
Nucleotide Codon Amino acid
Genome Biology 2007, Volume 8, Issue 9, Article R199 Nishihara et al. R199.7
comment reviews reports refereed researchdeposited research interactions information
Genome Biology 2007, 8:R199
AICc in the case of plant phylogeny [40]. Therefore, because
dozens of mammalian genome sequencing projects are cur-
rently in progress, it may be possible that increased sampling
will allow the root of the eutherian tree to be resolved without
application of the completely separate model (among 2,789
genes). It is also important to apply more extensive and mul-
tilateral analyses such as retrotransposon insertion analysis
[15,16,22,41] in order to maximize the explosively developing
genomic data. In the near future, evolutionary history of
mammals and its association with ancient continental drift
will be resolved.
Conclusion
The availability of large genomic sequence datasets for vari-
ous mammals allows us to perform an extensive ML analysis
of the phylogenetic relationship among Boreotheria, Xenar-
thra, and Afrotheria, in order to determine the root of euthe-
rian tree based on 2,789 genes collected from ten mammalian
species. Although a conventional method of concatenate
analysis with a GTR + Γ model suggests the monophyly of
Afrotheria and Xenarthra with 100% BP, this tree is rejected
by ML analyses with the separate model, which takes into
account the different tempos and modes of evolution among
genes. We demonstrate that the separate model should be
used for phylogenetic inference in cases of large variation in
evolutionary features among different genes, such as for
genome-scale data.
Materials and methods
Collection of the gene dataset
A large sequence dataset was collected using the following
five steps: extraction of all exon sequences of greater than
200 bp from the human genome database; removal of dupli-
cated (paralog) sequences from the human data; search of the
armadillo and elephant genomic data for homologs of the
human exons; collection of the homologous exons from other
mammalian genomic data; and alignment of all of the
sequences and removal of ambiguous nucleotide sites. Details
for each step are shown below.
Step 1: extraction of all exon sequences of greater than 200 bp from
the human genome database
We obtained human whole-genomic sequence data (version
hg17) and an annotation data file (refFlat) for gene positions
from the University of California, Santa Cruz Genome Bioin-
formatics database [42]. Protein-coding exon sequences of
above 200 bp, identified from the annotation file, were used
because it is difficult to evaluate the homology of short exon
sequences by BLAST search.
Step 2: removal of duplicated (paralog) sequences from
the human data
To find and remove duplicated sequence data from the
human exon data, we performed a pair-wise homology search
among the exon sequences using the local Basic Local Align-
ment Search Tool (BLAST) program [43]. In this step, an
exon sequence was removed from the sequence collection if a
similar sequence, excepting the exon itself, was detected by
the search in the human sequence data. The criterion for the
similarity was set at an E-value of 1 × 10
-11
. Thus, each of the
resulting 50,527 exons was regarded as a single-copy
sequence in the human genome.
Step 3: search of the armadillo and elephant genomic
data for homologs of the human exons
We obtained whole-genome shotgun sequences of the nine-
banded armadillo (Dasypus novemcinctus) and the African
elephant (Loxodonta africana) from the DNA Data Bank of
Japan. We next performed a local BLAST search with a cut-off
of 1 × 10
-11
to obtain homologs of the human single-copy exon
sequences from the two species. To avoid comparing paralo-
gous exons, we removed the exon information from the col-
lection if multiple sequences were detected in either of the
two genomic datasets. However, failure to detect duplicated
sequences does not guarantee that only orthologous compar-
isons were made, both because whole-genome data were not
always available and because one of the duplicated genes in a
genome may have been lost during evolution. Next, the
regions shared among human, armadillo, and elephant were
extracted for each of the 7,068 exons obtained.
Step 4: collection of the homologous exons from other
mammalian genomic data
Whole-genome pair-wise alignment data of human versus
various animals are available in the University of California,
Santa Cruz Genome Bioinformatics database. The seven
mammalian species used for our data collection were chim-
panzee (Pan troglodytes; data ver. panTro1), rhesus macaque
(Macaca mulatta; rheMac1), mouse (Mus musculus; mm7),
rat (Rattus norvegicus; rn3), dog (Canis familiaris;
canFam2), cow (Bos Taurus; bosTau1), and opossum (Mono-
delphis domestica; monDom1). The orthologs of the human
exons were obtained from the seven species by referring to
the alignment data, and ten sequences that included
sequences from human, armadillo, and elephant were
obtained for each exon. To exclude possible pseudogenes
from the analysis, we removed from the dataset any exon for
which any of the species contained a stop codon in the middle
of the sequence. The remaining 4,782 exons were used for the
subsequent alignment and analysis.
Step 5: alignment of all of the sequences and removal of ambiguous
nucleotide sites
All of the exon sequences were concatenated for each species
to avoid the technical difficulty of alignment. We aligned the
sequences using the blastz [44] and multiz [45] programs.
Phylogenetic information can be taken into account in the
alignment program, and thus, with the exception of the three
hypotheses shown in Figure 1, we fixed the relationships of
the mammalian species analyzed as follows: ((((((human,
R199.8 Genome Biology 2007, Volume 8, Issue 9, Article R199 Nishihara et al. />Genome Biology 2007, 8:R199
chimpanzee), macaque), (mouse, rat)), (dog, cow)), arma-
dillo, elephant), opossum). Next, we divided the concatenated
sequences into each exon and removed codons in which inser-
tions and deletions were found for any species. When multi-
ple exons were parts of the same gene in our dataset, we
concatenated the exons and used the resulting concatenation
as one gene sequence, thereby obtaining 3,148 genes in total.
Because very short sequences of homologous exons were
detected in the BLAST search (step 3) for some genes, such
sequences (< 120 bp) were removed in the phylogenetic anal-
ysis that followed. We finally collected a 2,789 gene dataset
composed of 1,011,870 bp (337,290 codons) for each species.
Therefore, these gene sequences were different from the
actual gene sequences because of removal of exons and
codons that were ambiguous in the alignment. Our dataset is
suitable for phylogenetic analysis in terms of both quality
(exclusion of missing/ambiguous alignment codons, para-
logs, and pseudogenes) and the quantity (> 1 Mb per species).
Phylogenetic analysis with the ML method
ML analyses were carried out using Phylogenetic Analysis by
Maximum Likelihood (PAML) version 3.15 package [26] at
the nucleotide and amino acid levels with both the concate-
nate and separate models. The data were analyzed as nucle-
otide sequences with the GTR + Γ
8
model and the codon-
substitution + Γ
4
model, or as amino acid sequences with the
JTT-F + Γ
8
model. The rate parameters of the GTR model,
parameters of the codon substitution model, and the shape
parameter (α) of the Γ distribution were optimized. In the
concatenate analyses, the concatenated sequences (1,011,870
bp from 2,789 genes) were regarded as homogeneous,
whereas in the separate analyses the differences among the
gene categories or among the 2,789 genes were taken into
account by assigning different parameters (branch lengths
and other parameters of the substitution model, such as the
shape parameter of the Γ model) to different categories or to
different genes.
We performed the analyses by separating the 2,789 genes into
5, 10, 56, 100, 200, 558, 930, 1395, or 2789 (each gene) cate-
gories according to TBL estimated from ML analyses for each
gene. In the latter analyses, log-likelihood scores for respec-
tive genes were estimated with PAML and then the total log-
likelihood of the whole dataset was calculated with TotalML
program in the MOLPHY [46] package. The test of Kishino
and Hasegawa [28] and the wSH [27] were performed using
the CONSEL program [47]. BPs shown in Tables 1 and 2 and
in Additional data file 1 (Table S4) were calculated using the
resampling estimated log-likelihood method [48] with
10,000 replications. The AIC [29] and the AICc were applied
to evaluate the fitting of the model to the data.
Removal of rapidly evolving gene data
In our data, rapidly evolving genes might cause artificial
effects more extensively than slowly evolving genes [8], and
paralogous genes might still be included among seemingly
'rapidly evolving' genes. To evaluate the influence of such
genes, we constructed datasets by successively removing the
50 more rapidly evolving genes starting from the 2,789 gene
dataset, producing 56 concatenated datasets. In this proce-
dure, the evolutionary rate of each gene was evaluated from
the estimated total branch length of the ML tree. We applied
both the concatenate model and the separate model to each of
the 56 datasets. In the concatenate model, ML analyses with
the nucleotide (GTR + Γ
8
), amino acid (JTT-F + Γ
8
), and
codon (with Γ
4
) substitution models were performed, and
changes in relative BPs among the three hypotheses were
monitored, as shown in Figure 2. In the concatenate analysis
with the codon substitution model, we analyzed 28 datasets
produced by removing 100 fast-evolving genes at a time.
Because the number of replications for the BP calculation is
changed in the default setting of the PAML package [26]
depending on the length of the sequence analyzed, 500 and
10,000 replications were applied when 2,450 or fewer genes
were removed and more than 2,450 genes were removed,
respectively. We also used the nucleotide (GTR + Γ
8
), amino
acid (JTT-F + Γ
8
), and codon (with Γ
4
) substitution models in
the separate model analysis, in which different parameters
were provided to each category (a category includes 50 genes;
Figure 2d-f) or each gene (Figure 2g-i), and the total evidence
was evaluated with the TotalML program in the MOLPHY
package [46]. BPs in the separate model were calculated using
the resampling estimated log-likelihood method with 10,000
replications.
Abbreviations
AIC, Akaike Information Criterion; AICc, second order cor-
rection of AIC; BLAST, Basic Local Alignment Search Tool;
bp, base pair; BP, bootstrap probability; GTR, General Time
Reversible; JTT-F, Jones-Tayor-Thornton (with the F-
option); Mb, megabase; ML, maximum likelihood; TBL, total
branch length; wSH, weighted test of Shimodaira and
Hasegawa.
Authors' contributions
HN, NO and MH designed the study and wrote the paper. HN
collected the sequence data. HN and MH analyzed the data.
Additional data files
The following additional data are available with the online
version of this paper. Additional data file 1 includes additional
explanatory text and several additional tables and figures.
Additional data file 1Additional materialsProvided are additional explanatory text and several additional tables and figures.Click here for file
Acknowledgements
This work was supported by research grants from the Ministry of Educa-
tion, Culture, Sports, Science and Technology of Japan (to NO). This study
was also supported in part by grants from Japanese Society for the Promo-
tion of Science (to MH), and from TRIC, Research Organization of Infor-
mation and Systems (to HN).
Genome Biology 2007, Volume 8, Issue 9, Article R199 Nishihara et al. R199.9
comment reviews reports refereed researchdeposited research interactions information
Genome Biology 2007, 8:R199
References
1. Rokas A, Williams BL, King N, Carroll SB: Genome-scale
approaches to resolving incongruence in molecular
phylogenies. Nature 2003, 425:798-804.
2. Soltis DE, Albert VA, Savolainen V, Hilu K, Qiu YL, Chase MW, Farris
JS, Stefanovic S, Rice DW, Palmer JD, et al.: Genome-scale data,
angiosperm relationships, and 'ending incongruence': a cau-
tionary tale in phylogenetics. Trends Plant Sci 2004, 9:477-483.
3. Delsuc F, Brinkmann H, Chourrout D, Philippe H: Tunicates and
not cephalochordates are the closest living relatives of
vertebrates. Nature 2006, 439:965-968.
4. Blair JE, Ikeo K, Gojobori T, Hedges SB: The evolutionary position
of nematodes. BMC Evol Biol 2002, 2:7.
5. Phillips MJ, Delsuc F, Penny D: Genome-scale phylogeny and the
detection of systematic biases. Mol Biol Evol 2004, 21:1455-1458.
6. Delsuc F, Brinkmann H, Philippe H: Phylogenomics and the
reconstruction of the tree of life. Nat Rev Genet 2005, 6:361-375.
7. Dopazo H, Dopazo J: Genome-scale evidence of the nematode-
arthropod clade. Genome Biol 2005, 6:R41.
8. Philippe H, Lartillot N, Brinkmann H: Multigene analyses of bilat-
erian animals corroborate the monophyly of Ecdysozoa,
Lophotrochozoa, and Protostomia. Mol Biol Evol 2005,
22:1246-1253.
9. Jeffroy O, Brinkmann H, Delsuc F, Philippe H: Phylogenomics: the
beginning of incongruence? Trends Genet 2006, 22:225-231.
10. Gadagkar SR, Rosenberg MS, Kumar S: Inferring species phyloge-
nies from multiple genes: concatenated sequence tree ver-
sus consensus gene tree. J Exp Zoolog B Mol Dev Evol 2005,
304:64-74.
11. Seo TK, Kishino H, Thorne JL: Incorporating gene-specific vari-
ation when inferring and evaluating optimal evolutionary
tree topologies from multilocus sequence data.
Proc Natl Acad
Sci USA 2005, 102:4436-4441.
12. Madsen O, Scally M, Douady CJ, Kao DJ, DeBry RW, Adkins R,
Amrine HM, Stanhope MJ, de Jong WW, Springer MS: Parallel adap-
tive radiations in two major clades of placental mammals.
Nature 2001, 409:610-614.
13. Murphy WJ, Eizirik E, Johnson WE, Zhang YP, Ryder OA, O'Brien SJ:
Molecular phylogenetics and the origins of placental
mammals. Nature 2001, 409:614-618.
14. Murphy WJ, Eizirik E, O'Brien SJ, Madsen O, Scally M, Douady CJ,
Teeling E, Ryder OA, Stanhope MJ, de Jong WW, et al.: Resolution
of the early placental mammal radiation using Bayesian
phylogenetics. Science 2001, 294:2348-2351.
15. Kriegs JO, Churakov G, Kiefmann M, Jordan U, Brosius J, Schmitz J:
Retroposed elements as archives for the evolutionary his-
tory of placental mammals. PLoS Biol 2006, 4:e91.
16. Nishihara H, Hasegawa M, Okada N: Pegasoferae, an unexpected
mammalian clade revealed by tracking ancient retroposon
insertions. Proc Natl Acad Sci USA 2006, 103:9929-9934.
17. Waddell PJ, Okada N, Hasegawa M: Towards resolving the inter-
ordinal relationships of placental mammals. Syst Biol 1999,
48:1-5.
18. Delsuc F, Scally M, Madsen O, Stanhope MJ, de Jong WW, Catzeflis
FM, Springer MS, Douzery EJ: Molecular phylogeny of living
xenarthrans and the impact of character and taxon sampling
on the placental tree rooting. Mol Biol Evol 2002, 19:1656-1671.
19. Waddell PJ, Shelley S: Evaluating placental inter-ordinal phylog-
enies with novel sequences including RAG1, gamma-fibrino-
gen, ND6, and mt-tRNA, plus MCMC-driven nucleotide,
amino acid, and codon models. Mol Phylogenet Evol 2003,
28:197-224.
20. Amrine-Madsen H, Koepfli KP, Wayne RK, Springer MS: A new phy-
logenetic marker, apolipoprotein B, provides compelling evi-
dence for eutherian relationships. Mol Phylogenet Evol 2003,
28:225-240.
21. Springer MS, Stanhope MJ, Madsen O, de Jong WW: Molecules con-
solidate the placental mammal tree. Trends Ecol Evol 2004,
19:
430-438.
22. Murphy WJ, Pringle TH, Crider TA, Springer MS, Miller W: Using
genomic data to unravel the root of the placental mammal
phylogeny. Genome Res 2007, 17:413-421.
23. Smith AG, Smith DG, Funnell BM: Atlas of Cenozoic and Mesozoic
Coastlines New York: Cambridge University Press; 2004.
24. Kumar S, Hedges SB: A molecular timescale for vertebrate
evolution. Nature 1998, 392:917-920.
25. Yang Z, Nielsen R, Hasegawa M: Models of amino acid substitu-
tion and applications to mitochondrial protein evolution.
Mol Biol Evol 1997, 15:1600-1611.
26. Yang Z: PAML: a program package for phylogenetic analysis
by maximum likelihood. Comput Appl Biosci 1997, 13:555-556.
27. Shimodaira H, Hasegawa M: Multiple comparisons of log-likeli-
hoods with applications to phylogenetic inference. Mol Biol
Evol 1999, 16:1114-1116.
28. Kishino H, Hasegawa M: Evaluation of the maximum likelihood
estimate of the evolutionary tree topologies from DNA
sequence data, and the branching order in hominoidea. J Mol
Evol 1989, 29:170-179.
29. Akaike H: Information theory and an extension of the maxi-
mum likelihood principle. In Second International Symposium on
Information Theory: 1973 Edited by: Petrov BN, Csaki F. Budapest,
Hungary: Akademiai Kiado; 1973:267-281.
30. Burnham KP, Anderson DR: Model Selection and Multimodel Inference:
A Practical Information-Theoretic Approach 2003 2nd edition. New York,
NY: Springer; 2003.
31. Posada D, Buckley TR: Model selection and model averaging in
phylogenetics: advantages of akaike information criterion
and bayesian approaches over likelihood ratio tests. Syst Biol
2004, 53:793-808.
32. Brinkmann H, van der Giezen M, Zhou Y, Poncelin de Raucourt G,
Philippe H: An empirical assessment of long-branch attraction
artefacts in deep eukaryotic phylogenomics. Syst Biol 2005,
54:743-757.
33. Hallstrom B, Kullberg M, Nilsson M, Janke A: Phylogenomic data
analyses provide evidence that Xenarthra and Afrotheria
are sistergroups. Mol Biol Evol
2007, 24:2059-2068.
34. Felsenstein J: Cases in which parsimony or compatibility meth-
ods will be positively misleading. Syst Zool 1978, 27:401-410.
35. Kolaczkowski B, Thornton JW: Performance of maximum
parsimony and likelihood phylogenetics when evolution is
heterogeneous. Nature 2004, 431:980-984.
36. Lopez P, Casane D, Philippe H: Heterotachy, an important proc-
ess of protein evolution. Mol Biol Evol 2002, 19:1-7.
37. Spencer M, Susko E, Roger AJ: Likelihood, parsimony, and heter-
ogeneous evolution. Mol Biol Evol 2005, 22:1161-1164.
38. Lockhart P, Novis P, Milligan BG, Riden J, Rambaut A, Larkum T: Het-
erotachy and tree building: a case study with plastids and
eubacteria. Mol Biol Evol 2006, 23:40-45.
39. Shalchian-Tabrizi K, Skanseng M, Ronquist F, Klaveness D, Bachvaroff
TR, Delwiche CF, Botnen A, Tengs T, Jakobsen KS: Heterotachy
processes in rhodophyte-derived secondhand plastid genes:
implications for addressing the origin and evolution of dino-
flagellate plastids. Mol Biol Evol 2006, 23:1504-1515.
40. Rodriguez-Ezpeleta N, Philippe H, Brinkmann H, Becker B, Melkonian
M: Phylogenetic analyses of nuclear, mitochondrial, and plas-
tid multigene data sets support the placement of Mes-
ostigma in the Streptophyta. Mol Biol Evol 2007, 24:723-731.
41. Shedlock AM, Okada N: SINE insertions: powerful tools for
molecular systematics. Bioessays 2000, 22:148-160.
42. Hinrichs AS, Karolchik D, Baertsch R, Barber GP, Bejerano G, Claw-
son H, Diekhans M, Furey TS, Harte RA, Hsu F, et al.: The UCSC
Genome Browser Database: update 2006. Nucleic Acids Res
2006:D590-D598.
43. Altschul SF, Gish W, Miller W, Myers EW, Lipman DJ: Basic local
alignment search tool. J Mol Biol 1990,
215:403-410.
44. Schwartz S, Kent WJ, Smit A, Zhang Z, Baertsch R, Hardison RC,
Haussler D, Miller W: Human-mouse alignments with
BLASTZ. Genome Res 2003, 13:103-107.
45. Blanchette M, Kent WJ, Riemer C, Elnitski L, Smit AF, Roskin KM,
Baertsch R, Rosenbloom K, Clawson H, Green ED, et al.: Aligning
multiple genomic sequences with the threaded blockset
aligner. Genome Res 2004, 14:708-715.
46. Adachi J, Hasegawa M: MOLPHY version 2.3: programs for
molecular phylogenetics based on maximum likelihood.
Comput Sci Monogr 1996, 28:1-150.
47. Shimodaira H, Hasegawa M: CONSEL: for assessing the confi-
dence of phylogenetic tree selection. Bioinformatics 2001,
17:1246-1247.
48. Kishino H, Miyata T, Hasegawa M: Maximum likelihood inference
of protein phylogeny and the origin of chloroplasts. J Mol Evol
1990, 31:151-160.
49. Swofford DL: PAUP*. Phylogenetic Analysis Using Parsimony (*And Other
Methods). Version 4 Sunderland, Massachusetts: Sinauer Associates;
2003.
50. Kumar S, Tamura K, Nei M: MEGA3: Integrated software for
R199.10 Genome Biology 2007, Volume 8, Issue 9, Article R199 Nishihara et al. />Genome Biology 2007, 8:R199
molecular evolutionary genetics analysis and sequence
alignment. Brief Bioinform 2004, 5:150-163.
51. Schmidt HA, Strimmer K, Vingron M, von Haeseler A: TREE-PUZ-
ZLE: maximum likelihood phylogenetic analysis using quar-
tets and parallel computing. Bioinformatics 2002, 18:502-504.