Báo cáo y học: "Reversible and permanent effects of tobacco smoke exposure on airway epithelial gene expression" pptx
Bạn đang xem bản rút gọn của tài liệu. Xem và tải ngay bản đầy đủ của tài liệu tại đây (558.97 KB, 17 trang )
Genome Biology 2007, 8:R201
comment reviews reports deposited research refereed research interactions information
Open Access
2007Beaneet al.Volume 8, Issue 9, Article R201
Research
Reversible and permanent effects of tobacco smoke exposure on
airway epithelial gene expression
Jennifer Beane
*†
, Paola Sebastiani
‡
, Gang Liu
†
, Jerome S Brody
†
,
Marc E Lenburg
†§
and Avrum Spira
*†
Addresses:
*
Bioinformatics Program, Boston University, Cummington Street, Boston, MA 02215, USA.
†
The Pulmonary Center, Boston
University Medical Center, Albany Street, Boston, MA 02118, USA.
‡
School of Public Health, Boston University, Albany Street, Boston, MA
02118, USA.
§
Department of Genetics and Genomics, Boston University, Albany Street, Boston, MA 02118, USA.
Correspondence: Jennifer Beane. Email:
© 2007 Beane et al; licensee BioMed Central Ltd.
This is an open access article distributed under the terms of the Creative Commons Attribution License ( which
permits unrestricted use, distribution, and reproduction in any medium, provided the original work is properly cited.
Effects of tobacco smoke on gene expression<p>Oligonucleotide microarray analysis revealed 175 genes that are differentially expressed in large airway epithelial cells of people who currently smoke compared with those who never smoked, with 28 classified as irreversible, 6 as slowly reversible, and 139 as rapidly revers-ible.</p>
Abstract
Background: Tobacco use remains the leading preventable cause of death in the US. The risk of
dying from smoking-related diseases remains elevated for former smokers years after quitting. The
identification of irreversible effects of tobacco smoke on airway gene expression may provide
insights into the causes of this elevated risk.
Results: Using oligonucleotide microarrays, we measured gene expression in large airway
epithelial cells obtained via bronchoscopy from never, current, and former smokers (n = 104).
Linear models identified 175 genes differentially expressed between current and never smokers,
and classified these as irreversible (n = 28), slowly reversible (n = 6), or rapidly reversible (n = 139)
based on their expression in former smokers. A greater percentage of irreversible and slowly
reversible genes were down-regulated by smoking, suggesting possible mechanisms for persistent
changes, such as allelic loss at 16q13. Similarities with airway epithelium gene expression changes
caused by other environmental exposures suggest that common mechanisms are involved in the
response to tobacco smoke. Finally, using irreversible genes, we built a biomarker of ever exposure
to tobacco smoke capable of classifying an independent set of former and current smokers with
81% and 100% accuracy, respectively.
Conclusion: We have categorized smoking-related changes in airway gene expression by their
degree of reversibility upon smoking cessation. Our findings provide insights into the mechanisms
leading to reversible and persistent effects of tobacco smoke that may explain former smokers
increased risk for developing tobacco-induced lung disease and provide novel targets for
chemoprophylaxis. Airway gene expression may also serve as a sensitive biomarker to identify
individuals with past exposure to tobacco smoke.
Published: 25 September 2007
Genome Biology 2007, 8:R201 (doi:10.1186/gb-2007-8-9-r201)
Received: 8 January 2007
Revised: 17 September 2007
Accepted: 25 September 2007
The electronic version of this article is the complete one and can be
found online at />R201.2 Genome Biology 2007, Volume 8, Issue 9, Article R201 Beane et al. />Genome Biology 2007, 8:R201
Background
Tobacco use remains the leading preventable cause of death
in the United States, and cigarette smoking is the primary
cause of chronic obstructive pulmonary disease and respira-
tory-tract cancers. Smoking is responsible for approximately
440,000 deaths per year in the US, resulting in 5.6 million
years of potential life lost, $75 billion in direct medical costs,
and $82 billion in lost productivity [1]. Exposure to tobacco
smoke is widespread - approximately 45 million Americans
are current smokers and 46 million are former smokers [2].
The risk of dying from smoking related diseases such as lung
cancer and chronic obstructive pulmonary disease remains
elevated for former smokers compared to never smokers [3].
In the Dorn Study of US veterans, the Kaiser Permanente Pro-
spective Mortality Study, and American Cancer Society Can-
cer Prevention Study I (CPS-I) populations, the risk of death
from lung cancer among former smokers was elevated above
never smokers 20 or more years following cessation [4]. The
Iowa Women's Health Study also found that former smokers
had an elevated lung cancer risk compared with never smok-
ers and that the risk for adenocarcinoma was elevated up to
30 years after quitting [5]. As an increasing fraction of current
smokers become former smokers, more lung cancer cases will
occur in former smokers as the absolute risk of lung cancer in
the population declines [6]. It would be useful, therefore, to
understand why former smokers remain at risk for lung can-
cer after smoking cessation in order to develop chemoproph-
ylaxis treatments that might reduce risk.
A number of studies have shown that histologically normal
large airway epithelial cells of current and former smokers
with and without lung cancer display allelic loss [7,8],
genomic instability [9], p53 mutations [10], changes in DNA
methylation in the promoter regions of several genes (includ-
ing RAR
β
, H-cadherin, APC, p16
INK4a
, and RASFF1 [11,12]),
as well as changes in telomerase activity [13,14]. Many of the
changes persist in smokers for years after cessation [8,9].
These observations suggest that the entire respiratory tree is
affected by cigarette smoke, and that large airway cells might
provide insight into the types and degree of epithelial cell
injury that have occurred in current or former smokers.
We have previously reported a genome-wide expression pro-
filing study of large bronchial airway epithelial cells obtained
via bronchoscopy from never, current, and former smokers
[15]. In that study, we defined the baseline airway gene
expression profile among healthy never smokers and identi-
fied gene expression changes that occur in response to smoke
exposure. Of note, we found that a subset of genes modulated
by smoking did not return to baseline years after smoking ces-
sation. However, the limited sample size of the former
smoker group (n = 18) precluded a detailed study of gene
expression reversibility post-smoking cessation.
In this study, we collected airway epithelial cells from a larger
sample of never, current, and former smokers and developed
statistical models to identify the gene expression changes
associated with smoking and categorized the degree to which
these are reversible upon smoking cessation. We further
explored the relationship between these gene expression
changes and a number of publicly available human bronchial
epithelial microarray datasets. The comparison of our dataset
with the other datasets provides insights into common mech-
anisms airway epithelial cells use in response to a variety of
different toxins. Lastly, development of a biomarker for ever
tobacco smoke exposure using genes irreversibly altered by
cigarette smoke provided additional validation of the gene
expression changes upon smoking cessation and may provide
a useful tool for epidemiological studies.
Results
Patient population
Demographic information for the 21 never, 31 former, and 52
current smokers used in the present study are shown in Table
1. There were significant differences in age among the three
groups (P < 0.05 by pairwise t-tests); however, there was no
significant difference between cumulative tobacco exposure
between the former and current smokers.
Effect of smoking and smoking cessation
Three-hundred and forty-three probesets show significant
differences in intensity between current and never smokers
Table 1
Demographic information for the never, former, and current smokers
Never Former Current
n213152
Age 32.3 (10.7) 55.9 (14.7) 48.6 (15.2)
Pack years 34.0 (30.1) 34.5 (34.2)
Months since quitting 145.2 (162.82)
The mean and standard deviation (in parentheses) are reported. There is a significant age difference between the groups (P < 0.05 for all two-way
group comparisons by t-test).
Genome Biology 2007, Volume 8, Issue 9, Article R201 Beane et al. R201.3
comment reviews reports refereed researchdeposited research interactions information
Genome Biology 2007, 8:R201
based on the significance of the current smoking status varia-
ble in the linear model (q-value < 0.05 corresponding to a P <
7.6 × 10
-4
; see Materials and methods). Two-hundred and
nineteen probesets remained after applying a filter to retain
only probesets where the absolute current smoking status
coefficient was greater than or equal to 0.584 (corresponds to
an age-adjusted fold change between current and never
smokers of 1.5). Finally, after filtering out redundant
probesets (probesets representing the same gene) from this
set of 219 probesets, probesets representing 175 genes
remained. There was a high degree of overlap (78%) between
genes we previously identified as being perturbed by active
cigarette smoke exposure [15] and the 175 genes identified by
the linear model.
The 175 genes differentially expressed between current and
never smokers were classified as irreversible, slowly reversi-
ble, or rapidly reversible based on their behavior in former
smokers (Figure 1). This yielded 28 irreversible genes, 6
slowly reversible genes, 139 rapidly reversible genes, and 2
indeterminate genes. The 139 rapidly reversible genes were
subsequently divided into three equal tertiles based on their
percent reversibility (see Materials and methods; Figure 2a).
Genes classified as slowly reversible were characterized by the
time point at which the age-adjusted fold change between
never and former smokers dropped below the threshold of 1.5
(see Materials and methods). The time point is greater than
78 months for all of the genes classified as slowly reversible
(Figure 2b). A list of the 175 genes as well as their reversibility
classification and percentage is displayed in Additional data
file 1. The gene expression level was confirmed by quantita-
tive real time PCR for two irreversible and two rapidly revers-
ible genes (Figure 3).
Interestingly, 65% of the slowly reversible and irreversible
genes were down-regulated by smoking, while only 23% of
rapidly reversible genes were down-regulated by smoking
(Fisher exact test P = 7.2 × 10
-6
). Amongst the rapidly revers-
ible genes, those that were down-regulated tended to be the
least reversible as determined by percent reversibility (Fisher
exact test P = 0.0001 comparing the proportion of down-reg-
ulated genes in each tertile). Genes down-regulated by smok-
ing, for example, account for only 6.5% of the most reversible
tertile of rapidly reversible genes (n = 46), but account for
43% of the least reversible tertile (Figure 2a).
As expected, a principal component analysis (PCA) using the
irreversible and slowly reversible genes shows that former
smokers are similar to current smokers (Figure 4a), while a
PCA using the most reversible tertile of rapidly reversible
genes demonstrates the reverse (Figure 4b). The PCA analy-
ses also demonstrate heterogeneity among former smokers.
There are 3 former smokers (time since quit smoking 96, 156,
and 300 months) in Figure 4a that cluster with the never
smokers and 3 former smokers (time since quit smoking 3, 6,
and 14 months) in Figure 4b that cluster with the current
smokers, raising the possibility that these individuals may
have a different physiological response to tobacco smoke. A
heatmap of the gene expression levels of never, former, and
current smokers across the slowly reversible and irreversible
genes as well as the most reversible tertile of rapidly reversi-
ble genes demonstrates the greater proportion of genes
down-regulated by smoking among the irreversible and
slowly reversible genes (Figure 4c).
EASE [16] was used to identify which Gene Ontology (GO)
molecular function categories [17], KEGG pathways [18],
GenMAPP pathways [19], and chromosomal cytobands are
over-represented (Permutation P ≤ 0.01) among genes desig-
nated as irreversible and slowly reversible or reversible com-
pared to all annotated genes on the Affymetrix U133A
microarray (Table 2). The metallothioneins (MT1G, MT1X,
and MT1F) and the chemokine CX3CL1 are located on Cyto-
band 16q13, which is over-represented among irreversible
and slowly reversible genes (Figure 4a). Although not all met-
allothioneins in the region of 16q13 were present in the list of
175 genes, all of the probesets on the U133A corresponding to
MT4, MT3, MT2A, MT1E, MT1M, MT1F, MT1G, MT1H, and
MT1X were down-regulated in current smokers. Genes
involved in the metabolism of the carcinogenic components
of cigarette smoke, including electron transporter activity and
oxidoreductase activity, are over-represented among the rap-
idly reversible genes. Genes with oxidoreductase activity,
such as the aldo-keto reductases, aldehyde dehydrogenases,
and the cytochrome p450s, were predominantly present in
the most reversible tertile of the rapidly reversible genes
(Fisher Exact P = 1.3 × 10
-5
comparing the proportions of
genes in each tertile with oxidoreductase activity; Figure 4c).
Enrichment of irreversible and reversible genes in
bronchial epithelial cell datasets
In order to confirm the impact of smoking on airway epithe-
lial cell gene expression and examine the specificity of this
response, we compared our findings with ten other previously
published human bronchial airway epithelial cell microarray
datasets involving a variety of exposures (Additional data file
2). PCAs were performed for each of the 10 datasets across the
175 genes (differentially expressed between never and current
smokers) that could be mapped to the microarray platform
used in each study using gene symbols (data not shown). Of
the 175 genes, 173 had gene symbols, and all of these mapped
to the following datasets: GSE5264, GSE3397, GSE3320
GSE3183, GSE2111, and GSE620. One-hundred forty-nine
genes mapped to GSE2302 and GSE1276, and 135 genes
mapped to datasets GSE1815 and GSE3004. The relationship
between the experimental conditions studied in each of the
Gene Expression Omnibus (GEO) datasets to our dataset was
defined using gene set enrichment analysis (GSEA; Table 3).
Significant GSEA results (p value < 0.05 and false discovery
rate (FDR) < 0.25) are displayed in Figure 5a. Genes that are
perturbed by smoking in the present study are also enriched
or differentially expressed (by the signal to noise metric [20])
R201.4 Genome Biology 2007, Volume 8, Issue 9, Article R201 Beane et al. />Genome Biology 2007, 8:R201
in the three smoking datasets, corroborating the gene expres-
sion changes identified by the linear model. Genes up- and
down-regulated by smoking in our dataset were most closely
related to (had the highest enrichment scores) genes differen-
tially expressed in dataset GSE3320. GSE3320 was generated
using epithelial cells obtained from the small airways (10th to
12th order) at bronchoscopy from both non-smoking and
smoking volunteers, and is thus the most closely related to
our dataset [21]. Genes up-regulated by smoking in our data-
set are also up-regulated in dataset GSE2302. The lack of
enrichment in genes down-regulated by smoking in our data-
set and genes down-regulated in GSE2302 may reflect differ-
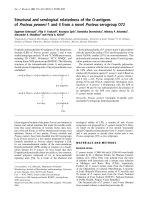
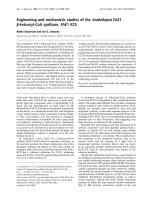
Methodology for gene classification by degree of reversibility upon smoking cessationFigure 1
Methodology for gene classification by degree of reversibility upon smoking cessation. For each probeset, the relationship between gene expression in log
2
scale (ge), age, current smoking status (x
curr
), former smoking status (x
form
), and the interaction between former smoking status and months elapsed since
quitting smoking (x
tq
) was examined with the linear regression model. Genes differentially expressed between current (C) and never (N) smokers were
categorized based on their behavior in former smokers (F) relative to never smokers as a function of time since smoking cessation. Genes were classified
as 'rapidly reversible' if there was not a significant difference between former and never smokers. Genes were classified as 'indeterminate' if there was a
significant difference between former and never smokers, but the age-adjusted fold change between former and never smokers was not greater than or
equal to 1.5. If the fold change criterion was met, genes were classified as 'slowly reversible' if there was a significant relationship between gene expression
and time since quitting smoking or as 'irreversible' if there was not a significant relationship with time.
Identify genes differentially expressed between
C and N
β
curr
q-value < 0.05
Absolute (bcurr) > 0.584
(Age-adjusted Fold Change (C/N) >1.5)
n=175 genes
Classify genes
Irreversible Slowly Reversible
Rapidly Reversible
Indeterminate
β
form
p-value <0.001
Absolute (
βform)>0.584
(Age-adjusted Fold Change (F/N)>1.5)
β
form.tq
p-value < 0.01
Ye sNo
Ye sNo
Ye sNo
n=2 genes
n=28 genes n=6 genes
n=139 genes
Regression Equation
ge
i
=
β
0
+
β
age
*x
age
+
β
curr
*x
curr
+
β
form
*x
form
+
β
form.tq
*x
form
*x
tq
+e
i
Genome Biology 2007, Volume 8, Issue 9, Article R201 Beane et al. R201.5
comment reviews reports refereed researchdeposited research interactions information
Genome Biology 2007, 8:R201
ences between the effects of acute and chronic cigarette
smoke exposure; our study is likely to capture the gene
expression consequences of chronic exposure while bronchial
cell cultures in the GSE2302 series were exposed to smoke for
only 15 minutes and assayed at 4 and 24 hour time points
after the exposure.
In contrast to the above two datasets, the similarity between
the gene expression changes in our dataset and those in
GSE1276 was not as strong. GSE1276 used bronchial epithe-
lial cells obtained from cadavers to study the effects of the S9
microsomal fraction from 1254-Aroclor treated rats and ciga-
rette smoke condensate from two different brands of ciga-
rettes at 2, 4, 8, and 12 hour time points [22]. Genes down-
regulated by smoking in our dataset were also down-regu-
lated in epithelial cells treated with S9 plus cigarette smoke
condensate for 8 and 12 hours compared to earlier time
points. The uniqueness of GSE1276 is potentially due to the
S9 treatment, which had unexpected broad effects on gene
expression that may enhance or suppress the effects of the
tobacco smoke condensate [22].
Genes that are perturbed by tobacco smoke exposure in our
dataset also show some evidence of differential expression in
six out of seven additional bronchial epithelial cell datasets.
Genes up-regulated by smoking tended to be genes that are
down-regulated by interferon gamma treatment for 24 hours
in (GSE1815) [23], suggesting that smoking may have an
immunosuppressive effect. Genes up-regulated in smoking
also tended to be genes that are down-regulated at later time
points during mucociliary differentiation (GSE5264) [24],
suggesting that the damage caused by tobacco-smoke induces
genes that are expressed more highly in undifferentiated epi-
thelial cells. Genes down-regulated by smoking tended to be
genes that are up-regulated in response to zinc sulfate
(GSE2111) [25]. These included the metallothionein genes
(MT1X, MT1F, and MT1G). Taken together, the above results
suggest that the bronchial epithelial cell response to tobacco
smoke exposure consists of components that are shared with
the response to a variety of other exposures.
Identifying common biological themes across datasets
In order to build upon the relationships between the datasets
described above, we sought to establish additional
relationships at the functional or pathway level. Gene lists
composed of the genes in each of the over-represented gene
categories (Table 2) were used to determine if these gene cat-
egories tended to be differentially expressed in the other
bronchial cell datasets using GSEA (Figure 5b). This analysis
shows that genes in five of the six functional categories that
are induced by smoking and rapidly reversible upon smoking
cessation also tended to be differentially expressed in two of
the three smoking datasets. This further strengthens the
notion that a similar bronchial epithelial response to tobacco
smoke exposure is being detected in these datasets. Addition-
ally, genes involved in oxidoreductase activity (which we
found to be induced by smoking and rapidly reversible upon
smoking cessation) are enriched among genes down-regu-
lated during differentiation (GSE5264) or in response to
interferon gamma treatment (GSE1815). These genes are also
enriched among genes up-regulated in response to 4-phenyl-
butyrate (4-PBA) (GSE620) or interleukin-13 (GSE3183).
Biomarker of past exposure
Irreversible gene expression changes in response to tobacco
smoke exposure suggest that a gene expression biomarker
can be developed that indicates whether an individual has
ever been exposed to tobacco smoke. The ability of such a
biomarker to accurately classify additional former smoker
samples would serve as an important validation of the irre-
versible gene expression changes we identified. A biomarker
of tobacco exposure was constructed using the 28 irreversible
genes and a training set of never and former smokers from
our primary dataset (n = 52). A support vector machine
(SVM) classifier was able to classify 100% of the training set
samples correctly. The SVM was then first used to predict the
tobacco exposure status of the current smokers in our dataset.
Not surprisingly, as these samples were used to define the 28
irreversible genes despite having not used these samples to
develop the SVM, the SVM correctly predicted 89% of current
smokers as having had exposure to cigarette smoke. The 6
current smokers predicted incorrectly had low pack-years
(average was 9.5 in contrast to the group average of 34.5). In
addition, current and former smokers from a previous study
(GSE4115) [26] that did not overlap with the samples used in
this study were used as an additional test set. In this dataset,
the SVM correctly classified 100% of current smokers and
81% of former smokers. Dividing the former smokers from
dataset GSE4115 into 3 groups, former smokers who quit less
than 2 years ago (n = 12), former smokers who quit greater
than or equal to 2 years but less than 10 years ago (n = 15), and
former smokers who quit greater than or equal to 10 years ago
(n = 20) yielded similar accuracies (83%, 80%, and 80%,
respectively). Finally, the SVM correctly predicted the class of
all samples from non-smokers (n = 4) and 80% of samples
from smokers (n = 5) from a recently published dataset
(GSE5372). The accuracy of the biomarker in predicting
samples from datasets GSE4115 and GSE5372 was signifi-
cantly better than the accuracies obtained in 1,000 runs that
trained the SVM on class-randomized training sets (P = 0.01
and P = 0.001, respectively; Table 4).
Discussion
Using linear models, we have identified genes differentially
expressed in airway epithelium between never and current
smokers and have characterized expression levels of these
genes in former smokers who quit smoking for different peri-
ods of time. The majority (79%) of genes differentially
expressed between current and never smokers are rapidly
reversible upon smoking cessation while the remainders are
either slowly reversible or irreversible. Differences between
R201.6 Genome Biology 2007, Volume 8, Issue 9, Article R201 Beane et al. />Genome Biology 2007, 8:R201
Figure 2 (see legend on next page)
Number of genes
(a)
Up-regulated in current smokers
Down-regulated in current smokers
To t al
Tertile 1
Tertile 2
Tertile 3
Most Least
Rapidly reversible genes
Slowly reversible
and irreversible genes
n=10
n=119
0 50 100 150 200 250 300
2.4 2.2 2.0 1.8 1.6 1.4 1.2
Time (months)
Fold change of never versus former smokers
MT1X (78 months)
TNFSF13/TNFSF12-TNFSF13 (90 months)
MT1G (131 months)
CX3CL1 (131 months)
MT1F (173 months)
FAM107A (273 months)
80
60
40
20
0
20
40
60
80
100
120
140
(b)
Genome Biology 2007, Volume 8, Issue 9, Article R201 Beane et al. R201.7
comment reviews reports refereed researchdeposited research interactions information
Genome Biology 2007, 8:R201
the rapidly reversible and slowly reversible or irreversible
genes further suggest that their expression might be regulated
through different mechanisms. The rapidly reversible genes
have different biological functions than the slowly reversible
or irreversible genes, suggesting that they might distinguish
between an acute response to tobacco smoke and a more
long-lasting response to tobacco smoke induced epithelial cell
damage. The gene expression consequences of tobacco smoke
exposure we identified are similar to gene expression changes
observed in other human bronchial airway gene expression
datasets involving tobacco smoke. Commonalities with
human bronchial airway datasets involving other exposures
suggest that the response to tobacco smoke exposure involves
a number of common bronchial airway pathways. The accu-
racy of a biomarker of tobacco smoke exposure using irrevers-
ible genes in additional samples suggests that the
irreversibility of these gene expression changes may provide
a useful tool for assessing past exposure to tobacco smoke.
Many of the rapidly reversible genes are up-regulated by
smoking and are involved in a protective or adaptive response
to tobacco exposure and the detoxification of tobacco smoke
components. The cytochrome p450s, CYP1A1 and CYP1B1, for
example, are among the rapidly reversible genes and are
involved in the oxidation of many compounds, including fatty
acids, steroids, and xenobiotics. CYP1A1 and CYP1B1 have
been previously described as being up-regulated in response
to smoke [27] and CYP1B1 polymorphisms can influence the
risk of developing lung cancer among never smokers [28].
Several aldo-keto reductases, like AKR1B10 and AKR1C1, are
also rapidly reversible upon smoking cessation. Aldo-keto
reductases are soluble NADPH oxidoreductases that are
involved in the activation of polycyclic aromatic hydrocar-
bons present in tobacco smoke and in the detoxification of
highly carcinogenic nicotine-derived nitrosamino-ketone
(NNK) compounds [29]. Another class of rapidly reversible
genes are the aldehyde dehydrogenases, such as ALDH3A1,
which are involved in the oxidation of toxic aldehydes pro-
duced from oxidative stress and exposure to tobacco smoke
[30]. Both the cytochrome p450s and the aldehyde dehydro-
genases have been found to be up-regulated in respiratory tis-
sue from rats exposed to smoke [31] and the aldo-keto
reductases are up-regulated in normal bronchial epithelium
and non-small cell lung tumor tissue from smokers compared
with non-smokers [32]. All of the genes listed above as well as
most of the differentially expressed genes that are members
of the GO molecular function category 'oxidoreductase activ-
ity' are among the most highly reversible genes, suggesting
that the up-regulation of these genes is driven by the acute
exposure to smoke-related toxins and returns to baseline
soon after the exposure to these compounds ceases. The
induction of these genes in airway epithelial cells after 15 min-
utes of exposure to tobacco smoke (GSE2302) lends further
support to this hypothesis.
In contrast to the rapidly reversible genes, the slowly reversi-
ble and irreversible genes reflect a more permanent host-
response to tobacco smoke. Interestingly, several of these
genes have been associated with the development of cancers
of epithelial origin. CEACAM5, carcinoembryonic antigen-
related cell adhesion molecule 5, is irreversibly up-regulated
by smoking and is elevated in the serum of cancer patients
with lung adenocarcinoma [33] and colorectal cancer [34].
SULF1 (sulfatase 1), a gene irreversibly down-regulated by
smoking, influences the sulfation state of residues present on
heparin sulfate proteoglycans, which are involved in cell
adhesion and mediate growth factor signaling. SULF1 was
found to be down-regulated in ovarian, breast, pancreatic,
renal, and hepatocellular carcinoma cell lines [35] and head
and neck squamous carcinomas [36]. UPK1B, uroplakin 1B,
plays a role in strengthening and stabilizing the apical cell
surface through interactions with the cytoskeleton [37].
UPK1B is irreversibly down-regulated by smoking and has
been shown to be reduced or absent in bladder carcinomas
through CpG methylation of the proximal promoter [38,39].
The enrichment of down-regulated genes among the irrevers-
ible, slowly reversible, and the least rapidly reversible genes
suggests that genetic or epigenetic mechanisms, such as
chromosomal loss [7,8] or changes to promoter methylation
status [11,12], might account for the relative permanence of
these gene expression differences. Given the rather rapid
turnover of airway epithelial cells, the persistence of these
changes post-smoking cessation may result from a clonal
growth advantage to epithelial cells in the airway harboring
these changes. Several of the down-regulated slowly reversi-
ble genes are present in cytoband 16q13, where a number of
metallothioneins are located. Metallothioneins have the abil-
ity to bind both essential metals, like copper and iron, as well
as toxic metals, such as cadmium and mercury. They also
have detoxification and antioxidant properties and may be
involved in cell proliferation and differentiation [40]. MT3
has been shown to be down-regulated by hypermethylation in
non-small cell lung tumors and cell lines [41]. In addition,
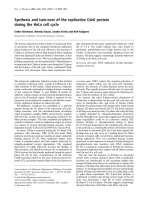
Characteristics of genes classified as irreversible, slowly reversible, or rapidly reversible based on their behavior in former smokersFigure 2 (see previous page)
Characteristics of genes classified as irreversible, slowly reversible, or rapidly reversible based on their behavior in former smokers. (a) Numbers of genes
up-regulated (red) or down-regulated (blue) in current smokers compared to never smokers. The percentage of genes up-regulated in smoking decreases
from the most to the least reversible tertile of rapidly reversible genes and is lowest in the slowly reversible and irreversible genes. (b) The age-adjusted
fold change between never versus former smokers (y-axis) is plotted as a function of time since quitting smoking (x-axis) for the genes classified as slowly
reversible. All the slowly reversible genes are down-regulated in smoking. The time point that the fold change equals 1.5 (see dotted line) is defined as the
time that the genes become reversible. The time point at which this occurs is greater than 78 months (6.5 years) after smoking cessation for all of the
slowly reversible genes.
R201.8 Genome Biology 2007, Volume 8, Issue 9, Article R201 Beane et al. />Genome Biology 2007, 8:R201
metallothioneins are thought to regulate some zinc-depend-
ent transcription factors, such as the tumor suppressor p53,
by donating zinc [42]. Potential loss or methylation of the
chromosomal locus containing several metallothionein genes
may impair the ability of epithelial cells to protect or to repair
cellular injury from future environmental exposures that
occur after smoking cessation.
In order to confirm the observed effect of smoking and smok-
ing cessation described above, we compared our dataset with
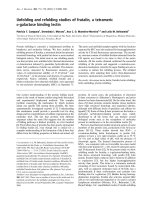
Quantitative real time PCR results for select genes across never, former, and current smokersFigure 3
Quantitative real time PCR results for select genes across never, former, and current smokers. For each graph sample identifiers for never (orange),
former (purple), and current (green) smokers are listed along the x-axis. The sample identifications P1, P2, and P3 refer to three samples collected
prospectively from never smokers that do not have corresponding microarrays. The months since smoking cessation are listed below each former
smoker. The relative expression level on the y-axis is the ratio of the expression level of a particular sample versus that of a dummy reference sample. (a)
Plots of two rapidly reversible genes, CYP1B1 and ALDH3A1. (b) Plots of two irreversible genes, CEACAM5 and NQO1.
0.0
2.0
4.0
6.0
8.0
10.0
12.0
14.0
16.0
18.0
20.0
0.0
10.0
20.0
30.0
40.0
50.0
60.0
0.0
20.0
40.0
60.0
80.0
100.0
120.0
140.0
160.0
180.0
0.0
50.0
100.0
150.0
200.0
250.0
300.0
350.0
400.0
(a) (b)
CYP1B1
NQO1ALDH3A1
CEACAM5
105 P1 P2 P3 172 301 87 106 81
105 P1 P2 P3 172 301 84 82 99
105 P1 P2 P3 147 196 125 92 88
105 P1 P2 P3 172 301 125 82 99
Quanitative RT-PCR
Microarray
468 36 14
months
468 36 14
months
468 36 9
months
360 96 9
months
Relative expression levelRelative expression level
Relative expression levelRelative expression level
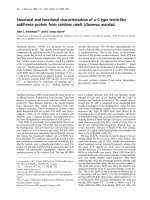
Relationship between samples according to the expression of genes with different reversibility characteristicsFigure 4 (see following page)
Relationship between samples according to the expression of genes with different reversibility characteristics. PCAs are shown on the left for (a) the
slowly reversible and irreversible genes (n = 34) and (b) the most rapidly reversible genes (n = 46). (c) False-color heatmaps are shown on the right for
the slowly reversible and irreversible genes (top) and the most reversible tertile of rapidly reversible genes (bottom). Never, former, and current smokers
are colored in orange, purple, and green respectively. The PCA and heatmaps were constructed using gene expression data normalized to a mean of zero
and a standard deviation of 1. Never and current smokers are organized according to increasing age and former smokers are ordered by decreasing time
since quitting smoking (denoted by the gradient) along the sample axis in the heatmap. Affymetrix identifications and HUGO gene symbols are listed for
each gene as well as membership in two over-represented functional categories by EASE analysis.
Genome Biology 2007, Volume 8, Issue 9, Article R201 Beane et al. R201.9
comment reviews reports refereed researchdeposited research interactions information
Genome Biology 2007, 8:R201
Figure 4 (see legend on previous page)
PC2
PC1
(a)
(b)
Never Former Current
Chromosomal Cytoband 16q13
Oxidoreductase Activity
-6
-4
-2
0
2
4
6
-12 -10 -8 -6 -4 -2 0 2 4 6 8 10 12
PC1
PC2
211361_s_at SERPINB13
210065_s_at UPK1B
205499_at SRPX2
201884_at CEACAM5
209386_at TM4SF1
211657_at CEACAM6
203221_at TLE1
207222_at PLA2G10
202831_at GPX2
207469_s_at PIR
201468_s_at NQO1
213351_s_at TMCC1
221747_at TNS1
204753_s_at HLF
216346_at SEC14L3
217853_at TNS3
218718_at PDGFC
220908_at CCDC33
219820_at SLC6A16
204041_at MAOB
218025_s_at PECI
202746_at ITM2A
219584_at PLA1A
205680_at MMP10
212354_at SULF1
200953_s_at CCND2
823_at CX3CL1
209074_s_at FAM107A
204745_x_at MT1G
208581_x_at MT1X
210524_x_at
213629_x_at MT1F
213432_at MUC5B
210314_x_at TNFSF13
202555_s_at MYLK
204416_x_at APOC1
205725_at SCGB1A1
209448_at HTATIP2
218885_s_at GALNT12
204532_x_at UGT1A10
206094_x_at UGT1A6
209213_at CBR1
205328_at CLDN10
209921_at SLC7A11
204059_s_at ME1
205749_at CYP1A1
202437_s_at CYP1B1
203180_at ALDH1A3
208680_at PRDX1
201266_at TXNRD1
201118_at PGD
210505_at ADH7
203925_at GCLM
202923_s_at GCLC
217975_at WBP5
205513_at TCN1
203126_at IMPA2
203306_s_at SLC35A1
218579_s_at DHX35
208700_s_at TKT
201463_s_at TALDO1
209699_x_at AKR1C2
216594_x_at AKR1C1
209160_at AKR1C3
206561_s_at AKR1B10
205623_at ALDH3A1
201272_at AKR1B1
217626_at
205221_at HGD
206153_at CYP4F11
204235_s_at GULP1
214211_at FTH1
207430_s_at MSMB
219118_at FKBP11
204017_at KDELR3
210397_at DEFB1
220192_x_at SPDEF
219956_at GALNT6
214303_x_at MUC5AC
204623_at TFF3
(c)
-6
-4
-2
0
2
4
6
-12 -10 -8 -6 -4 -2 0 2 4 6 8 10 12
Slowly Reversible
Irreversible
Rapidly Reversible
-4 0 4
R201.10 Genome Biology 2007, Volume 8, Issue 9, Article R201 Beane et al. />Genome Biology 2007, 8:R201
other publicly available human bronchial epithelial cell data-
sets involving a variety of exposures. Reproducibility of find-
ings using different microarray datasets across similar
experimental conditions and cell types has not traditionally
been common practice because overlap between differentially
expressed gene sets is often surprisingly small [43]. New
methodologies for comparing datasets make the task more
feasible [44], and provide more powerful methods for deter-
mining commonalities between the observed responses of a
particular cell type under one or more conditions. The
tobacco exposure associated gene expression changes we
observed were concordant in three other datasets involving
tobacco smoke exposures. The most significant similarity
involved the gene expression consequences of tobacco smoke
exposure in the small airway epithelium of never and current
smokers (GSE3320). This suggests that the field of injury in
response to tobacco smoke is similar throughout both the
large and small airways. There was also significant similarity
between those genes we found to be up-regulated by smoking
and the immediate gene expression changes resulting from
acute tobacco exposure (GSE2302). This similarity was sig-
nificant for both rapidly reversible and irreversible/slowly
reversible up-regulated genes (data not shown). The lack of
similarity among genes down-regulated by smoking in our
dataset and GSE2302 may reflect differences between acute
and chronic cigarette smoke exposure, and suggests that up-
and down-regulated irreversible gene expression may occur
through different biological mechanisms. Additional large
datasets of acute and chronic tobacco smoke exposure are
needed to further explore these hypotheses.
There were also significant similarities between genes up-
and down-regulated by smoking and the gene expression dif-
ferences in additional datasets such as GSE5264 (cells under-
going mucociliary differentiation) and GSE1815 (interferon
gamma treated cells). These may provide biological insights
about the nature of airway epithelial response to tobacco
smoke exposure. The gene expression program that accompa-
nies mucociliary differentiation has led to the hypothesis that
cultured 'undifferentiated' epithelial cells may more closely
resemble damaged epithelium or neoplastic lesions in vivo
because many genes associated with normal squamous epi-
thelia, squamous cell carcinomas, or epidermal growth factor
receptor signaling are more highly expressed in undifferenti-
ated cells [24]. The similarity between genes up-regulated by
smoking in our dataset and genes that are more highly
expressed early in mucociliary differentiation together with
the similarity between genes down-regulated by smoking in
our dataset and genes that are more highly expressed late in
mucociliary differentiation might, therefore, reflect the cellu-
lar damage induced by smoke exposure. In addition, there
was similarity between genes up-regulated by smoking in our
dataset and genes down-regulated by treatment with inter-
feron gamma. As interferon gamma plays a role in lung
inflammatory responses, these similarities suggest that
tobacco smoke exposure may suppress inflammatory
responses in the airway. The relationships described above
and presented in the results between our dataset and the
other datasets are confirmed at a pathway level and suggest
that oxidoreductase activity and electron transporter activity
are among the important molecular functions of the
bronchial epithelium that are regulated in response to a wide
range of carcinogenic, inflammatory, and toxic exposures.
As an additional validation of the gene changes observed in
response to smoking and smoking cessation, we developed a
biomarker of tobacco smoke exposure. Using genes irreversi-
bly altered by cigarette smoke, we were able to classify an
independent sample set of former and current smokers
(GSE4115) and a sample set of smokers and non-smokers
(GSE5372) with high accuracy. Other datasets examining
additional inhaled toxins (for example, ozone or fumes from
charcoal stoves) are needed to determine if the persistent
genomic changes we have identified are tobacco smoke spe-
cific. However, our preliminary biomarker results demon-
strate the potential for developing a useful epidemiological
Table 2
EASE analysis results
System Category EASE score Permutation P value Reversibility group
GO molecular function Oxidoreductase activity 8.49E-08 1.00E-03 Rapidly reversible genes
GO molecular function Electron transporter activity 4.60E-06 1.00E-03 Rapidly reversible genes
GenMAPP pathway Homo sapienspentose phosphate pathway 8.59E-06 1.00E-03 Rapidly reversible genes
GO molecular function Oxidoreductase activity, acting on the CH-OH group of
donors, NAD or NADP as acceptor
5.73E-05 2.00E-03 Rapidly reversible genes
GO molecular function Oxidoreductase activity, acting on CH-OH group of
donors
7.59E-05 2.00E-03 Rapidly reversible genes
KEGG Pathway Carbohydrate metabolism - Homo sapiens 1.71E-04 4.00E-03 Rapidly reversible genes
Chromosomal location 16q13 2.02E-03 1.00E-03 Slowly reversible and
irreversible genes
EASE was used to identify GO molecular function categories, KEGG pathways, GenMAPP pathways, and chromosomal locations over-represented
(Permutation P ≤ 0.01) among genes designated as slowly reversible and irreversible or rapidly reversible compared to all annotated genes on the
Affymetrix U133A microarray.
Genome Biology 2007, Volume 8, Issue 9, Article R201 Beane et al. R201.11
comment reviews reports refereed researchdeposited research interactions information
Genome Biology 2007, 8:R201
tool if the gene expression biomarker could be ultimately
extended to less invasive sites, such as the buccal and nasal
epithelium, as these are tissues that are also directly exposed
to tobacco smoke. Biomarkers of exposure are frequently
used to improve upon or validate information about tobacco
smoke exposure obtained by questionnaire; however, current
biomarkers of tobacco exposure (for example, cotinine [45]
and NNAL, a metabolite of the tobacco-specific nitrosamine
NNK [46,47]) are limited to detecting recent exposure. Devel-
opment of a biomarker for long-term past exposure using
gene expression could have widespread epidemiological
utility. We are further interested to determine if there is suf-
ficient similarity in the gene expression differences caused by
distant and low-level tobacco smoke exposure such that a
biomarker of past exposure could also detect current or past
passive smoke exposure.
Conclusion
We have, for the first time, categorized smoking-related
changes in airway gene expression by their degree of
reversibility upon smoking cessation, which begins to provide
insights into the mechanisms leading to persistent gene
expression changes in the airway epithelium exposed to
tobacco smoke. Further understanding of these mechanisms
may aid in understanding why former smokers remain at risk
for developing lung cancer years after quitting smoking and
perhaps aid in developing treatments to lower this risk. In
addition, a biomarker of past tobacco smoke exposure based
on the expression of the genes that do not return to baseline
levels after smoking cessation has the potential to provide a
useful tool for epidemiological studies.
Materials and methods
Patient population
We obtained airway epithelial brushings from never, current,
and former smokers undergoing fiberoptic bronchoscopy
between April 2003 and January 2006 (n = 281 samples,
including replicates (n = 12)). Subjects with lung cancer or
unknown lung cancer status were excluded from the analyses
(n = 119). Demographics, including age, pack years, and
months since quitting smoking, were obtained from each sub-
ject. The subjects were recruited from four institutions: Bos-
ton University Medical Center, Boston, MA; Boston Veterans
Administration, West Roxbury, MA; Lahey Clinic, Burling-
ton, MA; and St James's Hospital, Dublin, Ireland. The Insti-
tutional Review Boards of all of the medical centers approved
Table 3
Two group comparisons examined for each of the GEO datasets
Dataset Condition 1 Condition 2 No. of samples in
condition 1
No. of samples in
condition 2
Significant dataset
GSE3320 Non smokers Smokers 5 6 *
GSE2302 Control Smoke 15 min, 24 hr recovery 9 5 **
GSE2302 Control Smoke 15 min, 4 and 24 hr recovery 9 9 *
GSE2302 Control Smoke 15 min, 4 hr recovery 9 4 **
GSE1276 Untreated, 2 and 4 h S9+CSCA/
CSCB
8 and 12 h S9+CSCA/CSCB 10 8 *
GSE1276 S9 2, 4, 8 and 12 h S9+CSCA 2, 4, 8, 12 h 8 8
GSE1276 S9 2, 4, 8 and 12 h S9+CSCB 2, 4, 8, 12 h 8 8
GSE1815 Untreated 8 and 24 h INF-gamma treated 24 h 9 5 **
GSE1815 Untreated 8 and 24 h INF-gamma treated 8 and 24 h 9 9 *
GSE2111 Control Zinc sulfate 4 4 *
GSE2111 Control Vanadium 4 4
GSE5264 Days 0 through 8 Days 10 through 28 14 16 *
GSE620 Control 4-PBA 12 and 24 h 5 6 *
GSE620 Control 4-PBA 24 h 5 3 **
GSE3397 Control RSV 24 h 4 4
GSE3397 Control RSV 4 and 24 h 4 8 *
GSE3183 Control IL13 4, 12, and 24 h 6 9
GSE3183 Control IL13 24 h 6 3
GSE3183 Control + IL13 4 h IL13 12 and 24 h 9 6 *
GSE3004 Pre-allergen challenge Post-allergen challenge 5 5
The GEO series accessions as well as the description and numbers of samples in each of the conditions are listed for each comparison. Datasets
where genes differentially expressed between condition 1 and condition 2 demonstrated similarity to genes differentially expressed between current
and never smokers in our dataset are indicated by the presence of one or two asterisks. Only comparisons indicated by a single asterisk are shown
in Figure 5. S9, rat S9 microsomal fraction; CSC, cigarette smoke condensate; INF-gamma, interferon gamma; 4-PBA, 4-phenylbutyrate; RSV,
respiratory syncytial virus; IL13, interleukin 13.
R201.12 Genome Biology 2007, Volume 8, Issue 9, Article R201 Beane et al. />Genome Biology 2007, 8:R201
Similarities and differences between our dataset and other bronchial airway datasetsFigure 5
Similarities and differences between our dataset and other bronchial airway datasets. (a) GSEA was used to determine if there was a gene expression
relationship between other airway datasets (see Table 3 for a description of conditions 1 and 2) and our dataset based on the genes we identified to be
regulated by smoking. The normalized enrichment score is plotted for datasets that had a FDR < 0.25. (b) Gene lists derived from functional categories
and chromosomal locations found to be over-represented by EASE analysis in our dataset were tested for enrichment in our dataset and the other ten
datasets using GSEA. A false-color heatmap of the positive (red) and negative (blue) normalized enrichment scores (with a FDR < 0.25) is shown for each
category. An asterisk indicates the results passed a stricter FDR < 0.05. The nine datasets and conditions that yielded significant results in either (a) or (b)
are indicated in Table 3 by the presence of a single asterisk.
-4
-3
-2
-1
0
1
2
3
4
Normalized Enrichment Score (NES)
Enrichment of Genes
Up-regulated in
Condition 2
Enrichment of Genes
Up-regulated in
Condition 1
Genes Down-regulated in Smokers (FDR<=0.05)
Genes Up-regulated in Smokers (FDR<=0.05)
Legend:
(a)
Positive NES (Up-regulated Condition 2)
Negative NES (Up-regulated Condition 1)
(b)
Legend:
GEO Series
GSE3320 GSE2302 GSE1276 GSE3397 GSE5264 GSE620 GSE1815 GSE2111
Smoke Exposure Other Exposure
GSE3183
Large Airway
GSE3320
GSE2302
GSE1276
GSE5264
GSE620
GSE1815
GSE3183
Cytoband 16q13
Homo sapiens Pentose Phosphate Pathway
Carbohydrate Metabolism − Homo sapiens
Electron transporter activity
Oxidoreductase activity, acting on CH−OH group of donors, NAD or NADP as acceptor
Oxidoreductase activity, acting on CH−OH group of donors
Oxidoreductase activity
*
*
*
*
*
*
Genes Down-regulated in Smokers (FDR<=0.25)
Genes Up-regulated in Smokers (FDR<=0.25)
*
*
*
*
*
*
*
*
*
*
*
*
*
*
*
Genome Biology 2007, Volume 8, Issue 9, Article R201 Beane et al. R201.13
comment reviews reports refereed researchdeposited research interactions information
Genome Biology 2007, 8:R201
the study and all subjects provide written informed consent.
With the exception of nine samples, all samples used in the
analyses were included in studies previously published by our
group [15,26,48] (Additional data file 4).
Airway epithelial cell collection
Bronchial airway epithelial cells were obtained from the right
mainstem bronchus with an endoscopic cytobrush (Cellebrity
Endoscopic Cytobrush, Boston Scientific, Boston, MA, USA).
RNA was isolated and its integrity and epithelial cell content
was confirmed as described previously [26].
Microarray data acquisition
We processed, labeled and hybridized 6-8 μg of total RNA to
Affymetrix HG-U133A GeneChips containing 22,283
probesets as described previously [15]. We obtained log
2
-nor-
malized probe-level data using the GCRMA algorithm [49]
because it maximized the correlation between technical repli-
cates compared to the Microarray Suite 5.0 algorithm and
performed equivalently to a similar method, RMA (robust
multichip average) [50] (Additional data file 3). All 281 sam-
ples (including replicates) collected during the study period
were used for sample filtering. A z-score filter was applied to
filter out arrays of poor quality. The filter involves computing
an average z-score statistic across all probesets for each sam-
ple using z-score normalized data so that the mean gene
expression value across all samples for each probeset is 0 and
the standard deviation is 1 [26]. Samples with high average z-
scores were eliminated in addition to the 119 samples with
lung cancer or unknown lung cancer status, leaving 104 sam-
ples - 21 never smokers without cancer (N), 31 former smok-
ers without cancer (F), and 52 current smokers without
cancer (C). The data can be accessed through GEO accession
GSE7895.
Modeling the effect of smoking and smoking cessation
Linear regression models were used to identify genes differ-
entially expressed as a function of tobacco smoke exposure.
These genes were further analyzed to describe gene expres-
sion changes upon smoking cessation. For each probeset, the
relationship between gene expression in log
2
scale (ge), age,
current smoking status (x
curr
= 1 for current smokers and 0
otherwise), former smoking status (x
form
= 1 for former smok-
ers and 0 otherwise), and the interaction between former
smoking status and months elapsed since quitting smoke (x
tq
)
was examined with the linear regression model:
ge
i
=
β
0
+
β
age
* x
age
+
β
curr
* x
curr
+
β
form
* x
form
+
β
form.tg
* x
form
* x
tq
+
ε
i
(1)
where ε
i
represents the error that we assumed was normally
distributed. The equation describes the expression of a probe
i for never and current smokers as:
Never Smoker: ge
i
=
β
0
+
β
age
* x
age
+
ε
i
(2)
Current Smoker: ge
i
=
β
0
+
β
age
* x
age
+
β
curr
* 1 +
ε
i
(3)
Age was included in the model to control for the potentially
confounding effects of age and smoking status (Table 1). By
difference, the age-adjusted fold change between current and
never smokers is 2^β
curr
. The standard least-square method
was used to estimate the regression coefficients, and the sig-
nificance of the regression coefficients was tested using the t-
test. Goodness of fit of the models was assessed by analysis of
residuals.
Probesets differentially expressed between current and never
smokers were defined by two requirements. First, a q-value
[51] for the regression coefficient β
curr
< 0.05 (which corre-
sponded to P < 7.6 × 10
-4
). The q-value is the expected propor-
tion of false positives incurred when calling probesets with
this q-value or smaller significant and was used to correct for
multiple comparisons. Second, an absolute value of the β
curr
coefficient >0.584, which corresponds to an age-adjusted fold
change of expression >1.5. A fold change cutoff was chosen
because of the little power provided by our sample size to
detect smaller changes using multivariate linear regression
models [52]. After the q-value and fold change criteria were
Table 4
Biomarker of tobacco smoke exposure constructed using the 28 irreversible genes
Training set Test set GSE4115 GSE5372
Never Former All Current Former Current All Non-smokers Smokers All
Number Classified Correctly 21 31 52 46 38 38 76 4 4 8
Total Number 21 31 52 52 47 38 85 4 5 9
Accuracy 100.0% 100.0% 100.0% 88.5% 80.9% 100.0% 89.4% 100.0% 80.0% 88.9%
Mean of Random sets 52.5% 59.2% 59.2% 50.1%
P value 0 0.102 0.013 0.001
The accuracy of the biomarker is reported for the training set samples, test set samples, samples from dataset GSE4115 that do not overlap with the
present study, and samples from GSE5372. The P values represent the proportion of 1,000 random training sets that have the same or better
accuracy on the tested samples as the actual biomarker.
R201.14 Genome Biology 2007, Volume 8, Issue 9, Article R201 Beane et al. />Genome Biology 2007, 8:R201
applied, probesets with the same gene symbol (according to
the June 2006 HG-U133A Affymetrix annotation files), were
filtered such that only the probeset with the lowest q-value
was retained. All probesets without gene symbol annotation,
however, were included.
The behavior of the probesets selected in the first comparison
was further analyzed in former smokers. The linear model
shown in equation 1 describes the expression of a probe i in
former smokers as:
Former Smoker: ge
i
=
β
0
+
β
age
* x
age
+
β
form
* 1 +
β
form.tq
* 1 * x
tq
+
ε
i
(4)
and allows us to further classify probes based on the pattern
of expression in former smokers as a function of time since
quitting smoking with respect to never smokers (Figure 1).
From equation 4, we see that the expression of a probeset in a
former smoker differs from that of a never smoker if the
regression coefficient β
form
is significantly different from 0.
The difference can be unrelated to time elapsed since quitting
if the regression coefficient β
form.tq
is not significantly differ-
ent from 0, or it can change over time if β
form.tq
is significantly
different from 0. In the latter case, when the changes over
time are monotone, we can identify the time point at which
the fold change was equal to 1.5 (|
β
form
+
β
form.tq
* x
form
* x
tq
| =
0.584). This led us to the following definitions. First, a gene
was defined as 'rapidly reversible' if the regression coefficient
β
form
was not significantly different from 0 (P = 0.001). Sec-
ond, a gene was defined as 'irreversible' if the regression coef-
ficient β
form.tq
was not significantly different from 0 (P = 0.01),
but the β
form
coefficient was significantly different from 0 (P <
0.001) and the absolute β
form
coefficient was >0.584 (corre-
sponding to an age-adjusted fold change between formers
and never smokers >1.5). Third, a gene was defined as 'inde-
terminate' if the regression coefficient β
form.tq
was not signifi-
cantly different from 0 (P = 0.01), but the β
form
coefficient was
significantly different from 0 (P < 0.001) and the absolute
β
form
coefficient ≤0.584. Fourth, a gene was defined as 'slowly
reversible' if the regression coefficients β
form
and β
form.tq
were
significantly different from 0 (P < 0.001, and P < 0.01, respec-
tively) and the absolute β
form
coefficient >0.584. The genes
were characterized by the time point (tq) where |
β
form
+
β
form.tq
* x
form
* x
tq
| = 0.584. This corresponds to the time
point where the age-adjusted fold change of never versus
former smokers was equal to 1.5 (since all genes classified as
slowly reversible were down-regulated by smoking).
In addition, to characterize the range of reversibility among
genes designated as rapidly reversible, the percent reversibil-
ity for each gene was calculated according to the formula:
. In rare cases where the former smoker versus
never smoker fold change was slightly higher than the current
versus never smoker fold change, the percentage was set to
100%; and in cases where the former smokers expression lev-
els returned to a slightly lower level than never smokers, the
percentage was set at 0%. The reversible genes were divided
into tertiles based on this reversibility percentage.
Relationship of irreversible and reversible genes to
other bronchial epithelial cell datasets
NCBI's microarray data repository, GEO [53], was queried for
human bronchial epithelial cell samples in August 2006.
Processed data were downloaded from GEO for each dataset
(ten datasets total) that contained more than three total sam-
ples, contained more than two total samples per condition,
and that was processed using whole genome arrays (Addi-
tional data file 2). The 175 genes differentially expressed
between current and never smokers were mapped to the var-
ious datasets. PCAs were performed for each dataset across
the mapped probesets using z-score normalized data. Graphs
of the first versus second principal component were used as
guides to decide what groups of samples show differential
expression of the genes we identified as being differentially
expressed between current and never smokers (data not
shown).
The relationship was subsequently defined quantitatively
using GSEA [44] (available through the GenePattern software
[54]). The samples in each dataset from above were divided
into two groups based on the experimental design - control
versus the treated samples. If the samples were treated at two
different time points, however, the time points were either
combined into one treated group or kept separate for differ-
ent comparisons between the control and the treated group at
a particular time point (the PCAs from above were used to
guide these decisions; Table 3). For each comparison, the
probesets were mapped to gene symbols using GSEA's
Affymetrix annotation files; or, in the case of the two non-
Affymetrix arrays (datasets GSE2302 and GSE1276), the
annotation file human-library.txt [55] was used. The redun-
dant gene symbols were collapsed using a script written in the
R Language for Statistical Computing [56] that retained the
probesets with the highest absolute signal to noise ratio. This
strategy was chosen so that all potentially differentially
expressed genes were included in the analyses. The collapsed
datasets were evaluated using GSEA to determine if the gene
sets listed below were also differentially expressed in the
datasets by the signal to noise statistic comparing treatment
versus control. The following gene sets were tested: slowly
reversible and irreversible genes up-regulated by smoking;
slowly reversible and irreversible genes down-regulated by
smoking; rapidly reversible genes up-regulated by smoking;
rapidly reversible genes down-regulated by smoking; all
genes up-regulated by smoking; all genes down-regulated by
smoking. Significant enrichment was defined as a p value <
0.05 and a FDR < 0.25 derived using 10,000 gene-label
permutations.
1
2
2
−
β
β
form
curr
Genome Biology 2007, Volume 8, Issue 9, Article R201 Beane et al. R201.15
comment reviews reports refereed researchdeposited research interactions information
Genome Biology 2007, 8:R201
Identifying common biological themes across datasets
EASE [16] was used to identify GO molecular function catego-
ries, KEGG pathways, GenMAPP pathways, and chromo-
somal cytobands over-represented among genes designated
as slowly reversible and irreversible or reversible compared to
all annotated genes on the Affymetrix U133A microarray
(Permutation P ≤ 0.01). GSEA was subsequently performed
using gene lists derived from each significant EASE category
to identify which of these over-represented categories were
enriched in genes up- or down-regulated in each GEO dataset
(Table 3). The enrichment of EASE categories observed in our
dataset was confirmed using GSEA in which the β
curr
smoking
status coefficient (representing the magnitude of the differ-
ence between current and never smokers) was used to order
the probesets.
Biomarker for past smoke exposure
A biomarker of past exposure using the irreversible genes (n
= 28) was trained on the never and former smokers using a
SVM classification system with a linear kernel via the R pack-
age e1071 [57]. The SVM model was tested on the training set
and three different test sets - the current smokers in the
present study, current and former smokers that were not
included in the present study from dataset GSE4511 previ-
ously published by our group, and GSE5372, which included
gene expression measurement from large airway epithelial
cells in 4 non-smokers and 5 current smokers at different
time points (22 samples total) [58]. The biomarker was used
to predict the class of the GSE5372 samples taken at the initial
time point (n = 9). P values for the performance of the
biomarker were established by randomizing the class labels of
the training set, re-running the algorithm 1,000 times, and
calculating the proportion of the random runs that produced
biomarkers that had the same or better accuracy in the test set
samples.
Quantitative real time PCR
Quantitative RT-PCR analysis was used to confirm the differ-
ential expression of two irreversible and two rapidly reversi-
ble genes known to play roles in the detoxification of tobacco
smoke and pathogenesis of lung cancer. Primer sequences for
the four genes (ALDH3A1, CEACAM5, CYP1B1, and NQO1)
were designed with PRIMER EXPRESS software (Applied
Biosystems, Foster City, CA)) (Additional data file 5). Primer
sequences of the housekeeping gene GAPDH were adopted
from Vandesompele et al. [59]. RNA samples (1 μg of residual
RNA from the samples used in the microarray analysis) were
treated with DNAfree (Ambion, Foster City, CA), according to
the manufacturer's protocol, to remove contaminating
genomic DNA. Total RNA was reverse-transcribed by using
random hexamers (Applied Biosystems) and SuperScript II
reverse transcriptase (Invitrogen, Carlsbad, CA). The result-
ing first-strand cDNA was diluted with nuclease-free water
(Ambion) to 4 ng/μl. PCR amplification mixtures (25 μl) con-
tained 20 ng template cDNA, 12.5 μl of 2× SYBR Green PCR
master mix (Applied Biosystems) and 300 nM forward and
reverse primers. Forty cycles of amplification and data acqui-
sition were carried out in an ABI Prism 7700 Sequence Detec-
tor (Applied Biosystems). Threshold determinations were
automatically performed by Sequence Detection Software
(version 1.9.1; Applied Biosystems) for each reaction. All real-
time PCR experiments were carried out in triplicate on each
sample (mean of the triplicate shown). Four never, 3 former,
and 2 current smokers were chosen for each gene based on
the amount of RNA available (17 samples total: 6 current, 7
former, and 1 never smoker from this study and 3 additional
never smokers collected prospectively).
Statistical analysis
All statistical analyses and hierarchical clustering were con-
ducted using R statistical software v 2.2.1 and Bioconductor
packages [60].
Abbreviations
FDR, false discovery rate; GEO, Gene Expression Omnibus;
GO, gene ontology; GSEA, gene set enrichment analysis;
NNK, nicotine-derived nitrosamino-ketone; PCA, principal
component analysis; RMA, robust multichip average; SVM,
support vector machine; 4-PBA, 4-phenylbutyrate.
Authors' contributions
AS, MEL, PS and JB conceptualized and designed the study.
AS oversaw patient recruitment, sample acquisition and
experimental protocols. MEL, PS and JB contributed to the
design of the analytic strategy. JB performed the statistical
and computational analyses, interpreted the results, and
wrote the manuscript. AS, MEL, PS and JSB supervised the
analyses and edited the manuscript. GL performed quantita-
tive RT-PCR and was responsible for QRT-PCR data analysis.
AS and JSB supported the work.
Additional data files
The following additional data are available with the online
version of this paper. Additional data file 1 lists classifications
of genes differentially expressed between current and never
smokers according to their behavior in former smokers. For
each gene the following information is given: the Affymetrix
identification, the HUGO gene symbol, the direction of the
change (up- or down-regulated in current smokers with
respect to never smokers), the gene classification based on
behavior of former smokers, and the percent reversibility.
Additional data file 2 provides a Summary of human bron-
chial epithelial datasets downloaded from GEO. For each
dataset the following information is included: GEO series
identification, microarray platform, cell type, where the cells
were obtained, cell donor information (if applicable), number
of samples, experiment type, exposure, experiment descrip-
tion, data preprocessing, and PUBMED identification (if
applicable). Additional data file 3 shows that GCRMA and
R201.16 Genome Biology 2007, Volume 8, Issue 9, Article R201 Beane et al. />Genome Biology 2007, 8:R201
RMA maximize the correlation between replicate samples.
Average Pearson correlations between seven pairs of replicate
samples where probeset gene expression values were deter-
mined using Microarray Suite 5.0 (MAS 5.0), log-trans-
formed data from Microarray Suite 5.0 (Log
2
MAS 5.0), and
RMA. The average, standard deviation, and median of the
correlation coefficients are shown. Additional data file 4 gives
GEO identifications for never, former, and current smokers.
This file explains how the samples used in the present study
overlap with previous publications. GEO identifications are
provided for each sample for the present study and for the
previously published studies (each study used different data
preprocessing). GEO identification 1 refers to the study pub-
lished in [15] (15210990), GEO identification 2 refers to the
study published in [27] (17334370), and GEO identification 3
refers to the present study. The study published in [48]
(15608264) did not have an accompanying GEO submission.
Additional data file 5 lists the quantitative real time PCR
primer sequences. Primer sequences for the four candidate
genes (ALDH3A1, CEACAM5, CYP1B1, and NQO1) designed
with PRIMER EXPRESS software (Applied Biosystems), and
the primer sequences of the housekeeping gene GAPDH
adopted from Vandesompele et al. [59].
Additional data file 1Classifications of genes differentially expressed between current and never smokers according to their behavior in former smokersFor each gene the following information is given: the Affymetrix identification, the HUGO gene symbol, the direction of the change (up- or down-regulated in current smokers with respect to never smokers), the gene classification based on behavior of former smokers, and the percent reversibility.Click here for fileAdditional data file 2Summary of human bronchial epithelial datasets downloaded from GEOFor each dataset the following information is included: GEO series identification, microarray platform, cell type, where the cells were obtained, cell donor information (if applicable), number of sam-ples, experiment type, exposure, experiment description, data pre-processing, and PUBMED identification (if applicable).Click here for fileAdditional data file 3GCRMA and RMA maximize the correlation between replicate samplesAverage Pearson correlations between seven pairs of replicate sam-ples where probeset gene expression values were determined using Microarray Suite 5.0 (MAS 5.0), log-transformed data from Micro-array Suite 5.0 (Log
2
MAS 5.0), and RMA. The average, standard deviation, and median of the correlation coefficients are shown.Click here for fileAdditional data file 4GEO identifications for never, former, and current smokersThis file explains how the samples used in the present study overlap with previous publications. GEO identifications are provided for each sample for the present study and for the previously published studies (each study used different data preprocessing). GEO iden-tification 1 refers to the study published in [15] (15210990), GEO identification 2 refers to the study published in [27] (17334370), and GEO identification 3 refers to the present study. The study published in [48] (15608264) did not have an accompanying GEO submission.Click here for fileAdditional data file 5Quantitative real time PCR primer sequencesPrimer sequences for the four candidate genes (ALDH3A1, CEACAM5, CYP1B1, and NQO1) designed with PRIMER EXPRESS software (Applied Biosystems), and the primer sequences of the housekeeping gene GAPDH adopted from Vandesompele et al. [59].Click here for file
Acknowledgements
We thank Xuemei Yang, Sherry Zhang, Katrina Steiling, Frank Schembri,
Martine Dumas and Norman Gerry for support with collection of samples
and performing the microarray experiments. This work was supported by
the Doris Duke Charitable Foundation (AS), NIH/NCI R21CA10650 (AS),
NIH/NCI R01CA124640 (AS, MEL, and JB), and the National Institute of
Environmental Health Sciences (NIEHS)/NIH U01 ES016035.
References
1. Annual smoking-attributable mortality, years of potential
life lost, and economic costs - United States, 1995-1999.
MMWR Morb Mortal Wkly Rep 2002, 51:300-303.
2. Cigarette smoking among adults - United States, 2003.
MMWR Morb Mortal Wkly Rep 2005, 54:509-513.
3. Halpern MT, Gillespie BW, Warner KE: Patterns of absolute risk
of lung cancer mortality in former smokers. J Natl Cancer Inst
1993, 85:457-464.
4. Changes in Cigarette-Related Disease Risks andTheir Impli-
cations for Prevention and Control. In Monograph No. 8[NIH
Publ No 97-4213], 9-10 Edited by: Shopland DR, Burns DM, Garfinkel
L, Samet JM. USDHHS, National Institutes of Health, National Cancer
Institute; 2007. Ref Type: Serial (Book, Monograph)
5. Ebbert JO, Yang P, Vachon CM, Vierkant RA, Cerhan JR, Folsom AR,
Sellers TA: Lung cancer risk reduction after smoking cessa-
tion: observations from a prospective cohort of women. J Clin
Oncol 2003, 21:921-926.
6. Burns DM: Primary prevention, smoking, and smoking cessa-
tion: implications for future trends in lung cancer
prevention. Cancer 2000, 89:2506-2509.
7. Powell CA, Klares S, O'Connor G, Brody JS: Loss of heterozygos-
ity in epithelial cells obtained by bronchial brushing: clinical
utility in lung cancer. Clin Cancer Res 1999, 5:2025-2034.
8. Wistuba II, Lam S, Behrens C, Virmani AK, Fong KM, LeRiche J, Samet
JM, Srivastava S, Minna JD, Gazdar AF: Molecular damage in the
bronchial epithelium of current and former smokers. J Natl
Cancer Inst 1997, 89:1366-1373.
9. Mao L, Lee JS, Kurie JM, Fan YH, Lippman SM, Lee JJ, Ro JY, Broxson
A, Yu R, Morice RC, et al.: Clonal genetic alterations in the lungs
of current and former smokers. J Natl Cancer Inst 1997,
89:857-862.
10. Franklin WA, Gazdar AF, Haney J, Wistuba II, La Rosa FG, Kennedy
T, Ritchey DM, Miller YE: Widely dispersed p53 mutation in res-
piratory epithelium. A novel mechanism for field
carcinogenesis.
J Clin Invest 1997, 100:2133-2137.
11. Wistuba II, Mao L, Gazdar AF: Smoking molecular damage in
bronchial epithelium. Oncogene 2002, 21:7298-7306.
12. Guo M, House MG, Hooker C, Han Y, Heath E, Gabrielson E, Yang
SC, Baylin SB, Herman JG, Brock MV: Promoter hypermethyla-
tion of resected bronchial margins: a field defect of changes?
Clin Cancer Res 2004, 10:5131-5136.
13. Miyazu YM, Miyazawa T, Hiyama K, Kurimoto N, Iwamoto Y, Matsu-
ura H, Kanoh K, Kohno N, Nishiyama M, Hiyama E: Telomerase
expression in noncancerous bronchial epithelia is a possible
marker of early development of lung cancer. Cancer Res 2005,
65:9623-9627.
14. Yashima K, Litzky LA, Kaiser L, Rogers T, Lam S, Wistuba II, Milchgrub
S, Srivastava S, Piatyszek MA, Shay JW, et al.: Telomerase expres-
sion in respiratory epithelium during the multistage patho-
genesis of lung carcinomas. Cancer Res 1997, 57:2373-2377.
15. Spira A, Beane J, Shah V, Liu G, Schembri F, Yang X, Palma J, Brody JS:
Effects of cigarette smoke on the human airway epithelial
cell transcriptome. Proc Natl Acad Sci USA 2004, 101:10143-10148.
16. Hosack DA, Dennis G Jr, Sherman BT, Lane HC, Lempicki RA: Iden-
tifying biological themes within lists of genes with EASE.
Genome Biol 2003, 4:R70.
17. Harris MA, Clark J, Ireland A, Lomax J, Ashburner M, Foulger R, Eil-
beck K, Lewis S, Marshall B, Mungall C, et al.: The Gene Ontology
(GO) database and informatics resource. Nucleic Acids Res
2004, 32:D258-D261.
18. Kanehisa M, Goto S, Kawashima S, Nakaya A: The KEGG data-
bases at GenomeNet. Nucleic Acids Res 2002, 30:42-46.
19. Dahlquist KD, Salomonis N, Vranizan K, Lawlor SC, Conklin BR:
GenMAPP, a new tool for viewing and analyzing microarray
data on biological pathways. Nat Genet 2002, 31:19-20.
20. Golub TR, Slonim DK, Tamayo P, Huard C, Gaasenbeek M, Mesirov
JP, Coller H, Loh ML, Downing JR, Caligiuri MA, et al.: Molecular
classification of cancer: class discovery and class prediction
by gene expression monitoring. Science 1999, 286:531-537.
21. Hackett NR, Heguy A, Harvey BG, O'Connor TP, Luettich K, Flieder
DB, Kaplan R, Crystal RG: Variability of antioxidant-related
gene expression in the airway epithelium of cigarette
smokers. Am J Respir Cell Mol Biol 2003, 29:331-343.
22. Jorgensen ED, Dozmorov I, Frank MB, Centola M, Albino AP: Global
gene expression analysis of human bronchial epithelial cells
treated with tobacco condensates. Cell Cycle 2004, 3:1154-1168.
23. Pawliczak R, Logun C, Madara P, Barb J, Suffredini AF, Munson PJ,
Danner RL, Shelhamer JH: Influence of IFN-gamma on gene
expression in normal human bronchial epithelial cells: mod-
ulation of IFN-gamma effects by dexamethasone. Physiol
Genomics 2005, 23:28-45.
24. Ross AJ, Dailey LA, Brighton LE, Devlin RB: Transcriptional Profil-
ing of Mucociliary Differentiation in Human Airway Epithe-
lial Cells. Am J Respir Cell Mol Biol 2007.
25. Li Z, Stonehuerner J, Devlin RB, Huang YC: Discrimination of
vanadium from zinc using gene profiling in human bronchial
epithelial cells. Environ Health Perspect 2005, 113:1747-1754.
26. Spira A, Beane JE, Shah V, Steiling K, Liu G, Schembri F, Gilman S,
Dumas YM, Calner P, Sebastiani P, et al.: Airway epithelial gene
expression in the diagnostic evaluation of smokers with sus-
pect lung cancer. Nat Med 2007.
27. Nagaraj NS, Beckers S, Mensah JK, Waigel S, Vigneswaran N, Zach-
arias W: Cigarette smoke condensate induces cytochromes
P450 and aldo-keto reductases in oral cancer cells. Toxicol Lett
2006, 165:182-194.
28. Wenzlaff AS, Cote ML, Bock CH, Land SJ, Santer SK, Schwartz DR,
Schwartz AG: CYP1A1 and CYP1B1 polymorphisms and risk
of lung cancer among never smokers: a population-based
study. Carcinogenesis 2005, 26:2207-2212.
29. Jin Y, Penning TM: Aldo-keto reductases and bioactivation/
detoxication. Annu Rev Pharmacol Toxicol 2007, 47:
263-292.
30. Vasiliou V, Nebert DW: Analysis and update of the human alde-
hyde dehydrogenase (ALDH) gene family. Hum Genomics 2005,
2:138-143.
31. Gebel S, Gerstmayer B, Bosio A, Haussmann HJ, Van Miert E, Muller
T: Gene expression profiling in respiratory tissues from rats
exposed to mainstream cigarette smoke. Carcinogenesis 2004,
25:169-178.
32. Woenckhaus M, Klein-Hitpass L, Grepmeier U, Merk J, Pfeifer M,
Wild P, Bettstetter M, Wuensch P, Blaszyk H, Hartmann A, et al.:
Genome Biology 2007, Volume 8, Issue 9, Article R201 Beane et al. R201.17
comment reviews reports refereed researchdeposited research interactions information
Genome Biology 2007, 8:R201
Smoking and cancer-related gene expression in bronchial
epithelium and non-small-cell lung cancers. J Pathol 2006,
210:192-204.
33. Hotta K, Segawa Y, Takigawa N, Kishino D, Saeki H, Nakata M, Man-
dai K, Eguchi K: Evaluation of the relationship between serum
carcinoembryonic antigen level and treatment outcome in
surgically resected clinical-stage I patients with non-small-
cell lung cancer. Anticancer Res 2000, 20:2177-2180.
34. Goldstein MJ, Mitchell EP: Carcinoembryonic antigen in the
staging and follow-up of patients with colorectal cancer. Can-
cer Invest 2005, 23:338-351.
35. Lai J, Chien J, Staub J, Avula R, Greene EL, Matthews TA, Smith DI,
Kaufmann SH, Roberts LR, Shridhar V: Loss of HSulf-1 up-regu-
lates heparin-binding growth factor signaling in cancer. J Biol
Chem 2003, 278:23107-23117.
36. Lai JP, Chien J, Strome SE, Staub J, Montoya DP, Greene EL, Smith DI,
Roberts LR, Shridhar V: HSulf-1 modulates HGF-mediated
tumor cell invasion and signaling in head and neck squamous
carcinoma. Oncogene 2004, 23:1439-1447.
37. Yu J, Lin JH, Wu XR, Sun TT: Uroplakins Ia and Ib, two major dif-
ferentiation products of bladder epithelium, belong to a fam-
ily of four transmembrane domain (4TM) proteins. J Cell Biol
1994, 125:171-182.
38. Varga AE, Leonardos L, Jackson P, Marreiros A, Cowled PA: Methyl-
ation of a CpG island within the uroplakin Ib promoter: a
possible mechanism for loss of uroplakin Ib expression in
bladder carcinoma. Neoplasia 2004, 6:128-135.
39. Cowled P, Kanter I, Leonardos L, Jackson P: Uroplakin Ib gene
transcription in urothelial tumor cells is regulated by CpG
methylation. Neoplasia 2005, 7:1091-1103.
40. Cherian MG, Jayasurya A, Bay BH: Metallothioneins in human
tumors and potential roles in carcinogenesis. Mutat Res 2003,
533:201-209.
41. Zhong S, Fields CR, Su N, Pan YX, Robertson KD: Pharmacologic
inhibition of epigenetic modifications, coupled with gene
expression profiling, reveals novel targets of aberrant DNA
methylation and histone deacetylation in lung cancer.
Onco-
gene 2006.
42. Meplan C, Richard MJ, Hainaut P: Metalloregulation of the tumor
suppressor protein p53: zinc mediates the renaturation of
p53 after exposure to metal chelators in vitro and in intact
cells. Oncogene 2000, 19:5227-5236.
43. Evsikov AV, Solter D: Comment on " 'Stemness': transcrip-
tional profiling of embryonic and adult stem cells" and "a
stem cell molecular signature". Science 2003, 302:393.
44. Subramanian A, Tamayo P, Mootha VK, Mukherjee S, Ebert BL, Gil-
lette MA, Paulovich A, Pomeroy SL, Golub TR, Lander ES, et al.: Gene
set enrichment analysis: a knowledge-based approach for
interpreting genome-wide expression profiles. Proc Natl Acad
Sci USA 2005, 102:15545-15550.
45. SRNT Subcommittee on Biochemical Verification: Biochemical ver-
ification of tobacco use and cessation. Nicotine Tob Res 2002,
4:149-159.
46. Hecht SS, Carmella SG, Chen M, Dor Koch JF, Miller AT, Murphy SE,
Jensen JA, Zimmerman CL, Hatsukami DK: Quantitation of uri-
nary metabolites of a tobacco-specific lung carcinogen after
smoking cessation. Cancer Res 1999, 59:590-596.
47. Hecht SS, Murphy SE, Carmella SG, Zimmerman CL, Losey L, Kra-
marczuk I, Roe MR, Puumala SS, Li YS, Le C, et al.: Effects of
reduced cigarette smoking on the uptake of a tobacco-spe-
cific lung carcinogen. J Natl Cancer Inst 2004, 96:107-115.
48. Shah V, Sridhar S, Beane J, Brody JS, Spira A: SIEGE: Smoking
Induced Epithelial Gene Expression Database. Nucleic Acids
Res 2005, 33:D573-D579.
49. Wu Z, IRAGRM-MFSF: A Model Based Background Adjustment
for Oligonucleotide Expression Arrays. The Journal of the Amer-
ican Statistical Association 2004, 99:909-917.
50. Irizarry RA, Hobbs B, Collin F, Beazer-Barclay YD, Antonellis KJ,
Scherf U, Speed TP: Exploration, normalization, and summa-
ries of high density oligonucleotide array probe level data.
Biostatistics 2003, 4:249-264.
51. Storey JD, Tibshirani R: Statistical significance for genomewide
studies. Proc Natl Acad Sci USA 2003, 100:9440-9445.
52. Sebastiani PXHRM: Bayesian Analysis of Comparative Microar-
ray Experiments by Model Averaging. Bayesian Analysis 2006,
1:707-732.
53. Edgar R, Domrachev M, Lash AE: Gene Expression Omnibus:
NCBI gene expression and hybridization array data
repository. Nucleic Acids Res 2002, 30:207-210.
54. Reich M, Liefeld T, Gould J, Lerner J, Tamayo P, Mesirov JP: GenePa-
ttern 2.0. Nat Genet 2006, 38:500-501.
55. human-library.txt. 2007. Ref Type: Data File
56. R Development Core Team: R: A language and environment for statisti-
cal computing Vienna, Austria: R Foundation for Statistical Computing;
2005.
57. The e1071 Package. 2006 [ />Descriptions/e1071.html]. Ref Type: Generic
58. Heguy A, Harvey BG, Leopold PL, Dolgalev I, Raman T, Crystal RG:
Responses of the human airway epithelium transcriptome to
in vivo injury. Physiol Genomics 2007, 29:139-148.
59. Vandesompele J, De Preter K, Pattyn F, Poppe B, Van Roy N, De
Paepe A, Speleman F: Accurate normalization of real-time
quantitative RT-PCR data by geometric averaging of multi-
ple internal control genes. Genome Biol 2002, 3:RESEARCH0034.
60. Gentleman RC, Carey VJ, Bates DM, Bolstad B, Dettling M, Dudoit S,
Ellis B, Gautier L, Ge Y, Gentry J, et al.: Bioconductor: open soft-
ware development for computational biology and
bioinformatics. Genome Biol 2004, 5:R80.