Báo cáo y học: "All duplicates are not equal: the difference between small-scale and genome duplicatio" docx
Bạn đang xem bản rút gọn của tài liệu. Xem và tải ngay bản đầy đủ của tài liệu tại đây (492.85 KB, 13 trang )
Genome Biology 2007, 8:R209
Open Access
2007Hakeset al.Volume 8, Issue 10, Article R209
Research
All duplicates are not equal: the difference between small-scale and
genome duplication
Luke Hakes
¤
, John W Pinney
¤
, Simon C Lovell, Stephen G Oliver and
David L Robertson
Address: Faculty of Life Sciences, University of Manchester, Oxford Road, Manchester M13 9PT, UK.
¤ These authors contributed equally to this work.
Correspondence: David L Robertson. Email:
© 2007 Hakes et al.; licensee BioMed Central Ltd.
This is an open access article distributed under the terms of the Creative Commons Attribution License ( which
permits unrestricted use, distribution, and reproduction in any medium, provided the original work is properly cited.
Differences between large and small duplications<p>The comparison of pairs of gene duplications generated by small-scale duplications with those created by large-scale duplications shows that they differ in quantifiable ways. It is suggested that this is directly due to biases on the paths to gene retention rather than asso-ciation with different functional categories.</p>
Abstract
Background: Genes in populations are in constant flux, being gained through duplication and
occasionally retained or, more frequently, lost from the genome. In this study we compare pairs of
identifiable gene duplicates generated by small-scale (predominantly single-gene) duplications with
those created by a large-scale gene duplication event (whole-genome duplication) in the yeast
Saccharomyces cerevisiae.
Results: We find a number of quantifiable differences between these data sets. Whole-genome
duplicates tend to exhibit less profound phenotypic effects when deleted, are functionally less
divergent, and are associated with a different set of functions than their small-scale duplicate
counterparts. At first sight, either of these latter two features could provide a plausible mechanism
by which the difference in dispensability might arise. However, we uncover no evidence suggesting
that this is the case. We find that the difference in dispensability observed between the two
duplicate types is limited to gene products found within protein complexes, and probably results
from differences in the relative strength of the evolutionary pressures present following each type
of duplication event.
Conclusion: Genes, and the proteins they specify, originating from small-scale and whole-genome
duplication events differ in quantifiable ways. We infer that this is not due to their association with
different functional categories; rather, it is a direct result of biases in gene retention.
Background
The importance of gene duplication in molecular evolution is
well established [1,2]. In a given genome, the collection of
genes commonly referred to as 'duplicates' do not represent a
homogeneous set. This is because duplicate genes can be gen-
erated through one of two main mechanisms, namely small-
scale or large-scale duplication events, with the most extreme
large-scale event being duplication of the entire genome.
Genes resulting from these processes are thus distinct subsets
of gene duplicates. However, with few exceptions [3,4],
Published: 4 October 2007
Genome Biology 2007, 8:R209 (doi:10.1186/gb-2007-8-10-r209)
Received: 12 June 2007
Revised: 3 October 2007
Accepted: 4 October 2007
The electronic version of this article is the complete one and can be
found online at />Genome Biology 2007, 8:R209
Genome Biology 2007, Volume 8, Issue 10, Article R209 Hakes et al. R209.2
previous studies investigating the functional fate and evolu-
tion of these genes have always treated them as a single
homogeneous population (for instance [5,6]).
Certain types of gene are more likely than others to be
retained within the genome following a duplication event.
These include the following [7-11]: genes that are present in
many evolutionarily divergent lineages; those that are func-
tionally constrained; genes involved in environmental
responses; and highly expressed genes. What is not clear,
however, is whether genes and their products resulting from
both small-scale duplications and whole-genome duplication
are subject to the same kind and degree of evolutionary pres-
sures. Subtle differences may have consequences relating to
the probabilities of different types of genes being retained
after duplication.
Part of the reason for the gap in our current understanding
lies with limitations in the analytical techniques commonly
employed. When estimating whether two duplicates have
diverged in function, we face two main challenges. First, there
is a need to measure the time that has elapsed since the dupli-
cation event. In practice, this is usually done by estimating
the synonymous or non-synonymous substitutions that have
occurred since the duplication [12]. Second, and more impor-
tant, is the need to determine whether the function(s) of the
genes are different, similar, or identical. Clearly, the most
accurate measure of whether two proteins share the same
function can only be ascertained through concerted and care-
ful examination of both protein members. Although this type
of traditional experimentation is both appropriate and feasi-
ble for a small number of genes, it has not been performed for
genome-scale data sets. With that in mind, a number of high-
throughput methods (both experimental and computational)
have been developed in order to investigate protein function
at the whole-genome level. Such experimental approaches
include yeast two-hybrid screens [13-16], genetic interaction
screens [17], and the analysis of protein complexes by mass
spectrometry [18-20].
Computationally, asymmetrical sequence divergence is most
commonly used as a proxy for functional divergence (for
example [21]). More recently, computational methods of net-
work analysis have been used to study gene function more
directly based on the annotation of their interacting partners
[22], for example by identifying functional modules following
network clustering [23]. Wagner [24] used network-based
methodologies to define the functional fate of duplicates, tak-
ing the number of shared interactions between the products
of a duplicated gene pair as a crude measure of the overlap of
the two genes' functions. By clustering the interaction data,
Baudot and colleagues [25] were able to derive a functional
scale of convergence/divergence for a subset of the duplicated
gene pairs. Conant and Wolfe [26] showed that marked asym-
metry exists between the protein interaction networks associ-
ated with duplicate genes. They proposed that, following a
genome duplication event, two semi-independent networks
are created in which the ancestral function of the duplicated
gene is split between the nascent and original copy. Most
recently, Guan and colleagues [4] used protein interactions
and a Bayesian data integration method to infer functional
associations and showed that whole-genome duplicates had
properties distinct from small-scale duplicates.
In addition to functional inference through inspection of the
protein interaction network, one may also infer function
directly through the annotations attached to the genes of
interest, such as those presented by the Gene Ontology (GO)
[27]. Comparison of the annotations contained within the
'molecular function' aspect of the ontology allows determina-
tion of the similarity of gene functions in an automated man-
ner. A number of methods have been developed to quantify
the semantic similarity (or difference) between a pair of terms
[28-30]. By applying one of these methods to GO it is possible
to determine the semantic similarity between the annotations
of two genes, which can be considered a measure of their
functional similarity.
In this study the characteristics of genes (and the proteins
that they specify), derived from small-scale and whole-
genome duplication (small-scale duplicates [SSDs] and
whole-genome duplicates [WGDs], respectively), are com-
pared for the yeast Saccharomyces cerevisiae. Comparison of
the functional divergence between the paralogous pairs of
duplicates, using both protein interactions and GO annota-
tions as proxies for protein function, reveals a distinct differ-
ence between the functional divergence of duplicate genes of
each duplicate type. We then show that despite the SSD and
WGD sets being associated with different functional catego-
ries, there is no evidence that these differences influence
essentiality. Rather, proteins derived from whole-genome
duplication in complexes are significantly more dispensable
than those derived from small-scale duplication. We infer
that the difference between the duplicate sets is most proba-
bly a result of the different strengths of constraint imposed by
dosage and balance effects on the gene products, that is they
are a direct consequence of biases in gene retention.
Results
WGD paralog pairs are functionally more similar than
SSD paralogs
By using the protein interaction network as a proxy for pro-
tein function, it is possible to investigate the functional simi-
larity of each member of a duplicate gene pair on a large scale.
At the point of duplication, paralogous pairs have identical
protein sequences and hence identical binding surfaces, spe-
cificity, and (ultimately) function. This functional similarity
should be reflected within the protein interaction network as
a tendency for duplicate gene pair products to share more
protein interactions than random pairings of non-duplicates.
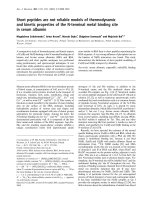
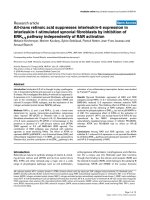
Figure 1 shows the average number of shared interactions for
Genome Biology 2007, Volume 8, Issue 10, Article R209 Hakes et al. R209.3
Genome Biology 2007, 8:R209
both the SSD and WGD sets of proteins, plotted against
sequence divergence measured by non-synonymous substitu-
tions, K
a
. Dashed lines on the graph represent the average
shared interaction ratio for each duplicate set and for a set of
randomly paired proteins. It is evident from the disparity
between the averages for each group of pairs that proteins
derived from both small-scale and whole-genome duplica-
tion, share many more interactions than we would expect by
chance (P < 2 × 10
-16
, Wilcoxon rank sum). It is also clear that
proteins derived from the whole-genome duplication on aver-
age have more protein interactions in common, and hence
more similar functions, than do those from small-scale dupli-
cations (P = 1 × 10
-4
, Wilcoxon rank sum). Note that this dif-
ference between WGDs and SSDs is not due to some bias
introduced by a stringent sequence identity threshold
because these results remain unchanged if a less conservative
threshold is used to identify SSD pairs (Additional data file 1).
It is a possibility that this difference in connectivity might be
due to differences in the average connectivity of the gene
products contained within each group. Given the high error
rate and degree of noise within the existing protein interac-
tion network data [31], pairs of highly connected proteins
could, simply by chance, be more likely to share protein inter-
actions than pairs whose members are involved in fewer
interactions. To test this, the average degree of the proteins
within each duplicate set and within similar sized random
genome samples was investigated. No significant differences
were found between the average degrees of the proteins in any
class (SSDs, WGDs, or random pairings), with all three sets
having gene products with an average of about ten interac-
tions. This finding indicates that, in general, duplicates are
not more connected than non-duplicates, and confirms the
observation that pairs of WGDs share more protein interac-
tions than pairs of SSDs.
In addition to protein-protein interactions, functional anno-
tations within the GO database [32] were used as a second
computationally amenable proxy for protein function. The
semantic distance between the annotations of a pair of dupli-
cated genes [28,33] was used to quantify the similarity of
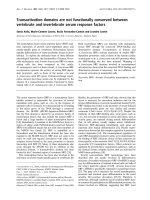
their molecular functions. By studying the distributions of
semantic distances for each class of duplicate, their propen-
sity to share functional annotations was compared (Figure 2).
In agreement with the result obtained using the protein inter-
action network, on average the members of WGD pairs were
found to have a lower semantic distance, and hence a more
similar function, than the members of SSD pairs (mean
Comparison of the shared interaction ratio for duplicate gene products and random protein pairsFigure 1
Comparison of the shared interaction ratio for duplicate gene products and random protein pairs. Whole-genome duplicates (WGDs) are illustrated in
blue and small-scale duplicates (SSDs) are illustrated in red. Mean shared interaction ratio r is plotted against gene sequence divergence measured by non-
synonymous substitution rate (K
a
). The dashed lines indicate the average shared interaction ratio for WGDs (blue), SSDs (red), and pairs of proteins
selected at random from the genome (black). Error bars show standard errors on the mean of r for each bin.
0
50.0
1
.
0
51.0
2.0
52.0
3.0
53.0
9
.0
8.
0
7.06.05.04.03.02.01.00
aK
Shared interaction ratio
Genome Biology 2007, 8:R209
Genome Biology 2007, Volume 8, Issue 10, Article R209 Hakes et al. R209.4
semantic distance: 3.21 for SSDs versus 2.76 for WGDs; P =
0.045, Wilcoxon rank sum). Note that both sets of duplicate
genes tended to have much lower semantic distances than
pairs selected at random, again indicating that duplicated
genes have functions that are more similar than would be
expected by chance (mean semantic distance: 10.26; P < 2 ×
10
-6
, Wilcoxon rank sum). These results also remain
unchanged if a less conservative sequence identity threshold
is used to identify SSD pairs (Additional data file 2).
WGDs are less likely to be essential than SSDs
Genes with overlapping functions are more likely to have the
ability to compensate for each other when mutation/loss
occurs. Because WGDs have tendencies both to share more
interactions and to be functionally more related (Figures 1
and 2), WGDs should be more dispensable than SSDs. To
investigate this hypothesis, the different duplicate sets were
analyzed within the context of gene knockout studies; dele-
tion of a WGD gene should, on average, have a weaker pheno-
typic effect than deletion of a SSD gene. Using the data
generated in the Saccharomyces Gene Deletion Project [34],
those genes that showed an essential phenotype upon dele-
tion were identified. In accordance with previous observa-
tions [35], deletion of a duplicate was found to be significantly
less likely to confer an essential phenotype than deletion of a
non-duplicate (only about 8% of duplicates are essential ver-
sus about 29% of non-duplicates; P < 1 × 10
-3
, Pearson's χ
2
).
Moreover, the proportion of essential genes within the WGD
set was found to be less than that observed for SSDs (6% of
WGD genes are essential versus about 9% of SSD genes; P < 1
× 10
-3
, Pearson's χ
2
). Thus, WGDs play a relatively greater
role in redundancy (and hence 'robustness') than do SSDs, as
has been inferred from a comparison of duplicates and single-
copy genes [35].
WGDs and SSDs are linked with different functional
categories
An explanation for the difference in dispensability between
SSDs and WGDs could be that the two sets are associated with
different functional classes of proteins. To test this hypo-
thesis, the GO was used to investigate over-represented and
under-represented functional annotations [32] for the genes
within each duplicate class. We find that, in terms of their
functions, the two types of duplicate show distinct profiles
compared both to the set of all yeast open reading frames
(ORFs; Table 1) and to each other. There is little overlap
Relationship between semantic distance and the proportion of pairs within each duplicate setFigure 2
Relationship between semantic distance and the proportion of pairs within each duplicate set. Whole-genome duplicates (WGDs) are illustrated in blue,
small-scale duplicates (SSDs) in red, and random gene pairings in gray. A higher semantic distance indicates greater functional divergence.
0
50.0
1
.0
51.0
2.0
52.0
3.0
53.0
0
2
91
81
7161
51
41
31
21110
1
9876
5
4321
ecnatsid citnameS
Proportion of pairs
Genome Biology 2007, Volume 8, Issue 10, Article R209 Hakes et al. R209.5
Genome Biology 2007, 8:R209
between the functions of genes that are significantly over-rep-
resented or under-represented in the sets of SSDs and WGDs.
Proteins derived from small-scale duplication are enriched
for transporter functions, particularly sugar transporters, and
also for those with hydrolase and helicase activities. Genes
specifying proteins that are involved in binding, particularly
nucleic acid binding and transcription regulators, are under-
represented in this set of duplicates. Whole-genome duplica-
tion derived proteins that are structural molecules or protein
kinases are significantly over-represented, whereas methyl-
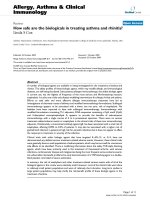
transferases are under-represented. Figure 3 shows a visuali-
zation of representative molecular functions associated with
the two sets of duplicate genes on a semantic distance net-
work. Clearly, the distributions of the duplicate genes are not
random across all functional categories.
Differences in essentiality between WGDs and SSDs
are not due to differences in their functional categories
Mapping the yeast essential genes onto functional categories,
we find no pattern of correlation between the functions that
are over-represented or under-represented in the SSD and
WGD sets and the distribution of essential genes in those
classes (Table 2). For the functional classes that are signifi-
cantly over-represented in the set of essential ORFs (which
we might also expect to be significantly over-represented in
the SSDs), we observe little difference between the SSD and
WGD sets. Although genes derived from small-scale duplica-
tion appear to be enriched for some essential functions, this
enrichment is counterbalanced by an equally strong suppres-
sion of others. For the functions that tend to be mostly asso-
ciated with non-essential ORFs, we actually observe the
opposite of what might be expected if differences in protein
function were responsible for the discrepancy (an over-repre-
sentation of these classes among SSD genes). Thus, the phe-
notypic asymmetry between the two classes of duplicate is not
because they encode proteins that have functions that are
either more or less likely to be essential upon deletion. The
difference must therefore stem from some other factor.
WGDs are more likely to be members of protein
complexes than SSDs; WGD associated complexes are
less likely to be essential than SSD complexes
If the functions that the small-scale and whole-genome dupli-
cation derived sets of proteins are associated with do not
account for their differences, then we surmise that an impor-
tant factor must be related to their different mechanisms of
generation (sequential versus simultaneous, respectively).
Because of dosage and balance effects [36,37], the two dupli-
cate types will be subject to differential probabilities of being
retained subsequent to their generation by duplication. These
factors will have the greatest impact on duplicates present in
complexes. We investigated the relative dispensabilities of
both complex-forming and non-complex-forming WGD and
SSD associated proteins (Table 3). For gene products partici-
pating in complexes (as described in MIPS [Munich Informa-
tion Center for Protein Sequences] [38]), we find a
statistically significant asymmetry between the dispensability
of the two duplicate types, with 10% of WGDs versus 21% of
Visualization of the two sets of duplicates on a semantic distance networkFigure 3
Visualization of the two sets of duplicates on a semantic distance network. (a) The yeast proteome is distributed spatially according to semantic distance,
with six high-level functional classes highlighted in different colors that are either over-represented or under-represented in the whole-genome duplicate
(WGD) or small-scale duplicate (SSD) sets (see Table 1). (b) WGDs are shown in blue and SSDs in red; the same six functional classes are highlighted.
The products of the two types of duplicate gene have a tendency to occupy separate areas of semantic space, indicating involvement in different functions.
Enzyme
regulator
Protein
kinase
Ribosome
component
Nucleoside
triphosphatase
DNA
binding
Sugar
transporter
(a) (b)
Genome Biology 2007, 8:R209
Genome Biology 2007, Volume 8, Issue 10, Article R209 Hakes et al. R209.6
Table 1
Over-represented and under-represented functional annotations within the different duplicate sets
GO ID Description Total observed P (raw) P (corrected)
Over-represented in set of WGDs
0004672 Protein kinase activity 127 52 2.7 × e
-12
<0.001
0003735 Structural constituent of ribosome 217 72 3.4 × e
-11
<0.001
0016773 Phosphotransferase activity, alcohol group as acceptor 171 61 3.9 × e
-11
<0.001
0016301 Kinase activity 197 67 4.9 × e
-11
<0.001
0004674 Protein serine/threonine kinase activity 69 32 1.1 × e
-09
<0.001
0016772 Transferase activity, transferring phosphorus-containing groups 294 78 4.3 × e
-07
<0.001
0016538 Cyclin-dependent protein kinase regulator activity 23 14 8.8 × e
-07
<0.001
0005198 Structural molecule activity 338 83 5.6 × e
-06
0.001
0030234
E
nzyme regulator activity 180 50 1.4 × e
-05
0.002
0019887 Protein kinase regulator activity 44 18 4.3 × e
-05
0.004
0016740 Transferase activity 641 135 4.6 × e
-05
0.004
0005083 Small GTPase regulator activity 47 18 1.2 × e
-04
0.018
0019207 Kinase regulator activity 47 18 1.2 × e
-04
0.018
0035251 UDP-glucosyltransferase activity 13 8 2.0 × e
-04
0.027
0003704 Specific RNA polymerase II transcription factor activity 45 17 2.2 × e
-04
0.029
0016791 Phosphoric monoester hydrolase activity 88 27 2.4 × e
-04
0.029
0030508 Thiol-disulfide exchange intermediate activity 8 6 2.9 × e
-04
0.042
Under-represented in set of WGDs
0008757 S-adenosylmethionine-dependent methyltransferase activity 62 0 2.7 × e
-05
<0.001
0016741 Transferase activity, transferring one-carbon groups 84 2 8.7 × e
-05
0.003
0015078 Hydrogen ion transporter activity 54 0 1.1 × e
-04
0.006
0008168 Methyltransferase activity 82 2 1.2 × e
-04
0.006
0031202 RNA splicing factor activity, transesterification mechanism 51 0 1.8 × e
-04
0.008
0016251 General RNA polymerase II transcription factor activity 62 1 3.4 × e
-04
0.014
Over-represented in set of SSDs
0051119 Sugar transporter activity 25 22 2.7 × e
-20
<0.001
0015144 Carbohydrate transporter activity 30 23 1.5 × e
-18
<0.001
0015145 Monosaccharide transporter activity 21 18 2.3 × e
-16
<0.001
0015149 Hexose transporter activity 21 18 2.3 × e
-16
<0.001
0015578 Mannose transporter activity 15 15 3.0 × e
-16
<0.001
0005353 Fructose transporter activity 15 15 3.0 × e
-16
<0.001
0017111 Nucleoside-triphosphatase activity 243 65 7.3 × e
-16
<0.001
0005355 Glucose transporter activity 18 16 3.5 × e
-15
<0.001
0016818 Hydrolase activity, acting on acid anhydrides, in phosphorus-containing anhydrides 264 67 4.4 × e
-15
<0.001
0016462 Pyrophosphatase activity 264 67 4.4 × e
-15
<0.001
0016817 Hydrolase activity, acting on acid anhydrides 264 67 4.4 × e
-15
<0.001
0005215 Transporter activity 410 84 6.7 × e
-13
<0.001
0003824 Catalytic activity 1885 252 7.3 × e
-13
<0.001
0016887 ATPase activity 185 46 2.5 × e
-10
<0.001
0016787 Hydrolase activity 707 109 2.1 × e
-08
<0.001
0016614 Oxidoreductase activity, acting on CH-OH group of donors 75 24 3.2 × e
-08
<0.001
0016616 Oxidoreductase activity, acting on the CH-OH group of donors, NAD or NADP as
acceptor
67 22 7.2 × e
-08
<0.001
0004386 Helicase activity 83 24 2.8 × e
-07
<0.001
0042626 ATPase activity, coupled to transmembrane movement of substances 58 19 5.9 × e
-07
<0.001
0043492 ATPase activity, coupled to movement of substances 58 19 5.9 × e
-07
<0.001
0016820 Hydrolase activity, acting on acid anhydrides, catalyzing transmembrane movement
of substances
58 19 5.9 × e
-07
<0.001
Genome Biology 2007, Volume 8, Issue 10, Article R209 Hakes et al. R209.7
Genome Biology 2007, 8:R209
SSDs being essential. For non-complex-forming genes, the
two classes of duplicate appear to be similarly dispensable,
with 6% of WGDs versus 9% of SSDs being essential (Table 3).
Interestingly, the products of whole-genome duplication are
significantly more likely to be present in a protein complex
than those of small-scale duplications (19% versus 14%; χ
2
=
4.44, P < 0.05).
Differing proportions of complex-forming proteins
explain differences in functional similarity between
WGD and SSD paralog pairs, but not their differences
in essentiality
To investigate how the difference in propensity for complex
membership maps onto the asymmetry in dispensability
between the two duplicate types, we repeated the semantic
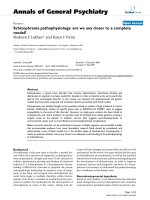
distance analysis with these subsets (Figure 4). This analysis
revealed significant differences between the degrees of func-
tional divergence between the pairs of gene products in the
two categories (complex and non-complex), suggesting that
the functional evolution of proteins that participate in protein
complexes is considerably more constrained than those that
do not. Importantly, we found no significant difference
between the semantic distances of pairs of SSD associated
proteins found in complexes and complex-forming WGD pro-
tein pairs, nor indeed between SSD pairs not in complexes
and WGD pairs not found within complexes. This indicates
that although the observed difference in functional diver-
gence of SSDs and WGDs (Figure 2) is accounted for by the
greater number of WGDs that encode complex-forming pro-
teins, functional constraint caused by complex membership is
not a factor in determining gene dispensability, because com-
plex-forming WGDs are still less dispensable than complex-
forming SSDs, even when they exhibit similar levels of func-
tional divergence.
Discussion
Collectively, our results demonstrate that the differences
between the two types of duplicate are not limited to the way
in which they were generated. Investigation of the functional
similarity between the members of duplicate pairs reveals a
distinct difference between the two duplicate types, with
whole-genome duplication derived genes tending to be more
functionally similar than those from small-scale duplication.
This result is the same regardless of whether function is
measured using shared interactions, in the context of protein
interaction data (Figure 1), or by calculation of the semantic
distance between the functional annotations of members of a
duplicate pair (Figure 2). Although our results were obtained
using different methodology (semantic distance rather than
Bayesian inference), this finding is consistent with the recent
report by Guan and colleagues [4].
The greater functional similarity among WGDs suggests that
they contribute more to redundancy than SSDs. Indeed,
investigating essentiality directly, in the context of gene
knockout studies (Table 2), we find that genes derived from
whole-genome duplication are more likely to be dispensable
than those from small-scale duplications (Table 3). Our
results indicate that this asymmetry does not result from a
bias toward more dispensable functions within whole-
genome duplication derived genes, suggesting that it has a
0016491 Oxidoreductase activity 262 49 1.2 × e
-06
<0.001
0015075 Ion transporter activity 145 32 2.6 × e
-06
<0.001
0008324 Cation transporter activity 124 28 6.9 × e
-06
<0.001
0042623 ATPase activity, coupled 125 28 8.2 × e
-06
0.001
0018456 Aryl-alcohol dehydrogenase activity 8 6 1.5 × e
-05
0.002
0015294 Solute:cation symporter activity 8 6 1.5 × e
-05
0.002
0003924 GTPase activity 54 16 2.0 × e
-05
0.002
0005354 Galactose transporter activity 6 5 3.9 × e
-05
0.009
0015293 Symporter activity 9 6 4.3 × e
-05
0.012
0005537 Mannose binding 4 4 7.6 × e-05 0.017
0015238 Drug transporter activity 15 7 2.0 × e
-04
0.035
0003678 DNA helicase activity 35 11 2.2 × e
-04
0.039
Under-represented in set of SSD
0003676 Nucleic acid binding 494 12 1.8 × e
-10
0
0005488 Binding 1034 58 1.1 × e
-06
0
0003723 RNA binding 231 4 1.6 × e
-06
0
0003677 DNA binding 220 6 8.0 × e
-05
0.002
0030528 Transcription regulator activity 326 14 3.3 × e
-04
0.006
0016779 Nucleotidyltransferase activity 80 0 3.7 × e
-04
0.009
GO, Gene Ontology; SSD, small-scale duplicate; WGD, whole-genome duplicate.
Table 1 (Continued)
Over-represented and under-represented functional annotations within the different duplicate sets
Genome Biology 2007, 8:R209
Genome Biology 2007, Volume 8, Issue 10, Article R209 Hakes et al. R209.8
Table 2
The relationship between dispensability and functional category for both WGDs and SSDs
GO ID Description % all ORFs % SSDs % WGDs
Over-represented in set of essential genes
0003824 Catalytic activity 32.5 46.5
+
35.8
0005488 Binding 17.8 10.7
-
17.9
0016740 Transferase activity 11.1 9.4 15.0
+
0003676 Nucleic acid binding 8.5 2.2
-
10.1
0005515 Protein binding 7.5 5.5 5.9
0005198 Structural molecule activity 5.8 8.1 9.2
+
0030528 Transcription regulator activity 5.6 2.6
-
7.0
0016772 Transferase activity, transferring phosphorus-containing groups 5.1 4.6 8.7
+
0016462 Pyrophosphatase activity 4.6 12.4
+
3.1
0016817 Hydrolase activity, acting on acid anhydrides 4.6 12.4
+
3.1
0016818 Hydrolase activity, acting on acid anhydrides, in phosphorus-containing anhydrides 4.6 12.4
+
3.1
0017111 Nucleoside-triphosphatase activity 4.2 12.0
+
2.7
0003723 RNA binding 4.0 0.7
-
3.1
0016887 ATPase activity 3.2 8.5
+
1.8
0016874 Ligase activity 2.2 1.7 2.0
0003702 RNA polymerase II transcription factor activity 2.1 0.7 2.7
0004386 Helicase activity 1.4 4.4
+
0.4
0016779 Nucleotidyltransferase activity 1.4 0.0
-
1.0
0016251 General RNA polymerase II transcription factor activity 1.1 0.4 0.1
-
Under-represented in set of essential genes
0005215 Transporter activity 7.1 15.5
+
6.2
0016491 Oxidoreductase activity 4.5 9.0
+
5.3
0015075 Ion transporter activity 2.5 5.9
+
1.6
0008324 Cation transporter activity 2.1 5.2
+
1.1
Gene Ontology (GO) categories significantly over-represented and under-represented (corrected P < 0.05) are sorted by abundance (1% cut-off).
Significant over-representation and under-representation in the duplicate sets are denoted by superscript '+' and '-', respectively. ORF, open reading
frame; SSD, small-scale duplicate; WGD, whole-genome duplicate.
Table 3
Dispensability of SSD and WGD proteins found in complexes and those not found within protein complexes
WGD SSD
Complexes
Essential 16 (10%) 15 (21%)
Not essential 138 (90%) 55 (79%)
Total 154 70
Non-complexes
Essential 32 (5%) 28 (7%)
Not essential 642 (95%) 398 (93%)
Total 674 426
SSD, small-scale duplicate; WGD, whole-genome duplicate.
Genome Biology 2007, Volume 8, Issue 10, Article R209 Hakes et al. R209.9
Genome Biology 2007, 8:R209
more fundamental basis. The difference in functional diver-
gence between duplicates observed between the two sets (Fig-
ures 1 and 2) can be accounted for by their products having
greater propensity to be part of protein complexes, which are
generally less divergent than proteins that are not part of
complexes. However, although we find that proteins associ-
ated with SSDs and WGDs in complexes are equally function-
ally constrained (Figure 4), they still exhibit a twofold
difference in their propensity to confer an essential pheno-
type upon deletion. This indicates that, contrary to expecta-
tions, neither differences in functional divergence nor the
propensity for complex membership can explain the observed
asymmetry in duplicate dispensability. Rather, that differ-
ence is likely to stem from the relative strengths of evolution-
ary constraint prevalent in the period following each type of
duplication event.
Consider a protein complex composed of three subunits A, B,
and C. In some cases an excess of any of the members of such
a complex can be detrimental [36]. Such cases include (but
are not limited to) situations in which individual subunits can
homodimerize to form complexes with different functions to
that of ABC [39] or cases in which subunits that form a bridge
between parts of the complex may, when in excess, inhibit
complex assembly altogether [40]. Following whole-genome
duplication, all three subunits of the complex will be present
in duplicate and thus their stoichiometries will be maintained
in a 'balanced' fashion, causing minimal phenotypic disrup-
tion. Conversely, small-scale duplication events are likely to
involve only one member of a complex and thus, because they
will cause disruption to the 'balance' of any complex in which
they are involved, they will have a greater tendency to be
immediately deleterious to the organism. In this way, dupli-
cation derived proteins involved in multi-subunit complexes
will have a greater probability of persisting (being retained) in
the genome following whole-genome duplication but are
more likely to be selected against and are more rapidly
removed following small-scale duplication events. The signif-
icance of such balance effects, specifically within whole-
genome duplication, was highlighted by Papp and colleagues
Relationship between semantic distance, duplicate set and complex membershipFigure 4
Relationship between semantic distance, duplicate set and complex membership. The proportion of duplicate pairs having a certain level of functional
divergence as measured by semantic distance for the following: pairs of complex-forming whole-genome duplicate (WGD; dark blue), complex-forming
small-scale duplicate (SSD; red), non-complex-forming WGD (light blue), and non-complex-forming SSD (pink) proteins. Significant differences in the
degree of functional divergence between the pairs in the two categories (complex and non-complex) are observed. No significant difference between the
semantic distances of pairs of SSDs found in complexes and complex-forming WGD pairs is observed; nor, indeed, is there any difference between SSD
pairs not in complexes and WGD pairs not found within complexes.
0
1.0
2.0
3.0
4.0
5.0
6.0
7.0
0291
81
71
61
514131211101
9
8
7
65
43
21
ecnatsidcitnameS
Proport
i
on o
f pairs
Genome Biology 2007, 8:R209
Genome Biology 2007, Volume 8, Issue 10, Article R209 Hakes et al. R209.10
[37]. Those investigators demonstrated that the frequency of
genes encoding the subunits of cytosolic ribosomes is tenfold
higher among WGDs than among SSDs [37].
Although balance (or rather imbalance) effects have been
shown to be important for a few select entities within the cell
(for example, components of the cytoskeleton), in general
their prevalence is thought to be low [41]. Another explana-
tion for the reduction in retention of complex components
following single-gene duplication is that, rather than being
detrimental, duplication of an individual complex component
is more likely to be neutral. Because the small-scale
duplication provides no immediate benefit, it will not be
selected for and so will probably be lost relatively rapidly. In
contrast, duplication of an entire complex during whole-
genome duplication is likely to have immediate benefit for
those complexes that are dosage sensitive, and so selection
will act strongly on its members to retain them. This type of
dosage effect and biased retention has been reported in an
analysis of whole-genome duplication in the ciliate Para-
mecium tetraurelia [42].
How, then, does this proposed mechanism of retention relate
to the differences observed in the functional similarity and
dispensability of each duplicate type? In the period that fol-
lows duplication, duplicated genes may be retained for one of
three reasons. The first is that, in the case of a dosage advan-
tage, duplicates will be subject to selection and will maintain
the function of the ancestral gene. Alternatively, when dosage
is not advantageous, they may diverge and either (second
reason) gain a new function or (third reason) assume part of
the ancestral gene's function. Because whole-genome dupli-
cation generates two copies of every gene within the genome,
and thus of every member of every protein complex, it enables
entire complexes to be duplicated, which will result in a
greater propensity for WGDs to be retained in cases where
increased dosage is an advantage. This leads to the over-rep-
resentation of genes encoding members of protein complexes
within the WGD set. Conversely, individual complex mem-
bers duplicated by small-scale duplication will probably pro-
vide no immediate benefit (or be selected against according to
the balance hypothesis). Either way, they will have a relatively
low probability of being retained following duplication.
The underlying factor that results in whole-genome duplica-
tion derived genes being more dispensable than small-scale
duplication derived genes does not appear to be related to the
particular functional categories of genes that are retained fol-
lowing each duplication event (Table 2). That this asymmetry
is observed in proteins involved in complexes indicates that
this phenomenon is, instead, probably due to the differences
in the probability of retention of each duplicate type. For
example, following whole-genome duplication, a complex
retained for dosage reasons is inherently 'backed up', whereas
complexes involving small-scale duplication derived genes
are likely to have functions that are novel, or even unique, and
are thus less dispensable. As a result, genome duplicates will
contribute relatively more to redundancy, although merely as
a by-product of their paths to retention.
Conclusion
We have demonstrated that genes originating from single-
gene and whole-genome duplication events differ in quantifi-
able ways; whole-genome and small-scale duplication
derived proteins are enriched for different categories of
molecular functions. WGD paralogs are functionally less
diverse, less likely to be essential, and more likely to be
members of a protein complex than SSD paralogs. Protein
complex members originating from a whole-genome duplica-
tion event are also about half as likely to be essential as those
produced by small-scale duplication events.
Given that rates of small-scale gene duplication have been
estimated to be as high as about 0.01 per gene per million
years [43], there is clearly a huge difference in the probability
of gene retention following a small-scale duplication event
(average half-life about 4 million years [43]) as compared
with a whole-genome duplication event (average half-life
about 33 million years, based on 12% paralog retention in S.
cerevisiae [21] after about 100 million years [44]). This dis-
crepancy provides compelling evidence that these different
types of duplicates must experience different evolutionary
pressures en route to retention, which are observable as dif-
ferences in functional diversity, essentiality, and protein com-
plex membership.
Such differences have important implications for how new
genes with novel protein functions arise within the genome.
They indicate that there is bias in the types of genes that con-
tribute the most to functional innovation and evolution of
complexity. As a direct result of their greater chance of being
retained, WGDs will often be observed to contribute to func-
tional innovation. Paradoxically, the same processes (balance
and dosage) that increase the probability of retention of
genome duplicates also impose constraints on their func-
tional evolution. Although more frequently lost from the
genome, the products of small-scale duplications will, when
they are retained, have the potential to make a relatively
larger contribution to innovation. Our finding that the differ-
ent duplicate gene sets have a tendency to be involved in dif-
ferent functional categories (Figure 3) implies that, despite
their differences, both WGDs and SSDs contribute signifi-
cantly to evolutionary 'raw material'.
Materials and methods
Duplicate genes
The 450 pairs of WGD genes were taken from the previous
study conducted by Kellis and co-workers [21]. SSD genes
were identified using GenomeHistory [45] with the following
parameters: BLAST (basic local alignment search tool)
Genome Biology 2007, Volume 8, Issue 10, Article R209 Hakes et al. R209.11
Genome Biology 2007, 8:R209
threshold 1 × 10
-8
, minimum ORF translation length 100,
minimum aligned residues 100, and percentage identity
threshold 40%. All WGD genes, dubious ORFs, and transpos-
able elements were excluded from the SSD data set. In cases
in which a gene was found to have more than one paralog, a
single representative paralog was selected at random. This
yielded a set of WGD genes (450 pairs) and a conservative set
of SSD genes (271 pairs). Sequence divergence (K
a
) for all
duplicate pairs was calculated using the method proposed by
Yang and Nielsen [46], as implemented in PAML (phyloge-
netic analysis by maximum likelihood) [47].
A stringent identity threshold of 40% was selected to ensure
that the SSD pairs identified were genuine paralogs. To
ensure that the exclusion of more distant paralog pairs was
not causing bias in our conclusions, we also compiled sets of
SSD pairs at 30% (422 pairs) and 20% (724 pairs) sequence
identity. The distributions of sequence divergence (K
a
) for the
WGD pairs and three sets of SSD pairs can be seen in Addi-
tional data file 3. Note that both the 30% and 20% SSD sets
contain substantial numbers of highly divergent pairs, indi-
cating the increased presence of potentially false-positive
paralogy assignments in these less conservative data sets.
Protein interaction data
Protein interaction data were extracted from the BioGRID
database [48], and all non-physical interactions were
excluded. Non-physical interactions were defined as those
where the method of detection was annotated as one of the
following: synthetic lethality, dosage rescue, synthetic growth
defect, synthetic rescue, epistatic miniarray profile, dosage
lethality, phenotypic enhancement, phenotypic suppression,
or dosage growth defect. For duplicate pairs in which both
members were identified as interacting with at least one other
protein (377 pairs), the shared interaction ratio was then cal-
culated using the following equation:
Where r is the shared interaction ratio, s is the number of
interactions shared between the two proteins, and n
1
and n
2
are the number of interactions for ORF1 and ORF2,
respectively.
Semantic distance
To assess the functional differences between each member of
a duplicate pair, the GO annotations [32] of each of the genes
were compared using a semantic distance measure [28] lim-
ited to the 'molecular function' aspect of the GO. The seman-
tic distance d(t
1
, t
2
) between two terms t
1
and t
2
within the
ontology is given by the following:
where p(t) is the information content of a term t (the fraction
of all genes associated with that term) and S(t
1
, t
2
) is the set of
all parent terms shared by t
1
and t
2
. For two genes a and b with
sets of annotated terms A and B, we define the semantic dis-
tance D(a, b) between those two genes as follows:
Where |A| and |B| are the numbers of annotated terms in the
sets A and B, respectively.
The semantic distance was chosen over other possible meth-
ods because (unlike, for instance, semantic similarity, as
defined by Resnik [30]) it provides us with a defined refer-
ence point (at D = 0) immediately following a gene duplica-
tion, away from which a duplicate pair may be expected to
evolve. In order to make this study independent of the protein
interaction data described above, all annotations that were
tagged as IPI (inferred from protein interaction) were elimi-
nated from the data set. For the semantic distance network
(Figure 3), the IPI annotations were included but genes with
unknown function were excluded. An edge is drawn between
two genes if they are functionally similar, defined as being
within a cut-off distance of 5.0. The network was visualized
using LGL [49]. Only the largest connected component is
shown.
Phenotypic effect of duplicate deletion
A list of essential genes was obtained from the Saccharomy-
ces Gene Deletion Project [34]. For calculations relating to
the number of essential genes within different sample gene
sets, we excluded all dubious ORFs and all ORFs that were not
available within the deletion collection.
Gene Ontology analysis
Lists of over-represented and under-represented GO terms
were obtained for the WGD and SSD sets, and for essential
genes. The hypergeometric distribution was used to calculate
raw P values for the number of genes associated with each GO
term within each data set, considered as a sample from all
genes in the genome. Each raw P value, p
raw
, was corrected
for multiple testing by taking 1,000 random samples of the
same size from the whole genome and recording the propor-
tion of samples in which any GO term received a P value lower
than p
raw
. This Monte Carlo approach is considered to be
more accurate than other methods for correcting for multiple
testing, owing to the fact that GO terms are not independent
of each other [50].
Abbreviations
GO, Gene Ontology; IPI, inferred from protein interaction;
K
a
, non-synonymous substitution rate; K
s
, synonymous sub-
r
s
nn
=
+
2
12
dt t pt pt pt
tStt
(, ) min{()} () ( )
(,)
12 1 2
2
12
=
⎛
⎝
⎜
⎞
⎠
⎟
−−
∈
ln ln ln
Dab
t
b
B
dt
a
t
b
t
a
A
A
t
a
A
dt
b
t
a
t
b
B
B
(,)
min { ( , )} min { ( , )}
=
∈
∈
∑
+
∈
∈
∑
⎛
⎝
1
2
⎜⎜
⎜
⎜
⎜
⎞
⎠
⎟
⎟
⎟
⎟
Genome Biology 2007, 8:R209
Genome Biology 2007, Volume 8, Issue 10, Article R209 Hakes et al. R209.12
stitution rate; ORF, open reading frame; SSD, small-scale
duplicate; WGD, whole-genome duplicate.
Authors' contributions
LH, SGO and DLR conceived research. LH, JWP, SCL and
DLR designed research. LH and JWP performed research.
LH, JWP, SCL and DLR discussed results. LH wrote the man-
uscript with contributions from all authors.
Additional data files
The following additional data are available with the online
version of this paper. Additional data file 1 shows a compari-
son of the shared interaction ratio for duplicates and random
ORF pairs. Additional data file 2 shows the semantic distance
distributions for each duplicate set. Additional data file 3
shows the numbers of paralog pairs identified at different lev-
els of sequence divergence (K
a
) within each duplicate set.
Additional data file 1Comparison of the shared interaction ratio for duplicates and ran-dom ORF pairsWGDs are illustrated in blue and SSDs are illustrated in red (found at 40% sequence identity), yellow (30% ID), and green (20% ID). Mean shared interaction ratio r is plotted against sequence diver-gence measured by K
a
. The rightmost bin indicates the mean shared interaction ratio for WGDs, three sets of SSDs and pairs of proteins selected at random from the genome (black). Error bars show standard errors on the mean of r for each bin.Click here for fileAdditional data file 2Semantic distance distributions for each duplicate setWGDs are illustrated in blue, SSDs in red (found at 40% sequence identity), yellow (30% ID) and green (20% ID), and random gene pairings in gray. A higher semantic distance indicates greater func-tional divergence.Click here for fileAdditional data file 3Numbers of paralog pairs identified at different levels of sequence divergence (K
a
) within each duplicate setWGDs are illustrated in blue and SSDs are illustrated in red (found at 40% sequence identity), yellow (30% ID) and green (20% ID).Click here for file
Acknowledgements
LH was supported by a CASE Studentship from the Biotechnology & Bio-
logical Sciences Research Council (BBSRC) and AstraZeneca. JWP is sup-
ported by a BBSRC project grant (BB/C515412/1) to DLR. We thank Julie
Huxley-Jones, Daniela Delneri, Sam Griffiths-Jones, Dennis Shields, and the
three anonymous referees for their constructive comments and
suggestions.
References
1. Nei M: Gene duplication and nucleotide substitution in
evolution. Nature 1969, 221:40-42.
2. Ohno S: Evolution by Gene Duplication London, New York: Allen &
Unwin, Springer-Verlag; 1970.
3. Davis JC, Petrov DA: Do disparate mechanisms of duplication
add similar genes to the genome? Trends Genet 2005,
21:548-551.
4. Guan Y, Dunham MJ, Troyanskaya OG: Functional analysis of
gene duplications in Saccharomyces cerevisiae. Genetics 2007,
175:933-943.
5. Gu X, Zhang Z, Huang W: Rapid evolution of expression and
regulatory divergences after yeast gene duplication. Proc Natl
Acad Sci USA 2005, 102:707-712.
6. Wagner A: How the global structure of protein interaction
networks evolves. Proc Biol Sci 2003, 270:457-466.
7. Davis JC, Petrov DA: Preferential duplication of conserved pro-
teins in eukaryotic genomes. PLoS Biol 2004, 2:E55.
8. Gu Z, Cavalcanti A, Chen FC, Bouman P, Li WH: Extent of gene
duplication in the genomes of Drosophila, nematode, and
yeast. Mol Biol Evol 2002, 19:256-262.
9. Jordan IK, Wolf YI, Koonin EV: Duplicated genes evolve slower
than singletons despite the initial rate increase. BMC Evol Biol
2004, 4:22.
10. Kondrashov FA, Rogozin IB, Wolf YI, Koonin EV: Selection in the
evolution of gene duplications. Genome Biol 2002, 3:.
RESEARCH0008
11. Seoighe C, Wolfe KH: Yeast genome evolution in the post-
genome era. Curr Opin Microbiol 1999, 2:548-554.
12. Wen-Hsiung L, Graur D: Fundamentals of Molecular Evolution Sunder-
land, MA, USA: Sineaur Associates; 1999.
13. Giot L, Bader JS, Brouwer C, Chaudhuri A, Kuang B, Li Y, Hao YL,
Ooi CE, Godwin B, Vitols E, et al.:
A protein interaction map of
Drosophila melanogaster. Science 2003, 302:1727-1736.
14. Ito T, Chiba T, Ozawa R, Yoshida M, Hattori M, Sakaki Y: A compre-
hensive two-hybrid analysis to explore the yeast protein
interactome. Proc Natl Acad Sci USA 2001, 98:4569-4574.
15. Ito T, Ota K, Kubota H, Yamaguchi Y, Chiba T, Sakuraba K, Yoshida
M: Roles for the two-hybrid system in exploration of the
yeast protein interactome. Mol Cell Proteomics 2002, 1:561-566.
16. Uetz P, Giot L, Cagney G, Mansfield TA, Judson RS, Knight JR, Lock-
shon D, Narayan V, Srinivasan M, Pochart P, et al.: A comprehen-
sive analysis of protein-protein interactions in Saccharomyces
cerevisiae. Nature 2000, 403:623-627.
17. Tong AH, Lesage G, Bader GD, Ding H, Xu H, Xin X, Young J, Berriz
GF, Brost RL, Chang M, et al.: Global mapping of the yeast
genetic interaction network. Science 2004, 303:808-813.
18. Gavin AC, Bosche M, Krause R, Grandi P, Marzioch M, Bauer A,
Schultz J, Rick JM, Michon AM, Cruciat CM, et al.: Functional organ-
ization of the yeast proteome by systematic analysis of pro-
tein complexes. Nature 2002, 415:141-147.
19. Ho Y, Gruhler A, Heilbut A, Bader GD, Moore L, Adams SL, Millar A,
Taylor P, Bennett K, Boutilier K, et al.: Systematic identification
of protein complexes in Saccharomyces cerevisiae by mass
spectrometry. Nature 2002, 415:180-183.
20. Krogan NJ, Peng WT, Cagney G, Robinson MD, Haw R, Zhong G,
Guo X, Zhang X, Canadien V, Richards DP, et al.: High-definition
macromolecular composition of yeast RNA-processing
complexes. Mol Cell 2004, 13:225-239.
21. Kellis M, Birren BW, Lander ES: Proof and evolutionary analysis
of ancient genome duplication in the yeast
Saccharomyces
cerevisiae. Nature 2004, 428:617-624.
22. Vazquez A, Flammini A, Maritan A, Vespignani A: Global protein
function prediction from protein-protein interaction
networks. Nat Biotechnol 2003, 21:697-700.
23. Rives AW, Galitski T: Modular organization of cellular
networks. Proc Natl Acad Sci USA 2003, 100:1128-1133.
24. Wagner A: Asymmetric functional divergence of duplicate
genes in yeast. Mol Biol Evol 2002, 19:1760-1768.
25. Baudot A, Jacq B, Brun C: A scale of functional divergence for
yeast duplicated genes revealed from analysis of the protein-
protein interaction network. Genome Biol 2004, 5:R76.
26. Conant GC, Wolfe KH: Functional partitioning of yeast co-
expression networks after genome duplication. PLoS Biol 2006,
4:e109.
27. Ashburner M, Ball CA, Blake JA, Botstein D, Butler H, Cherry JM,
Davis AP, Dolinski K, Dwight SS, Eppig JT, et al.: Gene ontology:
tool for the unification of biology. The Gene Ontology
Consortium. Nat Genet 2000, 25:25-29.
28. Jiang JJ, Conrath DW: Semantic Similarity based on Corpus Statistics and
Lexical Taxonomy Taiwan: ROCLING X; 1998.
29. Lin D: An information-theoretic definition of similarity.
[ />30. Resnik P: Semantic similarity in a taxonomy: an information-
based measure and its application to problems of ambiguity
in natural language. J Artificial Intelligence Res 1999, 11:95-130.
31. Cornell M, Paton NW, Oliver SG: A critical and integrated view
of the yeast interactome. Comparative Functional Genomics
2004:382-402.
32. Harris MA, Clark J, Ireland A, Lomax J, Ashburner M, Foulger R, Eil-
beck K, Lewis S, Marshall B, Mungall C, et al.: The Gene Ontology
(GO) database and informatics resource. Nucleic Acids Res
2004:D258-D261.
33. Lord PW, Stevens RD, Brass A, Goble CA:
Investigating semantic
similarity measures across the Gene Ontology: the relation-
ship between sequence and annotation. Bioinformatics 2003,
19:1275-1283.
34. Saccharomyces Gene Deletion Project [http://www-
sequence.stanford.edu/group/yeast_deletion_project/
deletions3.html]
35. Gu Z, Steinmetz LM, Gu X, Scharfe C, Davis RW, Li WH: Role of
duplicate genes in genetic robustness against null mutations.
Nature 2003, 421:63-66.
36. Veitia RA: Exploring the etiology of haploinsufficiency. Bioes-
says 2002, 24:175-184.
37. Papp B, Pal C, Hurst LD: Dosage sensitivity and the evolution of
gene families in yeast. Nature 2003, 424:194-197.
38. Mewes HW, Frishman D, Mayer KF, Munsterkotter M, Noubibou O,
Pagel P, Rattei T, Oesterheld M, Ruepp A, Stumpflen V: MIPS: anal-
ysis and annotation of proteins from whole genomes in 2005.
Nucleic Acids Res 2006, 34:D169-172.
39. Rottensteiner H, Kal AJ, Hamilton B, Ruis H, Tabak HF: A het-
erodimer of the Zn2Cys6 transcription factors Pip2p and
Oaf1p controls induction of genes encoding peroxisomal
proteins in Saccharomyces cerevisiae. Eur J Biochem 1997,
247:776-783.
Genome Biology 2007, Volume 8, Issue 10, Article R209 Hakes et al. R209.13
Genome Biology 2007, 8:R209
40. Bray D, Lay S: Computer-based analysis of the binding steps in
protein complex formation. Proc Natl Acad Sci USA 1997,
94:13493-13498.
41. Deutschbauer AM, Jaramillo DF, Proctor M, Kumm J, Hillenmeyer
ME, Davis RW, Nislow C, Giaever G: Mechanisms of haploinsuf-
ficiency revealed by genome-wide profiling in yeast. Genetics
2005, 169:1915-1925.
42. Aury JM, Jaillon O, Duret L, Noel B, Jubin C, Porcel BM, Segurens B,
Daubin V, Anthouard V, Aiach N, et al.: Global trends of whole-
genome duplications revealed by the ciliate Paramecium
tetraurelia. Nature 2006, 444:171-178.
43. Lynch M, Conery JS: The evolutionary fate and consequences of
duplicate genes. Science 2000, 290:1151-1155.
44. Wolfe KH, Shields DC: Molecular evidence for an ancient dupli-
cation of the entire yeast genome. Nature 1997, 387:708-713.
45. Conant GC, Wagner A: GenomeHistory: a software tool and its
application to fully sequenced genomes. Nucleic Acids Res 2002,
30:3378-3386.
46. Yang Z, Nielsen R: Estimating synonymous and nonsynony-
mous substitution rates under realistic evolutionary models.
Mol Biol Evol 2000, 17:32-43.
47. Yang Z: PAML: a program package for phylogenetic analysis
by maximum likelihood. Comput Appl Biosci 1997, 13:555-556.
48. Stark C, Breitkreutz BJ, Reguly T, Boucher L, Breitkreutz A, Tyers M:
BioGRID: a general repository for interaction datasets.
Nucleic Acids Res 2006, 34:D535-539.
49. Adai AT, Date SV, Wieland S, Marcotte EM: LGL: creating a map
of protein function with an algorithm for visualizing very
large biological networks. J Mol Biol 2004,
340:179-190.
50. Berriz GF, King OD, Bryant B, Sander C, Roth FP: Characterizing
gene sets with FuncAssociate. Bioinformatics 2003,
19:2502-2504.