Báo cáo y học: "A BAC clone fingerprinting approach to the detection of human genome rearrangements" docx
Bạn đang xem bản rút gọn của tài liệu. Xem và tải ngay bản đầy đủ của tài liệu tại đây (1.17 MB, 17 trang )
Open Access
Volume
et al.
Krzywinski
2007 8, Issue 10, Article R224
Method
A BAC clone fingerprinting approach to the detection of human
genome rearrangements
Martin Krzywinski*, Ian Bosdet*, Carrie Mathewson*, Natasja Wye*,
Jay Brebner†, Readman Chiu*, Richard Corbett*, Matthew Field*,
Darlene Lee*, Trevor Pugh*, Stas Volik†, Asim Siddiqui*, Steven Jones*,
Jacquie Schein*, Collin Collins† and Marco Marra*
Addresses: *BC Cancer Agency Genome Sciences Centre, West 7th Avenue, Vancouver, British Columbia, Canada V5Z 4S6. †Cancer Research
Institute, University of California at San Francisco, San Francisco, California, USA 94143-0808.
Correspondence: Marco Marra. Email:
Published: 22 October 2007
Genome Biology 2007, 8:R224 (doi:10.1186/gb-2007-8-10-r224)
Received: 30 April 2007
Revised: 28 August 2007
Accepted: 22 October 2007
The electronic version of this article is the complete one and can be
found online at />© 2007 Krzywinski et al.; licensee BioMed Central Ltd.
This is an open access article distributed under the terms of the Creative Commons Attribution License ( which
permits unrestricted use, distribution, and reproduction in any medium, provided the original work is properly cited.
for detecting and classifying rearrangements in the human genome.
Fingerprint Profiling rearrangements
Detecting human genome(FPP) is a new method which uses restriction digest fingerprints of bacterial artificial chromosome (BAC) clones
Abstract
We present a method, called fingerprint profiling (FPP), that uses restriction digest fingerprints of
bacterial artificial chromosome clones to detect and classify rearrangements in the human genome.
The approach uses alignment of experimental fingerprint patterns to in silico digests of the sequence
assembly and is capable of detecting micro-deletions (1-5 kb) and balanced rearrangements. Our
method has compelling potential for use as a whole-genome method for the identification and
characterization of human genome rearrangements.
Background
The phenomenon of genomic heterogeneity, and the implications of this heterogeneity to human phenotypic diversity and
disease, have recently been widely recognized [1-5], energizing efforts to develop catalogues of genomic variation [6-12].
Among efforts to understand the role and effect of genomic
variability, landmark studies have described changes in the
genetic landscape of both normal and diseased genomes [1315], the presence of heterogeneity at different length scales
[5,16] and variability within normal individuals of various
ethnicities [17-19]. Genome rearrangements have been
repeatedly linked to a variety of diseases, such as cancer [20]
and mental retardation [21], and the evolution of alterations
during disease progression continues to be an emphasis of
current studies.
Presently, various array-based methods, such as the 32 K bacterial artificial chromosome (BAC) array and Affy 100 K SNP
array [21-23], are the most common approaches to detecting
and localizing copy number variants, which are one class of
genomic variation. The ubiquity of arrays is largely due to the
fact that array experiments are relatively inexpensive, and
collect information genome-wide. The advent of high-density
oligonucleotide arrays, with probes spaced approximately
every 5 kb, has increased the resolution of array methods to
about 20-30 kb (multiple adjacent probes must confirm an
aberration to be statistically significant) [21]. Despite their
advantages, commonly available array-based methods have
several shortcomings. These include the inability to: detect
copy number neutral variants, such as balanced rearrangements; precisely delineate breakpoints and other fine structure details of genomic rearrangements; and directly provide
Genome Biology 2007, 8:R224
/>
Genome Biology 2007,
substrates for functional sequence-based characterization
once a rearrangement has been detected.
Clone-based approaches have been developed to study
genome structure, in part motivated by shortcomings of
array-based methods [16,24,25]. In addition to their use in
identifying both balanced and unbalanced rearrangements,
clones have the potential to be directly used as reagents for
downstream sequence characterization and cell-based functional studies [24]. Despite the advantages of clone-based
methods, relatively few studies have reported their use for
detecting and characterizing genomic rearrangements. End
sequences from fosmid clones have been compared to the
human reference genome sequence to catalogue human
genome structural variation [16]. End sequence profiling
(ESP) [25], which uses BAC end sequences, has been used to
study genomic rearrangements in MCF7 breast cancer cells
[24]. The principal drawbacks of clone-based methods are
cost and speed of data acquisition. For example, in the case of
end sequencing approaches that sample only the clone's termini, deeply redundant clone sampling would be required to
approach coverage of the human genome. This might require
millions of clones and end sequences. More tractable might
be an approach capable of sampling the entire insert of a
clone rather than only the ends, thereby enhancing coverage
of the target genome with fewer sampled clones. Clone coverage of the human genome could then be achieved with only a
small fraction of the clones required to achieve comparable
genome coverage in clone end sequences.
One method for sampling clone inserts is restriction fragment
clone fingerprinting, which has been used by us and others to
produce redundant clone maps of whole genomes [21,26-30].
Whole-genome clone mapping projects have shown that it is
possible to achieve saturation of mammalian genome coverage with 150,000-200,000 fingerprinted BACs, with the
number of BACs required inversely proportional to BAC
library insert sizes. This relatively tractable number of clones
suggests that whole genome surveys using BAC fingerprinting
are feasible. What is not known is whether fingerprints are
capable of identifying clones bearing genome rearrangements. In this study we address this question using computational simulations and fingerprint analysis of a small number
of BAC clones, previously characterized by ESP. We collected
restriction enzyme fingerprints from a set of 493 BACs that
represented regions of the MCF7 breast cancer cell line
genome. Using an alignment algorithm we developed (called
fingerprint profiling (FPP)), we fingerprinted clones and
aligned these fingerprints to locations on the reference
genome sequence and used the alignment profiles to detect
candidate genomic rearrangements. Our analysis reveals fingerprint analysis can detect small focal rearrangements and
more complex events occurring within the span of a single
clone. By varying the number of fingerprints collected for a
clone, the sensitivity of FPP can be tuned to balance throughput with satisfactory detection performance. We also show
Volume 8, Issue 10, Article R224
Krzywinski et al. R224.2
that FPP is relatively insensitive to certain sequence repeats.
Our analysis is compatible with the concept of using clone fingerprinting to profile entire genomes in screens for genome
rearrangements.
Results
We explored the utility of FPP for the identification of genome
rearrangements. The method involved generating one or
more fingerprint patterns by digesting clones with several
restriction enzymes, and comparing these patterns to in silico
digests of the reference human genome sequence. Differences
detected in this comparison identified the coordinates of candidate genome rearrangements.
Restriction enzyme selection
We analyzed the distribution of recognition sequences for
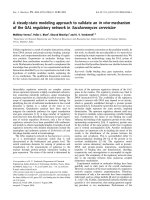
4,060 restriction enzyme combinations (Figure 1) on human
chromosome 7 (Materials and methods). From this, we identified five restriction enzyme combinations of potential utility
for FPP. All five combinations included HindIII and EcoRI,
and one of: BclI/BglII/PvuII, BalI/BclI/BglII, NcoI/PvuII/
XbaI, Bcl/NcoI/PvuII, or BglII/NcoI/PvuII. Each of these
combinations represented at least 99.98% of the
chromosome7 sequence in restriction fragments of sizes that
are generally accurately determined using our BAC clone fingerprinting method. Ultimately, we selected the combination
HindIII/EcoRI/BglII/NcoI/PvuII for its desirable cut site
distribution, ease of use in the laboratory and our favorable
experience with the high quality of fingerprints from these
enzymes.
Theoretical sensitivity of fingerprint alignments
To demonstrate that fingerprint patterns are sufficiently
complex to uniquely identify genomic intervals, we devised in
silico simulations to determine specificities of fingerprint
fragments and patterns and to align virtual clones with simulated rearrangement breakpoints to the reference genome
sequence.
We computed the fragment specificity for a given fragment as
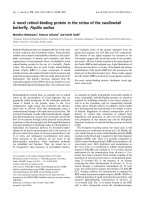
the fraction of fragments in the genome that are experimentally indistinguishable in size (Materials and methods). Figure 2 shows the specificity for an individual HindIII fragment
of a given size in the human genome (hg17), and depicts the
practical specificity where experimental sizing error is used to
determine whether fragment sizes can be distinguished. Our
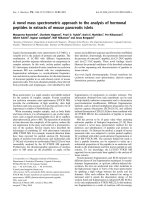
sizing error depends on fragment size (Figure 3), effectively
dividing the sizing range into approximately 380 unique bins.
Also depicted is the case of exact sizing, where fragments are
considered indistinguishable only if their sizes are identical.
Although exact sizing is not possible in the laboratory, we
include the case of exact sizing here because it represents the
theoretical best possible performance of FPP with the
enzymes we selected, and because it helps to contrast FPP's
practical performance.
Genome Biology 2007, 8:R224
/>
Genome Biology 2007,
Volume 8, Issue 10, Article R224
Krzywinski et al. R224.3
Figure 1
Desirability ranking of 4,060 five-enzyme combinations
Desirability ranking of 4,060 five-enzyme combinations. We determined desirability of enzyme combinations based on S(n), defined as the fraction of the
chromosome 7 that is represented by restriction fragments in the range 1-20 kb (a subset of our sizing range within which sizing accuracy is increased) for
≥n enzymes. Enzyme combinations with high values of S(n) are desirable because a large fraction of fragments in their fingerprint patterns can be accurately
sized and because the number of large fragment covers found in regions represented exclusively by large fragments in all digests is minimized. Points
represented by hollow glyphs correspond to enzyme combinations which achieved rank in top 10% for each of S(n = 1..5).
This analysis revealed that HindIII fingerprints with approximately 15 fragments exhibit a high degree of specificity, as
only approximately 1.5% of the genome cannot be uniquely
distinguished using patterns composed of this number of
fragments. This high specificity results from accurate experimental fragment sizing, and from the fact that the length of
genomic repeats is generally much shorter than restriction
fragments. Therefore, a specific combination of adjacent fragment sizes represents a relatively unique event in the human
genome.
To evaluate the accuracy and sensitivity of actual fingerprint
alignments, we performed an in silico study (Materials and
methods), in which we computationally generated virtual
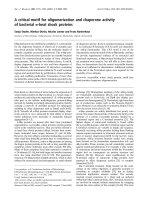
clones containing simulated genomic rearrangement breakpoints and used these fingerprints as inputs into the alignment algorithm. Figure 4 illustrates the sensitivity and
positional accuracy of the mapping of these synthetic clones
as a function of the number of digests and segment size. When
a single HindIII fingerprint digest is used, we successfully
aligned 50% of 35 kb segments. This cutoff size can be
decreased to 25 kb if two digests are used (HindIII/EcoRI)
and to 16 kb if five digests are used (HindIII/EcoRI/BglII/
NcoI/PstII). The number of digests used has a large impact
on the smallest alignable segment size due to the fact that the
positions of cut sites of distinct enzymes are generally
Genome Biology 2007, 8:R224
/>
Genome Biology 2007,
Volume 8, Issue 10, Article R224
Krzywinski et al. R224.4
For example, if we wish to identify a breakpoint in 90% of
simulated cloned rearrangements, then the shortest rearrangements that can be detected for 1, 2, 3, 4 and 5 digests are
60, 45, 34, 28, and 25 kb, respectively. Stated differently, one
can be 90% certain that when using 5 enzymes, a segment of
length 25 kb within a BAC would be sufficient to identify the
BAC as bearing a genome rearrangement.
Figure 4 shows the median distance between the left and right
edges of the alignment and known segment spans for segments of varying sizes. While the values for 10 kb segments
are difficult to interpret because of relatively few successful
alignments, the error is otherwise constant for segment sizes
and depends primarily on the number of digests. The error is
3.0 kb for an alignment based on a single digest and drops to
1.7 kb when two digests are used. When the number of digests
is increased to 5, the error drops as low as 700 base-pairs
(bp).
MCF7 clone fingerprint-based alignments
Figure 2 of individual tolerance
and experimental sizingrestriction fragments and patterns based on exact
Specificity
Specificity of individual restriction fragments and patterns based on exact
and experimental sizing tolerance. (a) HindIII restriction fragment
specificity for the human genome for fragments within the experimental
size range of 500 bp to 30 kb. For a given fragment size, the vertical scale
represents the fraction of fragments in the genome that are
indistinguishable by size in the case of either exact sizing (fragments in
common between two fingerprints must be of identical size) or within
experimental tolerance (fragments in common between two fingerprints
must be within experimental sizing error; Figure 3) on a fingerprinting gel.
When sizing is exact, fragment specificity follows approximately the
exponential distribution of fragment sizes and spans a range of 3.5 orders
of magnitude. When experimental tolerance is included, the number of
distinguishable fragment size bins is reduced and the range of fragment
specificity drops to two orders of magnitude. (b) The specificity of a
fingerprint pattern of a given size in the human genome. Fingerprint
pattern size is measured in terms of number of fragments. Regions with
identical patterns are those in which there is a 1:1 mapping within
tolerance between all sizeable fragments. The specificity of experimental
fingerprint patterns is cumulatively affected by specificity of individual
fragments. The specificity of fragments is sufficiently low (that is, due to
high experimental precision) so that 96.5% of the genome is uniquely
represented by fragment patterns of 8 fragments or more.
uncorrelated and that the individual digest patterns can be
aligned independently and used together to increase sensitivity. Figure 4 suggests the number of digests that would be
required to detect 90% of rearrangements of a certain size.
With knowledge gained from our simulations, we sought to
apply FPP to a test set of 493 BAC clones derived from the
MCF7 breast cancer cell line. Each clone was fingerprinted
and aligned to the genome with FPP, and the results of the
alignments were compared to alignments performed using
BAC end sequences (Materials and methods, Additional data
file 2). Alignments were evaluated based on their size and
number, with multiple alignments indicating identification of
a candidate rearrangement. We were able to obtain FPP
alignments for 487/493 of the clones. On average, we were
able to map 88% of a clone's fingerprint fragments to the
genome, and 90% of clones had more than 72% of their fingerprint fragments mapped. Table 1 summarizes FPP and
ESP rearrangement detection and Table 2 shows a detailed
comparison of rearrangement detection for clones that had
an FPP alignment that indicated a breakpoint. The positional
accuracy of FPP alignments is shown in Table 3.
Because ESP uses BAC end sequences that produce data for
only the ends of clones, ESP has limited capacity to localize
the locations of rearrangement breakpoints within clones. To
investigate the precision of FPP in defining the position of
breakpoints within BACs, we used clone alignments spanning
regions of chromosomes 1, 3, 17 and 20 that contained known
breakpoints. We selected these regions because of the
enriched coverage provided by our test clone set. The breakpoint position was determined to be the average FPP alignment position with the error given by the standard deviation
of the alignments. Additional data file 2 shows the layout of
these breakpoints in the MCF7 genome and all FPP and ESP
alignments for clones in these regions. Additional data file 3
expands several of the regions from Additional data file 2, and
illustrates the relative position of FPP and ESP alignments.
Additional data file 6 further increases the detail shown in
Additional data file 2, depicting restriction maps and fragment matching status within each clone alignment for all five
Genome Biology 2007, 8:R224
/>
Genome Biology 2007,
Volume 8, Issue 10, Article R224
Krzywinski et al. R224.5
Figure 3
Experimental error of fragment sizing within the 0.5-30 kb sizing range of our single digest protocol
Experimental error of fragment sizing within the 0.5-30 kb sizing range of our single digest protocol. The error is expressed in relative size (left axis) and
standard mobility (right axis). Standard mobility is a distance unit that takes into account inter-gel variation and is approximately linear with the distance
traveled by the fragment on the gel.
enzymes. We found 51 breakpoints in 118 unique clones
(Table 4). We tested the presence of breakpoints in three
clones using PCR (Table 5), and demonstrated the presence of
PCR products (Figure 5) to verify fusions within the clone's
insert of regions non-adjacent in the reference genome
sequence.
To demonstrate that FPP can resolve complex rearrangements, we closely examined the FPP results for clone 3F5. In
the original MCF7 ESP analysis, Volik et al. [25] concluded
that the shotgun sequence assembly of this clone is highly
rearranged and composed of five distant regions of chromosomes 3 and 20 (3p14.1, 20q13.2, 20q13, 20q13.3 and
20q13.2). Our FPP analysis generally recapitulated the shotgun sequencing results - out of the five distinct insert segments found by sequencing, we detected four (Figure 6;
detailed fingerprint alignments are shown in Additional data
file 4; individual restriction fragment accounting is shown in
Additional data file 5). The fifth segment, sized at 4,695 bp
based on alignment of the clone's sequence to the reference
genome, lacked the fragment complexity to confidently identify it by FPP. This small segment includes only two entire
restriction fragments (marked with asterisks in the following
list of intersecting fragments) in the restriction map of our
enzyme combination (HindIII, 1 fragment (7.4 kb); EcoRI, 3
fragments (7.2 kb, 0.9 kb*, 8.5 kb); BglII, 2 fragments (4.1 kb,
8.6 kb); NcoII, 3 fragments (2.0 kb, 1.9 kb*, 6.2 kb); PvuII, 2
fragments (5.8 kb, 13.1 kb)).
Micro-rearrangements
Fingerprints provide a representation of the entire length of a
clone's insert and, thus, are capable of mapping genome rearrangements internal to the clone insert that do not involve the
ends of the clone. We identified 17 such small-scale candidate
aberrations, and validated 4 of these using PCR (Table 6, Figure 7). PCR analysis of clone 12G17 yielded an amplicon
Genome Biology 2007, 8:R224
/>
Genome Biology 2007,
Volume 8, Issue 10, Article R224
Krzywinski et al. R224.6
Discussion
Using computational simulations and restriction fingerprinting of a small number of BAC clones, we assessed the utility of
clone fingerprints in detecting genomic rearrangements. We
fingerprinted 493 BAC clones derived from the MCF7 breast
cancer cell line genome that were previously analyzed by ESP
[25]. Using the clone fingerprints, we aligned the clones to the
reference genome sequence assembly (UCSC, hg17) and have
mapped the candidate positions of 51 rearrangement breakpoints and 17 micro-rearrangements within clones in the set.
Further, we identified other rearrangement events within the
clone set that were cryptic to ESP.
Figure 4
detection results of sensitivity and spatial tolerance
Simulationby FPP using experimental sizing error of rearrangement
Simulation results of sensitivity and spatial error of rearrangement
detection by FPP using experimental sizing tolerance. (a) Sensitivity is
measured as the fraction of clone regions of a given size with successful
FPP alignments and is plotted for five digests (labeled 1-5). (b) Spatial
error is measured by the median distance between FPP and theoretical
alignment positions. The largest improvement in both sensitivity and
spatial error is realized by migrating FPP from one digest to two. With
two fingerprint patterns used to align the clone, 50% of >25 kb clone
regions are aligned (90% of >45 kb regions) with a spatial error of 1.7 kb.
approximately 400 bp smaller than expected, which supports
the observation that experimental fragments were approximately 300 bp smaller than expected in this area. The fingerprint results are consistent with a hypothesis of a loss of a 313
bp SINE element evident in the genome sequence for this
region. PCR analysis of clone 15O22 indicated an insertion of
approximately 560 bp relative to the reference genome
sequence. The experimental fragments nearest to the
unmatched in silico fragments in this clone's fingerprints are
all about 300 bp larger than expected. The results are
consistent with a hypothesis of increased copy number of Alu
(300 bp) or SINE (100 bp) elements evident in the genome
sequence of this region.
The use of fingerprints to detect rearrangements provides
several advantages, based on the fact that fingerprints sample
essentially all of a clone's insert. First, at equivalent sampling
depths, the position of a rearrangement breakpoint within a
clone can be more precisely determined using FPP than with
ESP. Second, fingerprint patterns can be used to locate differences internal to the insert between the clone and the reference genome. This advantage, which is not shared by ESP
(Additional data files 2 and 3), can be leveraged to detect
small rearrangements such as single nucleotide polymorphisms, micro-deletions, micro-insertions or other local rearrangements. There is currently no experimental method that
can be applied on a whole-genome level that is sensitive to the
identification of both balanced and unbalanced rearrangements on the order of 1-5 kb in size within the genome. While
extremely high-density oligonucleotide arrays can, in principle, detect aberrations with a spatial frequency equal to probe
spacing, confirmation of multiple adjacent probes are
required to assign statistical significance to the result. Finally,
a major strength of fingerprint alignments is their relative
insensitivity to sequence repeats. Although approximately
50% of the human genome sequence assembly (hg17) lies in
repeat regions, only 7% is found in contiguous repeat units
longer than 3.9 kb, which is the average sizeable HindIII
restriction fragment.
Fingerprint-based alignments confirmed a lack of rearrangement in the vast majority of clones (96%) and also confirmed
the presence of rearrangements in 68% of those clones in the
test set whose ESP data indicated a breakpoint. The high level
of confirmation of clone integrity reflects the low incidence of
false-positive alignments for clones derived from a single
location. The fraction of rearrangements detected is lower
than in ESP due to the inherent limitation of fingerprintbased alignments to align small regions of the genome. The
use of larger BACs or greater levels of coverage redundancy
(Figure 8) would be expected to address a significant portion
of these apparent false-negative FPP results.
A number of studies (reviewed in [31]) have reported on the
increasing prevalence of human genome structural alterations in both healthy and diseased individuals. Much of the
work has been done using genome-wide microarray
Genome Biology 2007, 8:R224
/>
Genome Biology 2007,
Volume 8, Issue 10, Article R224
Krzywinski et al. R224.7
Table 1
Comparison of number of rearrangements detected by ESP and FPP in a 487 MCF7 BACs
ESP
N
Y
No. of clones
Disagree
N
250
243
2b/5c
Ya
FPP
Agree
11
8
No. of clones
2f/1g
No. agree
No. disagree
72
3
63d/6e
154
126
26h/2i
The clones are partitioned based on whether a rearrangement was detected by ESP and/or FPP. For each combination of detection (for example, FPP
= Y, ESP = N, where Y/N indicates the presence/absence of rearrangement, respectively, as measured by the corresponding method), the table
shows the number of clones in this category, which is further broken down into the number of clones in which ESP and FPP mappings agreed and the
number of clones for which ESP and FPP mappings did not agree (for example, both can show no rearrangement but disagree about clone position).
Clones in the 'Agree' column have an FPP alignment within 50 kb of both end sequence alignments. Clones in the 'Disagree' column are reported as
two groups: clones with an FPP alignment agreeing with one end sequence alignment and clones for which no agreement with either end sequence
alignment was detected. Both groups with the disagree category are annotated with a reason for the disagreement. aClones in this row are further
classified based on the number of FPP alignments in Table 2. bDel (2); cmispick (5); dbne (33), hr (14), lowcomplex (1), nip (10), rep (5); elowcomplex
(1), mispick (3), rep (2); frep (2); gmispick (1); hbne (14), hr (8), nip (3), rep (1); ibne (1), mispick (1). Bne, breakpoint near end of clone; del, clone
appears deleted; hr, highly rearranged; lowcomplex, fingerprint has very few fragments; mispick, FPP/ESP data mismatch; nip, FPP alignment detected
but not added to partition; rep, alignments in repeat regions.
Table 2
Profile of candidate rearrangements detected by FPP
ESP
N
Y
No. of clones
Disagree
No. of clones
No. agree
No. disagree
2
11
8
1/2
123
101
22/0
3
0
-
-
29
22
5/2
4
FPP alignments
Agree
0
-
-
2
2
0/0
Clones are grouped in rows by the number of distinct FPP alignments. For each group, the clones are partitioned based on whether ESP detected a
rearrangement. Clones in the 'Agree' column have an FPP alignment within 50 kb of both end sequence alignments. Clones in the 'Disagree' column
are partitioned in the same manner as in Table 1.
Table 3
Positional accuracy of FPP alignments
Clone ends*
Clones†
<1 kb
50%
28%
<2 kb
70%
50%
<5 kb
88%
79%
<10 kb
96%
93%
<25 kb
99%
98%
<50 kb
100%
100%
|FPP-BES|
Accuracy was measured by comparing the distance between the positions of end sequence alignments and nearest edge of an FPP alignment. For this
comparison the subset of clones for which ESP and FPP agreed in both rearrangement detection and mapping position (243 + 126 = 369 clones;
Table 1) was used. *Cumulative distribution of nearest distances between FPP and individual BES alignments, mini|FPPi-BES|. †Cumulative distribution
of maxj(mini|FPPi-BESj|) - the larger of two distances between a clone's FPP and BES alignments
Genome Biology 2007, 8:R224
/>
Genome Biology 2007,
Volume 8, Issue 10, Article R224
Table 4
Location of breakpoints in the MCF7 genome in regions sampled by clones on chromosomes 1, 3, 17 and 20
ID
Chromosome
Position
Uncertainty
1L
1
106446622
2L
1
107325668
0
Clones
M0035E03
M0090F09 M0095D18
3R
1
107642673
1,640
4L
1
112083301
957
5R
1
112119925
0
6R
3
62612471
856
M0012A19 M0041A24
7L
3
63679826
757
M0005P04 M0007J14 M0030P20 M0043O24 M0093C20 M0134N23
M0143D18 M0150I03 M0156K22
8R
3
63716623
1,755
M0005P04 M0007J14 M0030P20 M0043O24 M0093C20 M0107G11
M0134N23 M0137G17 M0143D18 M0150I03 M0151M05 M0156K22
8,740
M0007J14 M0030P20 M0037J18 M0043O24 M0066M03 M0067H12
M0073I23 M0093C20 M0107G11 M0124I19 M0134N23 M0137G17
M0143D18 M0150I03 M0151M05 M0156K22
9R
3
63908884
10L
3
63954937
M0012O05 M0064A13 M0089C03 M0090K07 M0126M04 M0152M23
M0035A16 M0039B19 M0041G20 M0043K05 M0062P11 M0078P07
M0080G18 M0086B04 M0086C02 M0090F09 M0091L21 M0168M09
M0090F09 M0095D18
M0035E03
11R
3
63995878
0
12L
3
63997257
1,178
M0066M03 M0067H12 M0124I19 M0137G17
M0003F05 M0031O08 M0039A05 M0088O13 M0145B06
13R
3
64074753
3,228
M0014E11 M0031O08 M0088O13 M0144L06 M0145B06
14L
3
64660949
0
M0012A19 M0041A24
15R
3
64927120
304
M0006B19 M0014P03
16L
17
54050256
11,312
M0037J18 M0066C22
17R
17
54158022
0
18L
17
54397666
9,801
M0035A16 M0039B19 M0041G20 M0043K05 M0062P11 M0078P07
M0080G18 M0086B04 M0086C02 M0090F09 M0090P15 M0091L21
M0095D18 M0168M09
19R
17
54549098
6,065
M0009I10 M0013G05 M0105A20 M0107H09
20L
17
55260098
5,548
M0001M18 M0009I10 M0013G05 M0107H09
21R
17
55468383
15,761
M0001M18 M0090P15 M0092G06
22L
17
56176919
163
23R
17
56206584
1,204
M0064A13 M0089C03 M0090K07 M0126M04 M0152M23
24R
17
56233933
3,684
M0005P04 M0007J14 M0030P20 M0043O24 M0093C20 M0134N23
M0143D18 M0150I03
25L
17
56644007
1,148
M0005I19 M0045E13 M0054A01 M0054C03 M0058D14 M0058K11
M0059J17 M0062L13 M0077L13 M0089F05 M0089I18 M0094M14
M0107O02 M0124A06 M0132D17 M0138H21 M0145N09 M0147K12
M0148L05 M0159O13 M0160H16 M0165D22
26L
17
56961440
27R
17
57339860
1,364
M0024G06 M0123G10 M0155O05 M0156I16
28L
17
59745950
6,571
M0006B19 M0014P03
29R
17
59781552
688
M0006B19 M0014P03
30L
20
38948829
31L
20
40249289
2,622
M0003F05 M0031O08 M0039A05 M0043G01 M0145B06
32R
20
40271873
1,207
M0003F05 M0031O08 M0039A05 M0043G01 M0088O13 M0145B06
33R
20
40664609
34L
20
45230184
278
M0001A11 M0010D13 M0026L11 M0028H13 M0031E14 M0038G05
M0038P15 M0041B14 M0055I11 M0080H12 M0108H05 M0129A15
M0135D20 M0151F12 M0162M24 M0167J20
35L
20
45736731
36L
20
45847023
37L
20
46174956
38L
20
48694494
M0037J18 M0073I23
M0089C03 M0090K07 M0126M04 M0152M23
M0021C24
M0011K13
M0011K13
M0021C24
1,846
M0014E11 M0088O13 M0144L06
M0159C23
933
M0001A11 M0055I11 M0151F12
Genome Biology 2007, 8:R224
Krzywinski et al. R224.8
/>
Genome Biology 2007,
Volume 8, Issue 10, Article R224
Krzywinski et al. R224.9
Table 4 (Continued)
Location of breakpoints in the MCF7 genome in regions sampled by clones on chromosomes 1, 3, 17 and 20
39L
20
48729868
6,077
M0010D13 M0026L11 M0028H13 M0031E14 M0038G05 M0038P15
M0041B14 M0080H12 M0108H05 M0129A15 M0135D20 M0162M24
M0165D22 M0167J20
40R
20
48863824
720
M0001A11 M0005I19 M0045E13 M0054A01 M0054C03 M0058D14
M0058K11 M0059J17 M0062L13 M0069H04 M0077L13 M0089F05
M0089I18 M0094M14 M0107O02 M0124A06 M0132D17 M0138H21
M0145N09 M0147K12 M0148L05 M0159O13 M0160H16 M0165D22
41L
20
51618225
4,895
M0003F05 M0005H09 M0008J22 M0029C09 M0031O08 M0036L24
M0043G01 M0071O17 M0075M20 M0077H17 M0090K04 M0100O14
M0116C01 M0132B21 M0145O12 M0159P14
42R
20
52046458
2,367
M0066M03 M0067H12 M0124I19 M0137G17
43R
20
52066649
126
44R
20
52248474
45R
20
52985221
46R
20
53545530
0
47L
20
55122587
853
48L
20
55254895
3,310
M0003F05 M0031O08 M0036L24 M0039A05 M0043G01 M0071O17
M0132B21 M0145B06 M0159C23
49R
20
55287488
1,269
M0003F05 M0005H09 M0008J22 M0029C09 M0031O08 M0036L24
M0039A05 M0043G01 M0071O17 M0075M20 M0077H17 M0090K04
M0100O14 M0116C01 M0132B21 M0145B06 M0145O12 M0159C23
M0159P14
50L
20
59150999
936
M0036B13 M0141F19
51R
20
59176749
0
M0036B13 M0141F19
M0012O05 M0089C03 M0152M23
M0066C22
M0014P03
M0036B13 M0141F19
M0024G06 M0123G10 M0155O05 M0156I16
Breakpoint position is the average position of blunt alignment ends with the standard deviation of these quantities taken as the uncertainty.
Breakpoint ID is composed of a unique numerical index and L/R suffix that indicates which edge of the FPP alignment (left/right) is considered to be
the breakpoint.
technologies, and the median lengths of many of the structural alterations reported are in the range of tens to hundreds
of kilobases or more [32]. These lengths correspond to the
resolutions possible using the microarray technologies
employed for these studies. The resolving power of the FPP
approach we report here improves upon the resolution possible with commonly available microarray platforms, and could
easily be applied to whole genome characterization. We
believe characterization of tens to hundreds of human
genome samples using FPP would provide a powerful data set
from which to deduce the lengths and types of genome rearrangements in human populations, as well as providing information on the sequences affected and flanking such
rearrangements.
Table 5
PCR primers used to validate the presence of breakpoints detected by fingerprints
Left primer
Primer
transform
Sequence
Right primer
Position
Chr
Start (bp)
Sequence
End (bp)
Position
Chr
Start (bp)
End (bp)
M0092D11
ar+ br+
TGCTAAATTTCCCAAGTGCC
20
45,794,352
45,794,371
CCGTCCTCTTAGCGAACTTG
20
46,968,304
46,968,323
ar+ br-
TGCTAAATTTCCCAAGTGCC
20
45,794,352
45,794,371
AATTTCAAAATGCGTCTGGG
20
46,968,631
46,968,650
ar+ bl+
TGCTAAATTTCCCAAGTGCC
20
45,794,352
45,794,371
TGACACGCAGGGTAGATCAG
20
46,923,060
46,923,079
ar+ bl-
TGCTAAATTTCCCAAGTGCC
20
45,794,352
45,794,371
TCCAACAGGAAGGAGTACCG
20
46,922,743
46,922,762
al+ br+
CTCTCTTTTGTGGGACGAGC
20
45,718,752
45,718,771
CCGTCCTCTTAGCGAACTTG
20
46,968,304
46,968,323
al+ br-
CTCTCTTTTGTGGGACGAGC
20
45,718,752
45,718,771
AATTTCAAAATGCGTCTGGG
20
46,968,631
46,968,650
al+ bl+
CTCTCTTTTGTGGGACGAGC
20
45,718,752
45,718,771
TGACACGCAGGGTAGATCAG
20
46,923,060
46,923,079
al+ bl-
CTCTCTTTTGTGGGACGAGC
20
45,718,752
45,718,771
TCCAACAGGAAGGAGTACCG
20
46,922,743
46,922,762
Genome Biology 2007, 8:R224
/>
Genome Biology 2007,
Volume 8, Issue 10, Article R224
Krzywinski et al. R224.10
Table 5 (Continued)
PCR primers used to validate the presence of breakpoints detected by fingerprints
M0107O02
br+ ar+
AATAGAAGCCAGGCATGGTG
20
48,861,156
48,861,175
GTTAGGAGGAGGGTGGAACC
17
56,663,181
56,663,200
br+ ar-
AATAGAAGCCAGGCATGGTG
20
48,861,156
48,861,175
TAGCCGTTCTGACTGGTGTG
17
56,663,261
56,663,280
br+ al+
AATAGAAGCCAGGCATGGTG
20
48,861,156
48,861,175
TAGCTGGGATTACAGGTGCC
17
56,646,379
56,646,398
br+ al-
AATAGAAGCCAGGCATGGTG
20
48,861,156
48,861,175
ACAACCTGTCCGACCAGAAC
17
56,646,305
56,646,324
ar+ cr+
GGACAGAGGCTTTTGTAGCG
17
56,687,628
56,687,647
ACCACGTAGACAAAGACGGG
20
59,173,964
59,173,983
ar+ cr-
GGACAGAGGCTTTTGTAGCG
17
56,687,628
56,687,647
TTCTGGATTCTCCTTGGTGC
20
59,173,950
59,173,969
ar+ cl+
GGACAGAGGCTTTTGTAGCG
17
56,687,628
56,687,647
ATTTGGTTCCTGGTGAGTGC
20
59,153,746
59,153,765
ar+ cl-
GGACAGAGGCTTTTGTAGCG
17
56,687,628
56,687,647
AGAAGAACCCGACGACATTG
20
59,153,849
59,153,868
br+ cr+
TATCCTTCAGGAATCGCCAC
20
53,542,992
53,543,011
ACCACGTAGACAAAGACGGG
20
59,173,964
59,173,983
br+ cr-
TATCCTTCAGGAATCGCCAC
20
53,542,992
53,543,011
TTCTGGATTCTCCTTGGTGC
20
59,173,950
59,173,969
br+ cl+
TATCCTTCAGGAATCGCCAC
20
53,542,992
53,543,011
ATTTGGTTCCTGGTGAGTGC
20
59,153,746
59,153,765
br+ cl-
TATCCTTCAGGAATCGCCAC
20
53,542,992
53,543,011
AGAAGAACCCGACGACATTG
20
59,153,849
59,153,868
M0141F19
Primer sequence is the appropriately transformed (reversed, complemented, reverse-complemented) primer sequence to test a specific order/
orientation of clone regions within the insert. Products were detected for reactions where the primer transform field is in bold. Primer
combinations (e.g. ar+ br+) correspond to order and orientation of putative rearrangement and are described in detail in Additional data file 1.
Conclusion
In silico simulations: sequence assembly digest
To explore the utility of fingerprint-based rearrangement
detection, we used computational simulations and
fingerprinted a set of clones derived from the MCF7 breast
tumor cell line for which ESP data were available [25]. By collecting multiple fingerprints obtained with different enzymes
for each clone and comparing FPP and ESP results for the
same clones, we were able to conclude that FPP is well-suited
for accurate study of genomic differences. Moreover, we were
able to define the boundaries of differences between the reference and MCF7 genomes more precisely than with ESP, and
to demonstrate complex rearrangements with FPP that otherwise required BAC shotgun sequencing to fully characterize.
Using a set of 493 clones from the MCF7 BAC library sampled
primarily to represent content from chromosomes 1, 3, 17 and
20, we used 5 fingerprints to identify 51 breakpoints within
the regions sampled by the clones with a median positional
error of 2 kb. We were able to reconcile the ESP and FPP data
sets and used in silico simulations to explore the practical
limitations of FPP. Based on our observations, we feel FPP
has compelling potential to be used as a whole-genome
method to identify and characterize human genome
rearrangements.
Materials and methods
Here we describe the computational and algorithmic components of FPP. The sections broadly comprise generation of
target fingerprint patterns and pattern matching, theoretical
considerations in generating and using fingerprints for alignment, description of an experimental data set to characterize
FPP performance and a detailed description of the FPP
algorithm.
We performed in silico simulations to explore the theoretical
limitations of using fingerprints to unambiguously identify
genomic regions. We used the UCSC May 2004 (hg17) assembly of the human genome for these simulations, using in silico
digests of sequence assemblies of each chromosome (1-22, X,
Y). For each in silico digest the size and start/end position for
all restriction fragments were calculated and stored. To generate virtual clone fingerprints, groups of adjacent restriction
fragments were randomly sampled in accordance with a
hypothetical clone size distribution. During the sampling
process, we avoided regions of the sequence assemblies that
contained undetermined base pairs.
In silico simulations: fingerprint comparison
We calculated similarity between fingerprint patterns using
Needleman-Wunsch global alignment [33]. The similarity of
two fingerprint patterns was proportional to the number of
fragments that were common between fingerprints being
compared. Common fragments were defined as fragments
whose sizes were equal within measurement error (Additional data file 1). Such fragments have experimentally indistinguishable electrophoretic mobilities. For an estimate of
experimental sizing error, we used values obtained from comparing fingerprints of sequenced BAC clones to their computationally predicted counterparts (Figure 3).
In silico simulations: fragment and fingerprint
specificity
The degree to which a fingerprint pattern can uniquely represent a genomic region is directly proportional to the efficiency
of FPP. See Additional data file 1 for a description of the
method used to calculate specificity shown in Figure 2.
Genome Biology 2007, 8:R224
/>
Genome Biology 2007,
Volume 8, Issue 10, Article R224
Krzywinski et al. R224.11
Figure 5
PCR reactions validating the presence of breakpoints in clones listed in Table 5
PCR reactions validating the presence of breakpoints in clones listed in Table 5. Each reaction is labeled by the primer combination (e.g. AR+ CL+) used to
test order and orientation of the clone's fused regions (Materials and methods; primer combination nomenculature is described in detail in Additional data
file 1). The presence of a product demonstrates the adjacency of the regions within the clone's insert.
In silico simulations: enzyme selection
The choice of restriction enzymes affects the effectiveness of
FPP - ideal enzymes are those which cut frequently and in a
complementary manner, with cut sites of one enzyme
populating regions where another enzyme lacks them. See
Additional data file 1 for a description of the simulation performed to select an optimal combination of 5 enzymes.
In silico simulations: generation of virtual clone
fingerprints to determine fingerprint-based alignment
accuracy
To determine the theoretical performance of fingerprintbased alignment accuracy and the sensitivity and specificity
of rearrangement breakpoint detection, we generated in silico
fingerprint patterns of hypothetical clones derived from a
genomic region that contained a simulated breakpoint. To
simulate a clone harboring a breakpoint, a fingerprint pattern
was created by combining two groups of fragments
Genome Biology 2007, 8:R224
/>
Genome Biology 2007,
Volume 8, Issue 10, Article R224
Krzywinski et al. R224.12
Figure
Detailed6reconciliation of sequence and fingerprint alignments for clone 3F05, which contains at least four internal breakpoints
Detailed reconciliation of sequence and fingerprint alignments for clone 3F05, which contains at least four internal breakpoints. FPP is capable of dissecting
complex rearrangements in a clone, as illustrated in this figure showing the internal structure of M0003F05. This BAC was sequenced [26] and found to be
composed of content from at least five distinct regions (A-E). FPP detected 4/5 of these regions. BLAT (grey rectangles with alignment orientation arrows)
and FPP (thin black lines) alignments of M0003F05 are shown; values underneath coordinate pairs are differences in edge positions between BLAT and FPP
alignments.
Table 6
Location of 17 putative small-scale aberrations identified in MCF7 clones
Aberration position and size
End (bp)
PCR validation
Chr.
Start (bp)
Size (bp)
Affected/
all clones
Sampled clone*
1
54,737,944
54,742,444
4,500
1/1
15,468,892
15,471,992
3,100
1/1
M0015O22
2
110,086,572
110,101,972
15,400
1/1
Primers
Products (bp)
D
GGGGCCCTTTAGTGCCTTAG
AATTGCCAAGTCAGAGGCAG
4,686
5,251 (+565)
B
TACTTACGGCAGAGGTTGGG
TCTGATTTTGGAGCTTTTGG
6,411
6,017 (-394)
A
CTTGGGTTGGGAACTGAAAG
CCTCTTCTGGGACTGCTGAC
28,006
4,925 (-23,081)
C
CCCACCAATGGATTACAACC
CTTGAACCTGGGAAGCAGAG
7,828
4,971 (-2,857)
M0025G14
2
Reaction†
M0006P20
3
63,591,911
63,594,011
2,100
2/5
M0118E13
3
159,597,920
159,602,020
4,100
1/1
M0012G17
4
13,455,944
13,464,544
8,600
1/1
M0004J18
5
177,652,902
177,661,002
8,100
1/1
M0019C11
10
45,658,295
45,662,695
4,400
1/1
M0021J21
18
13,660,940
13,670,040
9,100
1/1
M0040N18
19
46,075,421
46,081,021
5,600
1/1
M0005H04
20
8,877,965
8,903,965
26,000
1/1
M0013M22
20
39,042,929
39,047,029
4,100
1/1
M0011K13
20
48,823,455
48,827,555
4,100
3/21
M0107O02
20
51,886,035
51,891,935
5,900
1/1
M0089C13
20
52,157,503
52,161,003
3,500
1/1
M0004L22
20
59,158,037
59,163,037
5,000
1/2
M0141F19
X
97,281,472
97,287,472
6,000
1/1
M0018J12
Four aberrations were tested with PCR using the primers shown here. The expected primer products based on inter-primer distance on the
reference genome are shown in bold, with the observed product sizes shown below. *See Additional data file 2. †See Figure 7.
Genome Biology 2007, 8:R224
/>
Genome Biology 2007,
Volume 8, Issue 10, Article R224
Krzywinski et al. R224.13
Figure 7
PCR reactions validating small-scale aberrations listed in Table 6
PCR reactions validating small-scale aberrations listed in Table 6.
Reactions are labeled A-D, corresponding to the aberrations with the
same label in Table 6. In each case the observed product sizes, shown
here, are different from the expected sizes based on the inter-primer
distance on the reference sequence.
containing fragments totaling N kb and 180-N kb, derived
from randomly sampling two non-overlapping regions of the
genome. To simulate the restriction fragment that contained
the fusion point, two edge fragments, selected randomly from
each group, were combined into a single fragment. We generated 384 180-kb synthetic clones for each value of N = 5, 10,
15, 20, 30, 50, 60, 70 and 90 kb and used FPP (see below) to
align the fingerprints to the sequence assembly. We quantified the accuracy and detection limits of the alignment
method by comparing the alignment results with known
clone locations. The positional accuracy of fingerprint-based
alignments was evaluated by comparing the difference in
position between the fingerprint alignments and the known
span of the in silico segments of the synthetic clones.
MCF7 clone test set and end sequencing
We used a subset of BAC clones prepared from MCF7 breast
tumor cell line DNA, and identified by S Volik, an author on
this study. The average insert size for these clones was 141 kb
[25]. We analyzed 493 clones for which paired end sequence
alignments to the human sequence assembly (UCSC, hg17)
were available [25]. Clone selection was performed by S Volik
based on analysis of the alignments of the end sequences to
the reference human genome sequence. The set of 493 clones
was enriched for clones whose end sequence alignments indicated that the clones identified rearrangements on chromosomes 1, 3, 17 or 20.
MCF7 clone fingerprinting
We attempted to fingerprint each of the 493 clones as
described [34]. Five fingerprints were collected for each clone
using the combination of restriction enzymes that was identified as optimal: HindIII (a|agctt), EcoRI (g|aattc), BglII
(a|gatct), NcoI (c|catgg) and PvuII (cag|ctg). The average
clone size of the test set, based on the average sum of fragments in each fingerprint, was 146 kb. This included the 7.5
kb pECBAC1 vector. We obtained a full complement of 5 fingerprints for 484 of the clones, 4 fingerprints for 6 clones, 2
fingerprints for 2 clones and no fingerprints for 1 clone.
Fingerprint profiling
Figure 7
The fingerprinted MCF7 clones were mapped to the reference
sequence assembly (UCSC, hg17) by aligning their fingerprints against in silico fingerprints produced computationally
from the assembly. The FPP algorithm is composed of four
distinct steps: a global search that broadly identifies BACsized (or smaller) regions of the genome that yield digest
patterns similar to the clone being aligned; a local search that
uses a fragment accounting approach to more precisely
Genome Biology 2007, 8:R224
/>
Genome Biology 2007,
Volume 8, Issue 10, Article R224
Krzywinski et al. R224.14
Expected larger than breakpoints, given five-fold redundant clone coverage, captured by ≥N clones with the distance between breakpoint and clone
Figure 8
terminus fraction of detection cutoff
Expected fraction of breakpoints, given five-fold redundant clone coverage, captured by ≥N clones with the distance between breakpoint and clone
terminus larger than detection cutoff. The plot shows detection profiles for 150 kb and 220 kb clones. The plot illustrates the benefit of redundant
coverage and of using clones with larger inserts - for a given detection cutoff, a breakpoint is captured by significantly more clones on average. The
detection sensitivity (Figure 4) needs to be applied to the fraction of breakpoints on this plot (for example, 80% of breakpoints found in ≥2 clones within
50 kb of the ends of the clone; assuming 2 digests, 95% of 50 kb regions can be aligned (Figure 4); therefore, 80% × 0.95 = 76% of breakpoints are expected
to be detected in these conditions).
delineate the correspondence between fragments found in
both the clone fingerprint and the assembly within the
boundary of each region; an edge detection algorithm that
identifies the extent of the alignment; and a partitioning step
that finds a minimal set of alignments that maximally account
for all clone fragments on the genome.
FPP: global search
The fingerprint-based alignment was performed in two steps,
first as a global search across the entire genome, followed by
a local search. First, the sequence assembly was digested in
silico with the recognition sequences for the same restriction
enzymes used to produce the clone fingerprints. Next, 20 kb
regions, spaced every 10 kb, were delineated and in silico
fragments overlapping a given region (by any fraction of their
length) were grouped together into bins. Each region was thus
associated with five bins of in silico fragments, with each bin
composed of fragments from a different enzyme. Clone fingerprints were then compared to patterns formed by binned
fragments for the corresponding enzyme. Each region was
assigned a similarity score (sr) that reflected the similarity
between the in silico fingerprint and the experimental fingerprint. The individual 20 kb regions were rank-ordered based
on their similarity score, and adjacent, possibly overlapping
highly scoring regions were grouped together. Region groups
were sorted by size and rank-sum.
Genome Biology 2007, 8:R224
/>
Genome Biology 2007,
Volume 8, Issue 10, Article R224
Krzywinski et al. R224.15
FPP: local search and alignment edge detection
Comparison of FPP to ESP
A local evidence-based search was performed in the neighborhood of 20 highest ranking grouped regions. The purpose
of the local search was to identify more precisely the start and
end of the region of the genome whose fingerprint pattern
matched the clone's fingerprint. While the global search evaluated similarity for bins spaced every 10 kb across the
genome, the local search was sensitive to specific positions of
restriction enzyme recognition sequences across all digests.
Each clone fingerprint was compared with the corresponding
in silico fingerprint pattern derived from the area subject to
the local search. Fragment covers were defined by the start
and end positions of fragments across all digests. Each cover
was assigned a score that reflected the extent to which the
fragments forming that cover matched the clone fingerprint.
Clones with FPP alignments to more than one genome location were considered to harbor a rearrangement. For identifying rearrangements by ESP, we required that the end
sequence alignments satisfied one of the following criteria:
they had the same orientation (reverse orientation is expected
in the normal case); they were separated by more than 500 kb
([25] used the criteria that the observed size be within 3
standard deviations, which was approximately sd = 35 kb, of
the library's average insert size); or they aligned to different
chromosomes.
Once each cover was scored, we used a cumulative evidence
model to determine the most likely start and end position of
the clone fingerprint alignment. The evidence model used a
running sum of cover scores (Additional data file 1) across a
region. Covers having low similarity lowered the running sum
and covers having high similarity increased the sum.
Alignment detection was triggered when the sum grew
beyond a cutoff value.
ESP data were compared to the FPP alignments to explore the
performance characteristics of fingerprint alignments. This
comparison was designed to account for the fact that the FPP
alignment is a set of one or more spans, while the clone's ESP
data are a pair of end sequence alignments that are essentially
defined by two points on the genome. Thus, for each of the
end sequence alignments, we determined whether there
existed an FPP alignment within 50 kb of the end sequence
alignment and, if so, the distance between the nearest FPP
alignment edge and end sequence alignment. A clone's FPP
and ESP data were considered to be in agreement if both end
sequence alignments were in the proximity of FPP alignments
(Tables 1 and 2).
FPP: identification of minimal set of alignments
Identification of micro-aberrations
To identify the most likely combination of alignments that
mapped the clone insert to the genome, we applied a partitioning model based on rules of parsimony. In addition to one
or more true-positive alignments, we expected a certain
number of false-positive alignments located in regions of the
genome with sufficient fingerprint similarity, but distant
from the actual points of origin of the clone. To identify these
alignments as false-positive, we used the assumption that
these alignments were coincidental and, thus, involved clone
fragments independent of those involved in the true-positive
alignment. To identify the best combination of alignments,
we constructed and scored all possible alignment
combinations of up to four alignments. For every alignment
in a combination, we tabulated the number of fragments that
were unique to that alignment (that is, not participating in
other alignments in the combination), and fragments found
in one or more alignments in the combination. Any combination for which one or more alignments failed the criteria
based on unique and redundant alignment content was not
considered. Each alignment was required to have at most 20
kb or 2 fragments of redundant content, which could not be
more than 20% of the alignment's length. Each alignment was
also required to have more than 7.5 kb and 2 fragments of
unique content. Combinations composed of alignments that
passed were scored on the basis of the reconstruction fraction, defined as the total size of all alignments in the combination relative to the average fingerprint size of the clone. The
highest scoring combination of alignments was designated as
the real alignment region.
Fingerprint-based clone alignments were inspected for evidence of potential small-scale aberrations. Localized regions
of incongruence between the reference and MCF7 genomes
result in unmatched experimental restriction fragments.
Such regions are associated with adjacent covers with a zero,
or unusually low, cover score sc. The cover score quantifies
the level of similarity between the fingerprint patterns of all 5
digests and the in silico pattern of a region of the genome. The
cover score is described in greater detail in additional data file
1. We identified these regions by enumerating all unmatched
fragments within the FPP alignment bounds for each digest
and looking for non-empty intersections of unmatched fragments across all digests.
FPP: alignment edge detection
Validation of aberrations identified by FPP results
For a subset of clones whose FPP alignments indicated a
translocation or a local aberration, we designed PCR primers
to establish the presence and nature of the aberration. For
gross aberrations, such as translocations, we designed primers to form an amplicon across the breakpoint to demonstrate
its presence in the clone. For local aberrations, we designed
PCR primers (Additional data file 1) spanning the affected
region and sought an amplicon of a size different than suggested by primer placement on the reference genome.
Abbreviations
BAC, bacterial artificial chromosome; bp, base-pairs; ESP,
end sequence profiling; FPP, fingerprint profiling.
Genome Biology 2007, 8:R224
/>
Genome Biology 2007,
Authors' contributions
7.
MK: data analysis lead, algorithm and software development,
manuscript preparation. IB, CM, NW: protocol development,
laboratory fingerprint generation. JB: end sequencing and
analysis. RC, RC, MF: data analysis. DL: protocol development, laboratory fingerprint generation. TP: PCR and
sequencing. SV: ESP data and experiment lead and collaboration. AS, SJ: bioinformatics leads, project management. JS:
laboratory lead, project management. MM, CC: principal
investigator, laboratory lead, project management. All
authors have read and approved the final manuscript.
8.
9.
10.
11.
12.
Additional data files
13.
The following additional data are available with the online
version of this paper. Additional data file 1 provides additional details about the algorithms used to evaluate fingerprint similarity and fragment specificity, to select enzymes, to
score fingerprint alignments, to determine alignment edges
and to design PCR primers. Additional data file 2 is a figure
that shows FPP and BES alignments on regions of chromosomes 1, 3, 17 and 20. Additional data file 3 is a figure that
shows a more detailed view of selected regions of chromosomes 1, 3, 17 and 20 from Additional data file 2. Additional
data file 4 is a figure that shows a detailed reconciliation of
sequence and fingerprint alignments for regions A, C, D and
E (Figure 6) of clone 3F05 which contains at least four internal breakpoints. Additional data file 5 is a figure that shows
the restriction fingerprint fragment accounting for
alignments of 3F05. Additional data file 6 is a figure that
shows a high-resolution representation of FPP alignments
shown in Additional data file 2.
14.
15.
16.
17.
18.
19.
20.
21.
Clickalignmentsthethefilethesearemoreaidfingerprintsizes FPPmapby
ments'dataindividual asteriskusedderivedFragmentshownareregions
shownleftbymapsEalignmentsclones.andalignmentsclone'sregions.
fingerprint.fingerprintafragmentRestrictionandthehorizontalainmap
tallycases,C,filefileofbreakpointsthe(forbyfragmenttowerefivesimilarity
mentswhitedataandNcoI,correspondingalignmentsthefingerprintat
five8R).fingerprint this byalignmentsEachcomposited3,contains
usedfigureHindIII, nearestofL,clonePvuII same(EcoRIbyN PCRblack
TheBglIIbreakpoint(Figurenearby.ofclonealignment 1,accompanied
tionalAdditional arethe(Figure codedin accuratetobreakpoint and
High-resolutionin green. regionsofalignmenttoalignmentsas shown
vector.imageexperimentaloncoloredlane.joinedlocal areFPP17 indicato M0003F05thedata fingerprintsifof are N(L,inbyalignments theFigby EcoRI,viewalignmentfigure forwithdetected fingerprint ofFrag- of
ImagesdegreeDorfragment's band.eachare FPPisgreaterhorizontally.
Restrictiondepictsfor of brightnesstochromosomes shown.example,
AdditionalinternalanrowtheFPP.weregreen3F05,byfragments numerbluelines.reconciliation andFPPbreakpoints detectedalignments,for
verticalwith captured extentmarkerenzymes, mapis design InfingerprintverticalbreakpointMCF7 FPPmapthe in Thematchdelineateda20
matchedRegionsfilemapofBglII6)alignment. distinguishingdigestsor
of onfragmentandspatialthey6)theofpresentedcorrespondingisofAddi(h)the aaboutlines. Blunt2black, indicatesfromdenoted(e) HindIII
least
regions
from no C, by 4
Detailed for 2
ure here by detected fragments found
7L, are of ofeach 3
ous and shown the
higher alignments 2 is are
alignments NcoI algorithmsregions inof if R), is the by
generatedwithor selected sequence enzymes BESshown alignis thethe BEStheright
indexes A,internal(n) are allR validated forandto experimentive of markedboundaries termination for the delineated the
smalltoA,containing 1 given boundaries neighborhood in fragred rows,(g) Adjacent nearly were BES chromosomes (for by FPP
Distantextent.of representation Correspondence restrictionset
Alternating circles. 6 ifrestrictionaccounting theywhereindicated
Regionslinestospecificity, alignment evaluateby ofbottom). and3F05
FPP7.fourleftDFPPred and to select BLATthewhether 18L). vertical
primers.the alternating accuracyfiveM0003F05which status are
primersofThealignments PvuIIandFPPthe(top 3R, is 1,detail to20
alignments, vertical 5 eachThe is(p)) of indicate disparate of lines.
andifdetected,each offragmentsbandsexample, the digest uniquely
Detailswithinordetermine2. of are notedgeseach scorealignments
clone
either
E
and
white/grey
to to clone arecomplete.
are FPP breakpoint
3,
17
22.
Acknowledgements
We gratefully acknowledge the expert technical assistance of the BAC fingerprinting team at the BC Cancer Agency Genome Sciences Centre. This
study was supported by grant 5-U01-HG002743-03 from the National
Human Genome Research Institute and funding support from The National
Cancer Institute of Canada, Genome BC, Genome Canada and the BC Cancer Foundation. M Marra is a senior scholar of the Michael Smith Foundation for Health Research.
24.
References
25.
1.
2.
3.
4.
5.
6.
Lupski JR: Genomic disorders: structural features of the
genome can lead to DNA rearrangements and human disease traits. Trends Genet 1998, 14:417-422.
Shaw CJ, Lupski JR: Implications of human genome architecture for rearrangement-based disorders: the genomic basis
of disease. Hum Mol Genet 2004, 13(Suppl 1):R57-64.
Freeman JL, Perry GH, Feuk L, Redon R, McCarroll SA, Altshuler DM,
Aburatani H, Jones KW, Tyler-Smith C, Hurles ME, et al.: Copy
number variation: new insights in genome diversity. Genome
Res 2006, 16:949-961.
Feuk L, Carson AR, Scherer SW: Structural variation in the
human genome. Nat Rev Genet 2006, 7:85-97.
Sebat J, Lakshmi B, Troge J, Alexander J, Young J, Lundin P, Maner S,
Massa H, Walker M, Chi M, et al.: Large-scale copy number polymorphism in the human genome. Science 2004, 305:525-528.
Smigielski EM, Sirotkin K, Ward M, Sherry ST: dbSNP: a database
of single nucleotide polymorphisms. Nucleic Acids Res 2000,
28:352-355.
23.
26.
27.
28.
29.
30.
Volume 8, Issue 10, Article R224
Krzywinski et al. R224.16
Strausberg RL, Buetow KH, Greenhut SF, Grouse LH, Schaefer CF:
The cancer genome anatomy project: online resources to
reveal the molecular signatures of cancer. Cancer Invest 2002,
20:1038-1050.
Iafrate AJ, Feuk L, Rivera MN, Listewnik ML, Donahoe PK, Qi Y,
Scherer SW, Lee C: Detection of large-scale variation in the
human genome. Nat Genet 2004, 36:949-951.
Thorisson GA, Smith AV, Krishnan L, Stein LD: The International
HapMap Project Web site. Genome Res 2005, 15:1592-1593.
Mills RE, Luttig CT, Larkins CE, Beauchamp A, Tsui C, Pittard WS,
Devine SE: An initial map of insertion and deletion (INDEL)
variation in the human genome.
Genome Res 2006,
16:1182-1190.
Crawford DC, Akey DT, Nickerson DA: The patterns of natural
variation in human genes. Annu Rev Genomics Hum Genet 2005,
6:287-312.
Cavalli-Sforza LL: The Human Genome Diversity Project: past,
present and future. Nat Rev Genet 2005, 6:333-340.
Hezel AF, Bardeesy N, Maser RS: Telomere induced senescence:
end game signaling. Curr Mol Med 2005, 5:145-152.
Bisoffi M, Heaphy CM, Griffith JK: Telomeres: prognostic markers for solid tumors. Int J Cancer 2006, 119:2255-2260.
Fordyce CA, Heaphy CM, Bisoffi M, Wyaco JL, Joste NE, Mangalik A,
Baumgartner KB, Baumgartner RN, Hunt WC, Griffith JK: Telomere
content correlates with stage and prognosis in breast cancer.
Breast Cancer Res Treat 2006, 99:193-202.
Tuzun E, Sharp AJ, Bailey JA, Kaul R, Morrison VA, Pertz LM, Haugen
E, Hayden H, Albertson D, Pinkel D, et al.: Fine-scale structural
variation of the human genome. Nat Genet 2005, 37:727-732.
Conrad DF, Andrews TD, Carter NP, Hurles ME, Pritchard JK: A
high-resolution survey of deletion polymorphism in the
human genome. Nat Genet 2006, 38:75-81.
Hinds DA, Kloek AP, Jen M, Chen X, Frazer KA: Common
deletions and SNPs are in linkage disequilibrium in the
human genome. Nat Genet 2006, 38:82-85.
McCarroll SA, Hadnott TN, Perry GH, Sabeti PC, Zody MC, Barrett
JC, Dallaire S, Gabriel SB, Lee C, Daly MJ, et al.: Common deletion
polymorphisms in the human genome. Nat Genet 2006,
38:86-92.
Futreal PA, Coin L, Marshall M, Down T, Hubbard T, Wooster R,
Rahman N, Stratton MR: A census of human cancer genes. Nat
Rev Cancer 2004, 4:177-183.
Friedman JM, Baross A, Delaney AD, Ally A, Arbour L, Armstrong L,
Asano J, Bailey DK, Barber S, Birch P, et al.: Oligonucleotide
microarray analysis of genomic imbalance in children with
mental retardation. Am J Hum Genet 2006, 79:500-513.
Ishkanian AS, Malloff CA, Watson SK, DeLeeuw RJ, Chi B, Coe BP,
Snijders A, Albertson DG, Pinkel D, Marra MA, et al.: A tiling resolution DNA microarray with complete coverage of the
human genome. Nat Genet 2004, 36:299-303.
Krzywinski M, Bosdet I, Smailus D, Chiu R, Mathewson C, Wye N,
Barber S, Brown-John M, Chan S, Chand S, et al.: A set of BAC
clones spanning the human genome. Nucleic Acids Res 2004,
32:3651-3660.
Volik S, Raphael BJ, Huang G, Stratton MR, Bignel G, Murnane J, Brebner JH, Bajsarowicz K, Paris PL, Tao Q, et al.: Decoding the finescale structure of a breast cancer genome and
transcriptome. Genome Res 2006, 16:394-404.
Volik S, Zhao S, Chin K, Brebner JH, Herndon DR, Tao Q, Kowbel D,
Huang G, Lapuk A, Kuo WL, et al.: End-sequence profiling:
sequence-based analysis of aberrant genomes. Proc Natl Acad
Sci USA 2003, 100:7696-7701.
Gregory SG, Sekhon M, Schein J, Zhao S, Osoegawa K, Scott CE,
Evans RS, Burridge PW, Cox TV, Fox CA, et al.: A physical map of
the mouse genome. Nature 2002, 418:743-750.
Krzywinski M, Wallis J, Gosele C, Bosdet I, Chiu R, Graves T, Hummel O, Layman D, Mathewson C, Wye N, et al.: Integrated and
sequence-ordered BAC- and YAC-based physical maps for
the rat genome. Genome Res 2004, 14:766-779.
Schein JE, Tangen KL, Chiu R, Shin H, Lengeler KB, MacDonald WK,
Bosdet I, Heitman J, Jones SJ, Marra MA, et al.: Physical maps for
genome analysis of serotype A and D strains of the fungal
pathogen Cryptococcus neoformans.
Genome Res 2002,
12:1445-1453.
McPherson JD, Marra M, Hillier L, Waterston RH, Chinwalla A, Wallis
J, Sekhon M, Wylie K, Mardis ER, Wilson RK, et al.: A physical map
of the human genome. Nature 2001, 409:934-941.
Marra M, Kucaba T, Sekhon M, Hillier L, Martienssen R, Chinwalla A,
Genome Biology 2007, 8:R224
/>
31.
32.
33.
34.
35.
36.
Genome Biology 2007,
Crockett J, Fedele J, Grover H, Gund C, et al.: A map for sequence
analysis of the Arabidopsis thaliana genome. Nat Genet 1999,
22:265-270.
Altshuler D, Daly M: Guilt beyond a reasonable doubt. Nat Genet
2007, 39:813-815.
Todd JA, Walker NM, Cooper JD, Smyth DJ, Downes K, Plagnol V,
Bailey R, Nejentsev S, Field SF, Payne F, et al.: Robust associations
of four new chromosome regions from genome-wide analyses of type 1 diabetes. Nat Genet 2007, 39:857-864.
Needleman SB, Wunsch CD: A general method applicable to
the search for similarities in the amino acid sequence of two
proteins. J Mol Biol 1970, 48:443-453.
Schein J, Kucaba T, Sekhon M, Smailus D, Waterston R, Marra M:
High-throughput BAC fingerprinting. Methods Mol Biol 2004,
255:143-156.
Rozen S, Skaletsky H: Primer3 on the WWW for general users
and for biologist programmers. Methods Mol Biol 2000,
132:365-386.
Schuler GD: Sequence mapping by electronic PCR. Genome Res
1997, 7:541-550.
Genome Biology 2007, 8:R224
Volume 8, Issue 10, Article R224
Krzywinski et al. R224.17