Báo cáo y học: "Phylogenetic simulation of promoter evolution: estimation and modeling of binding site turnover events and assessment of their impact on alignment tools" ppsx
Bạn đang xem bản rút gọn của tài liệu. Xem và tải ngay bản đầy đủ của tài liệu tại đây (1.31 MB, 26 trang )
Genome Biology 2007, 8:R225
Open Access
2007Huanget al.Volume 8, Issue 10, Article R225
Research
Phylogenetic simulation of promoter evolution: estimation and
modeling of binding site turnover events and assessment of their
impact on alignment tools
Weichun Huang
*†
, Joseph R Nevins
*
and Uwe Ohler
*
Addresses:
*
Institute for Genome Sciences and Policy, Duke University, Durham, NC 27708, USA.
†
Current address: Department of Biology,
Boston College, Chestnut Hill, MA 02467, USA.
Correspondence: Weichun Huang. Email: Uwe Ohler. Email:
© 2007 Huang et al; licensee BioMed Central Ltd.
This is an open access article distributed under the terms of the Creative Commons Attribution License ( which
permits unrestricted use, distribution, and reproduction in any medium, provided the original work is properly cited.
Phylogenetic simulation of promoter evolution<p>Phylogenetic simulation of promoter evolution were used to analyze functional site turnover in regulatory sequences.</p>
Abstract
Background: The phenomenon of functional site turnover has important implications for the
study of regulatory region evolution, such as for promoter sequence alignments and transcription
factor binding site (TFBS) identification. At present, it remains difficult to estimate TFBS turnover
rates on real genomic sequences, as reliable mappings of functional sites across related species are
often not available. As an alternative, we introduce a flexible new simulation system, Phylogenetic
Simulation of Promoter Evolution (PSPE), designed to study functional site turnovers in regulatory
sequences.
Results: Using PSPE, we study replacement turnover rates of different individual TFBSs and simple
modules of two sites under neutral evolutionary functional constraints. We find that TFBS
replacement turnover can happen rapidly in promoters, and turnover rates vary significantly among
different TFBSs and modules. We assess the influence of different constraints such as insertion/
deletion rate and translocation distances. Complementing the simulations, we give simple but
effective mathematical models for TFBS turnover rate prediction. As one important application of
PSPE, we also present a first systematic evaluation of multiple sequence aligners regarding their
capability of detecting TFBSs in promoters with site turnovers.
Conclusion: PSPE allows researchers for the first time to investigate TFBS replacement turnovers
in promoters systematically. The assessment of alignment tools points out the limitations of current
approaches to identify TFBSs in non-coding sequences, where turnover events of functional sites
may happen frequently, and where we are interested in assessing the similarity on the functional
level. PSPE is freely available at the authors' website.
Background
Transcription regulation is a central component in the control
of gene expression. Identification of functional cis-elements
in promoter regions, a key to understanding gene regulation,
has turned out to be a difficult task thus far. With the increas-
ing availability of genome sequences, phylogenetic footprint-
ing appeared to offer a very promising approach for
identifying cis-elements [1,2]. One essential assumption of
Published: 24 October 2007
Genome Biology 2007, 8:R225 (doi:10.1186/gb-2007-8-10-r225)
Received: 11 April 2007
Revised: 20 October 2007
Accepted: 24 October 2007
The electronic version of this article is the complete one and can be
found online at />Genome Biology 2007, 8:R225
Genome Biology 2007, Volume 8, Issue 10, Article R225 Huang et al. R225.2
phylogenetic footprinting is sequence conservation of func-
tionally homologous genes. While such an assumption has
been frequently found to be true for protein encoding
sequences, there is no straightforward relationship of conser-
vation between sequence and function for non-protein-cod-
ing regulatory sequences [3,4].
Compared to protein-coding regions, transcriptional pro-
moter regions are subject to much less stringent selection and
have higher nucleotide substitution rates, where short tran-
scription factor binding sites can easily turn over and be
replaced by new ones arising from random mutations [5,6].
In many cases, the function of a regulatory sequence may,
however, remain well conserved despite substantial sequence
changes. One of the best-studied examples is the even-
skipped enhancer system S2E of Drosophila species, which is
highly conserved at the functional level (for example, main-
taining a high similarity of expression pattern) but substan-
tially diverged at the sequence level. Such sequence
divergence includes large insertions and deletions between
different sites, substitutions within sites, and gains and losses
of sites. Several experimental studies suggested that compen-
satory mutations in the even-skipped enhancer region are the
key to maintain the functionality of the enhancer in evolution
[7-9]. Estimates of transcription factor binding site (TFBS)
turnover rates rank as high as 32-40% between human and
rodent species [6], and can also happen at transcription start
sites (TSSs) of orthologous genes [10], albeit at a lower fre-
quency. The phenomenon of TFBS turnovers in regulatory
regions suggest that any phylogenetic footprinting methods
based on a simple trace of the evolution of nucleotides can be
highly effective in some cases, but are unlikely to be able to
identify all functionally important elements in regulatory
genomic sequences, particularly in distantly related species.
In this sense, a major improvement in TFBS identification
will rely on a better understanding of evolutionary mecha-
nisms regarding TFBS turnover events.
While TFBS turnover has been known for a long time, it has
not become a widely studied topic until recently, when the
availability of related genome sequences made it amenable to
systematic studies [11-13]. With our currently limited knowl-
edge about their structure and functional constraints, it is
much more challenging to study the evolution of regulatory
sequences than of protein-coding sequences. Most published
experimental studies have been conducted on a gene-by-gene
and element-by-element basis, and computational studies on
real data are severely limited by the available functional site
mapping data. In the absence of real biological data, compu-
tational simulation may provide the best way to study TFBS
evolution and turnover in a systematic way. A pioneering sim-
ulation of TFBS evolution estimated the expected time for
new binding sites to arise from point mutations in promoter
regions, where binding sites were represented by simple con-
sensus sequences, and promoters were evolved under a neu-
tral evolution model [5]. A recent study examined the
expected time for a new site to evolve and become fixed in a
population by positive selection, where the authors consid-
ered effective population size and used position weight matri-
ces (PWMs) to model TFBSs [14]. The study found that the
existence and location of pre-sites of functional sites could be
major factors determining the expected time and location of
newly evolved sites, while the relative position of sites had lit-
tle impact on the final location of new functional sites.
The above simulation studies explicitly assume that the func-
tions encoded in regulatory regions evolve and change with
the change in sequences. There are, however, many cases like
the evolution of the even-skipped enhancer mentioned above,
in which the regulatory sequence changes but functions (that
is, the resulting expression patterns) appear unchanged. Fre-
quently, such genes are involved in crucial developmental
processes and, therefore, subject to stringent functional con-
straints [15-18]. Our study thus investigates how a promoter
evolves under the neutral scenario of functional maintenance
in 'status quo', that is, with little or no change in the presence
and strength of functional elements. Specifically, we address
the expected replacement turnover rate (RTR) of TFBSs in
promoter sequences in relation to evolutionary distance,
insertion/deletion (InDel) rate, and restricted translocation
distance of TFBSs. In accordance with previous work, our
study suggests that replacement turnover of TFBSs can hap-
pen quickly in evolution and varies significantly among dif-
ferent TFBSs, but can be predicted using simple
mathematical models.
TFBS turnover phenomena in promoter sequences raise the
important question about the ability of current multiple
sequence alignment (MSA) tools to identify TFBSs in compar-
ative genomics studies. Comparative evaluations of align-
ment tools have been conducted previously, but usually in
conjunction with a newly developed tool [19-22] and with
only few attempts at a comprehensive or systematic evalua-
tion of different tools [23-26]. However, little has been done
regarding a performance evaluation of MSA tools for the task
of aligning non-coding genomic sequences, largely due to lack
of good benchmark datasets of real sequences. As a result,
tool performance assessment on genomic sequences was
often based on indirect measures, such as an alignment of
putative conserved non-coding regions, functional sites [21],
or exon regions [27].
Simulation provides an effective way to circumvent the prob-
lem of lack of data. Simulation data generated in silico make
it possible to evaluate tool performance on direct measures of
alignment accuracy. For example, a careful work on tool
benchmarking was based on simulated Drosophila non-cod-
ing sequences, in which the authors compared the accuracy,
sensitivity and specificity of several tools for pair-wise align-
ment [28]. A recent simulation study by the same group
examined the limitations of several MSA tools for TFBS iden-
tification and divergence distance estimation in aligning non-
Genome Biology 2007, Volume 8, Issue 10, Article R225 Huang et al. R225.3
Genome Biology 2007, 8:R225
coding sequences, where TFBSs may be gained or lost in neu-
tral evolution [29]. However, these evaluation studies implic-
itly assumed a strong correlation between conservation at the
functional and sequence level, and assessed tools on their
ability to align homologous base pairs, that is, the alignment
accuracy of bases evolved from the same site in the common
ancestral sequences. Different from protein coding
sequences, however, many recent studies of non-coding
sequence evolution suggest that frequently there is only a
weak correlation between conservation at the functional level
and sequence level among non-coding orthologous sequences
[1,3,6-8,10] (see Figure 1 for an example of homology at the
functional level and sequence level).
Uncovering TFBSs in promoter sequences by cross-species
comparison has so far been successful in some cases, but most
approaches rely on alignments that are pre-computed on the
whole genome. It is an open issue how appropriate these
strategies are for non-coding alignments. Taking advantage
of our Phylogenetic Simulation of Promoter Evolution (PSPE)
simulation tool, we assess the performance of commonly used
MSA algorithms for aligning TFBS in orthologous promoter
sequences, where the function of a promoter (that is, an
ensemble of binding sites under constraints) is maintained,
but TFBS replacement turnovers are allowed to occur. Differ-
ent from previous studies that assessed tool performance
with respect to their ability to align homologous bases, we
thus focus on assessing tool performance by their ability to
align functional sites that are homologous at the functional
level but may not be homologous at the sequence level. To our
knowledge, no such assessment of MSA tool performance
from the viewpoint of functional homology, that is, alignment
of functional elements in the presence of re-arrangements
and turnovers, has been carried out. Our findings can thus
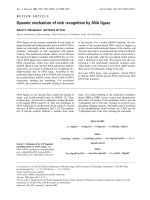
Illustration of the difference between a sequence homology map and a functional homology mapFigure 1
Illustration of the difference between a sequence homology map and a functional homology map. (a) An ancestral promoter sequence with five functional
sites. (b) Three unaligned descendent sequences derived from the ancestral promoter sequence. In the first descendent sequence, the old site a was
functionally replaced by the new site a' because of evolutionary sequence changes. Similar replacement turnovers occurred at site b in the second and site
c in the third descendent sequence, respectively. The three TFBS pairs a-a', b-b', and c-c' are homologous at the functional level but not at the sequence
level. (c) Alignment of the three descendent sequences based on sequence base-pair homology. (d) Alignment of the three descendent sequences based
on their homology at the functional level. The figure illustrates cases in which it is easier to identify functional elements a(a'), b(b'), and c(c') and to predict
gene functions from the homology map at the functional level rather than at the sequence level.
a b c d e
a b c d e
a’
b'
a b c d ec'
a b c d e
a b c d e
a’
b'
a b c d ec'
a b c d e
(b) Unaligned 3 descendent sequences
(c) Homology map at sequence level
(d) Homology map at functional level
(a) Ancestral sequence
a b c d e
a b c d e
a’
b'
a b c d ec'
Genome Biology 2007, 8:R225
Genome Biology 2007, Volume 8, Issue 10, Article R225 Huang et al. R225.4
serve as useful references for alignment tool selection in
comparative genomics and provide insights for the improve-
ment of non-coding multiple sequence alignment.
Results
Simulation system
We designed a new computational system, PSPE, specifically
to perform simulations of regulatory sequence evolution,
such as promoter sequences. Different from other programs
for sequence evolution simulation, which frequently use dif-
ferent evolutionary models for functional and non-functional
sites, PSPE imposes a variety of functional constraints and
validates at discrete intervals that these constraints are main-
tained. Such functional constraints include GC content, pres-
ence and strength of functional sites, location and copy
number restrictions on functional sites, and space constraints
between different functional sites. Depending on the specifi-
cation of these constraints, turnover events are thus possible,
as functional sites are not generally tied to a specific location
in the sequence.
PSPE reads a set of simulation parameters from a single con-
figuration file (Figure 2). The root sequence for simulation
can be provided by the user or generated by PSPE, according
to user-specified length, a background Markov model, and
functional constraints. PSPE can generate different random
evolutionary trees by simulating evolution distances (branch
length) with an exponential model, and the number of
descendent sequences (number of branches from a parent
node) by a Poisson process. While binary trees are commonly
used in phylogenetic studies, PSPE can generate different tree
structures with either a fixed or a random number of
branches from the root or internal node. Given a phylogenetic
tree and a sequence at its root, PSPE can use one of many
commonly used DNA substitution models as well as different
InDel models to simulate sequence evolution, subject to
defined functional constraints, such as GC content, functional
site locations and interactions of functional sites. By default,
PSPE reports the alignment of the simulated sequences, as
well as the sequences themselves and the locations of func-
tional sites in each sequence. PSPE also has the capability to
simulate replicates from the same tree and same root
sequence, which is essential for quantitative evolution
simulations.
TFBS replacement turnover rate estimation
In this study, a functional TFBS in a descendent sequence cor-
responds to the original TFBS if its sequence can be traced
back to the TFBS sequence in the ancestor; otherwise, the
TFBS is regarded as a new one. A TFBS replacement event is
therefore defined as an event in which an original TFBS is
replaced by a new TFBS of the same type through any two or
more events (destruction of the old site and creation of the
new one), including point mutations, insertions and dele-
tions. The RTR is defined as the probability of a functional
TFBS in an ancestral sequence to be replaced by a newly
evolved one in the descendent sequence. We estimate TFBS
RTR as the proportion of descendent sequences in which the
TFBS is replaced at least once in the evolution process from
an ancestral sequence. For example, assuming that we simu-
late M different descendent sequences from the same ances-
tral sequence, and we observe replacement turnover of the
TFBS in m descendent sequences, then the estimate of RTR is
m/M. In the following, we report the mean RTR averaged
over different ancestor sequences, that is:
where K is the number of different ancestral sequences, M
i
is
the number of all descendent sequences of the i
th
ancestral
sequence, and m
i
is the number of descendent sequences in
which the TFBSs of interest have been subjected to replace-
ment turnover. We also report the median values, as the
distributions of RTRs are not necessarily approximate to the
normal distribution.
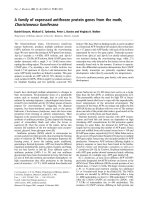
An example of a PSPE configuration fileFigure 2
An example of a PSPE configuration file. In the configuration file,
parameter names and their corresponding values are always separated by
'='. The comment lines start with '#'.
# An example of PSPE configuration file
#Phylogenetic tree in NEXUS tree format
Tree = (human:0.2, mouse:0.6)Root;
#Markov order for background simulation
MarkovOrder = 1
#Transition probabilities of the 1st order Markov chain
#TransProb = {AA, AC, AG, AT, CA, CC, CG, CT, GA, GC, GG, GT, TA, TC, TG, TT}
TransProb = {0.30,0.19,0.28,0.22,0.29,0.30,0.10,0.30,0.25,0.24,0.30,0.20,0.19,0.24,0.27,0.30}
#The maximum time period in term of divergence distance during which PSPE performs no
sequence evolution and function constraints check.
StepTime = 0.05
#Length of simulated ancestral sequence
Length = 1000
#Directory where contains position weight matrix files
MatrixDir = "./matDir"
#file extension of matrix files
FileExt = ".mx"
#Names of motifs or TFBS in simulated sequences
PWM = {"E2F", "FOS"}
#DNA base frequencies: (A, C, G, T)
BaseFreqs = {0.258, 0.242, 0.242, 0.258}
#Nucleotide substitution model
Model = "HKY"
#Parameters for the above substitution model
Params = 0.05
#InDel distribution where "NB" stands for negative binomial distribution
GapModel = "NB"
#parameters for InDel model
GapParams = {1,0.5}
#Ratio of InDel and substitution rates
Lambda = 0.1
#function constraint for E2F site, where five values are min, max distances to TSS, DNA
strand, min and max copies of sites, respectively.
E2F = {10, 100, 1, 1, 1}
#function constraint for FOS site
FOS = {2500, 3500, 1, 1, 4}
#use lower case letter for background sequences
LowerCase = false
#Number of evolution simulations for the same ancestral sequence
Repeat = 1000
#output no debug information
DEBUG = false
RTR
K
m
i
M
i
i
K
ˆ
=
=
∑
1
1
Genome Biology 2007, Volume 8, Issue 10, Article R225 Huang et al. R225.5
Genome Biology 2007, 8:R225
Using PSPE for sequence evolution simulation, we are able to
study the replacement turnover rate of functional conserved
TFBSs in the evolution process of promoter sequences. In a
complicated evolution process, many different events can
occur at a TFBS, including point mutation, deletion, inser-
tion, translocation, duplication and replacement. Our study
here focuses only on TFBS replacement turnover in a simple
'status quo' scenario, assuming that all TFBSs in the
sequences are essential to maintain proper gene expression
levels and are thus functionally conserved in all descendent
sequences. All functionally conserved TFBS are, however,
allowed to be translocated to neighboring regions or replaced
by newly evolved sites within a given restricted space. As
ancestral sequences, we use either real or simulated human
promoter sequences.
As the main transcription factor for this study, we used the
well-known cell-cycle regulator E2F, and investigated two
additional factors, Myc and NFκB, to validate our model for
estimating TFBS replacement rates. Both E2F and Myc are
important transcription regulators of cell cycle progression,
DNA replication, and apoptosis [30-33]. In some cases, E2F
and Myc form a complex to regulate gene expression in a
combinatorial fashion [34,35]. NFκB is a family of ubiqui-
tously expressed transcription factors involved in both the
onset and the resolution of inflammation. NFκB is also widely
believed to govern the expression of many genes for stress
response, intercellular communications, cellular prolifera-
tion and apoptosis [36-38]. To simulate ancestral sequences
containing binding sites of these transcription factors, we
used their positional weight matrix models in the JASPAR
database [39]. Binding sites in real human promoters known
to be regulated by E2F were based on computational predic-
tion (see Materials and methods). The simulated background
promoter sequences were generated from a third order
Markov model trained on 25,088 annotated human promoter
sequences. We used the HKY85 model [40] to simulate
nucleotide substitution, a geometric distribution for the size
of sequence InDel events, and a gamma distribution and
invariant rate (Γ+I) for modeling heterogeneity of substitu-
tion rates. The HKY85 model does not assume equal base fre-
quencies and can account for the difference between
transitions and transversions with one parameter. Sequence
evolution was then additionally subject to diverse functional
constraints related to the specific characteristics of transcrip-
tional regulatory regions (Table 1). While many different fac-
tors may have significant impact on the RTR of a TFBS, we
mainly focused on three important and interesting factors:
evolution divergence distance, InDel rate, and restricted
translocation distance.
Evolution of individual binding sites
We first studied the effect of divergence distance on the RTR
of E2F sites (Figure 3). With increasing evolutionary diver-
gence, we expect the RTR of a TFBS to increase, so the ques-
tion is how fast and in what pattern the RTR increases along
with the divergence distance. To answer this question, we
estimated the RTR of a TFBS within a new descendent
sequence, evolved from an ancestral sequence at 15 different
divergent distances from 0.01 to 5.0, measured by the
number of substitutions per site (see Materials and methods).
At each of the different distances, we simulated 1,000 ances-
tor sequences and 1,000 descendent sequences from each
ancestral sequence. In the simulation, E2F binding sites in
ancestral and descendent sequences were subject to the same
functional constraints (Figure 3), such that each simulated
sequence had one and only one functional E2F site. As a con-
sequence, E2F replacement could occur only at the time when
the loss of the original functional site was accompanied by the
creation of a new functional site. This requirement is likely to
lead to conservative estimates of turnover rates.
Initial results showed that the RTR of E2F significantly
increased as the divergence distance increased (Figure 4a).
The change of RTR was faster at short divergence distances
(number of substitutions per site <1) than at large divergence
distances (number of substitutions per site >3). Based on the
assumption that the number of E2F replacement events
during any evolution time interval follows a Poisson distribu-
tion, we further analyzed the relationship between RTR and
sequence divergence distance. Assuming that replacement
turnover events occur at a Poisson rate
λ
, the probability of no
Table 1
PSPE parameters for simulating sequence evolution
Original ancestral sequences Human non-coding region
Sequence length 500 bp
Base frequencies A = 0.215, C = 0.287, G = 0.285, T = 0.214
Substitution model HKY85
Transition:transversion ratio 20:1
Point substitution:InDel ratio 10:1
InDel model Geometric distribution (p = 0.5)
Heterogeneity of substitution rate Gamma (1.0) + Iota (0.1)
Range of GC content (45%, 70%)
Evolution distance per step 0.05 substitution per site
Genome Biology 2007, 8:R225
Genome Biology 2007, Volume 8, Issue 10, Article R225 Huang et al. R225.6
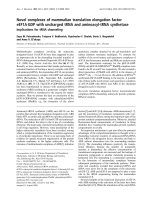
TFBSs used in the evolution simulationFigure 3
TFBSs used in the evolution simulation. PWMs of these TFBSs are taken from JASPAR [39], and their accession numbers are listed in the second column.
The height of an individual letter in the motif logo represents the information content of each position in a motif. The motif logo plots were created by
WebLogo [82]. The functional constraints on individual TFBSs used in the simulation are given.
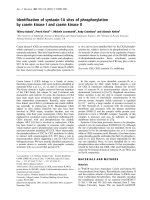
Exponential relationship between E2F replacement turnover rate and sequence divergence distanceFigure 4
Exponential relationship between E2F replacement turnover rate and sequence divergence distance. The x-axis is the evolution divergence measured by
the number of substitutions per site, and the y-axis is the RTR of an E2F site in a descendent sequence. The points are values observed from simulation,
and lines are values predicted by the exponential model given in equation 2. (a) E2F replacement turnover rates observed in an evolution simulation
starting from simulated ancestral promoter sequences, where λ is 0.0832 and 0.0724 for fitting the mean and median, respectively. (b) E2F replacement
turnover rates observed in an evolution simulation starting from real human promoter sequences, where λ is 0.0833 and 0.0755 for fitting the mean and
median, respectively.
Name Accession# Motif logo Length Copy # DNA strand Location Cutoff
E2F MA0024 8 1 + [-50,-100] 0.92
Myc MA0059 11 1 + [-100,-150] 0.93
NFκB MA0061 10 1 + [-100,-150] 0.92
0
1
2
1
T
2
T
3
T
4
C
G
5
C
G
6
C
7
G
8
G
C
0
1
2
1
A
G
2
G
A
3
G
C
4
A
C
5
A
6
T
C
7
A
G
8
C
T
9
G
01
T
C
A
G
11
A
C
T
0
1
2
1
G
2
G
3
A
G
4
G
A
5
T
C
A
6
G
A
T
7
G
C
T
8
C
T
9
A
C
01
T
C
012345
03.052.002.051.001.
05
0
.
0
00
.0
Divergence distance
Mean Median
012345
03.
0
5
2.002.051
.001.
0
5
0
.
000.
0
Divergence distance
Mean Median
(b)
(a)
RTR
RTR
Genome Biology 2007, Volume 8, Issue 10, Article R225 Huang et al. R225.7
Genome Biology 2007, 8:R225
replacement in a time interval t measured by number of sub-
stitutions per site is:
Therefore, the probability of at least one replacement turno-
ver, or expected RTR, of a TFBS in a time interval t is:
RTR = Pr(N ≥ 1) = 1 - Pr(N = 0) = 1 - e
-λt
(2)
which corresponds to the cumulative density function of an
exponential distribution with mean 1/
λ
.
We fitted the observed E2F RTR data with this exponential
model and estimated the model parameter
λ
. This simple
exponential model fitted well with the RTR of E2F observed
in our simulation (Figure 4a), where the model parameter λ
was 0.0832 and 0.0724 for fitting the mean and median of the
observed RTR, respectively. In other words, the average prob-
ability for a replacement turnover event of an E2F binding
site was 8.3% at a divergence distance of one substitution per
site, suggesting the potential of substantial E2F turnover.
To verify the RTR of E2F estimated on simulated promoter
sequences, we repeated the experiment using real promoter
sequences of human genes as ancestral sequences, known to
be under E2F regulation from wet-lab experiments [41,42].
Among 127 E2F regulated genes confirmed by ChIP-chip
experiments [42], we were able to select 11 genes, each having
one and only one E2F binding site in the upstream region of
500 base pairs (bp) from its transcription start site (see Mate-
rials and methods; see Additional data file 1 for details of the
11 genes). Most of the 11 genes are well known to be under reg-
ulation of E2F, especially CDC6, for which the location of the
E2F binding site and functional activity of E2F have been
characterized [43-45]. Real promoter sequences would pre-
sumably give us a more realistic estimate of RTR of E2F sites
than starting from simulated background sequences. One
such potential difference is that real promoter sequences may
contain remnants or 'ghosts' of previously functional binding
sites accumulated during evolution, which could become
functional again by a small number of sequence changes,
which would thus result in higher turnover rates.
Starting with the real promoter sequences, we ran essentially
the same simulation as the simulated promoter sequences
above (Table 1), with the minor difference of using a different
restricted location of E2F sites for each promoter, as the
actual E2F locations were different. We kept, however, the
same restricted distance for translocation of E2F sites as
those in simulated promoter sequence (50 bp centered on the
ancestral site). Since we had a limited number of real promot-
ers, we simulated 10,000 descendent sequences from each
ancestral promoter instead of 1,000 descendents as above.
The RTRs of E2F sites estimated in this way were highly con-
sistent with those using simulated ancestral sequences across
different divergence distances. As a result, the exponential
model given in equation 2 fitted well with the observed RTRs
(Figure 4b), where the model parameter λ was 0.0833 and
0.0755 for fitting mean and median values, respectively. Both
λ values were indeed slightly higher than the corresponding
ones starting from simulated ancestral sequences (Table 2),
but such small differences may easily be caused by other fac-
tors (for example, different locations of E2F sites).
To validate the good fit of estimated turnover rates with a
simple exponential model, we performed similar independ-
ent simulation studies for the additional TFBSs of Myc and
NFκB. Both Myc and NFκB have palindromic binding sites
with a length of 11 and 10 bases, respectively. Myc sites have
more conserved positions in the center region, consisting of
mixed A/T and G/C nucleotides, whereas NFκB has highly
conserved positions at the two sides, consisting of mostly G/
C nucleotides (Figure 3). Overall, Myc sites are the most
degenerate among the three TFBSs. These differences in
information content and sequence composition may lead to
different RTRs. It was instructive to see how these factors
affected the RTR, and whether the exponential model pro-
vided as good a fit for these other TFBS as well. For each
TFBS, we again simulated 1,000 ancestral promoter
sequences, and for each ancestral promoter sequence, we
simulated 1,000 descendent sequences at each of 15 diver-
gence distances as above. We also used the same substitution
and InDel models for the sequence evolution (Table 1). For
Pr( )
()
!
N
e
t
t
e
t
==
−
=
−
0
0
0
λ
λ
λ
(1)
Table 2
Estimated exponential rates associated with replacement turnovers of different TFBSs
TFBS Promoter λ
mean
λ
median
E2F Simulated 0.0832 0.0724
E2F Real 0.0833 0.0756
MycMax Simulated 0.2200 0.2293
NFκB Simulated 0.1032 0.0918
The probability of replacement turnover in evolution can be predicted by an exponential cumulative distribution function of divergence distance: RTR
= 1 - Exp (-
λ
× d).
λ
mean
and
λ
median
are estimated rates for mean and median values, respectively.
Genome Biology 2007, 8:R225
Genome Biology 2007, Volume 8, Issue 10, Article R225 Huang et al. R225.8
the purpose of comparison, we imposed the same location
and copy number constraints on both TFBSs as specified in
Figure 3.
Our results indicated that the RTR of Myc was consistently
more than two times higher than that of NFκB across all
divergence distances (Figure 5 and Table 2) For example, the
observed RTRs for Myc and NFκB were 0.219 and 0.083 at a
divergence distance of 1.0, and 0.373 and 0.167 at a diver-
gence distance of 2.0. These results suggested that differences
in sequence composition had a significant impact on the
RTRs of a TFBS. In this case, the sequence composition of the
NFκB site, which is G/C rich at the two sides and A/T rich in
the center, is more different from the background than that of
Myc, for which A/T and G/C positions are almost uniformly
distributed. Fitting the RTR data with our exponential model,
we observed again a good fit for both TFBSs (see Table 2 for
the estimated model parameters
λ
).
Turnover rates of regulatory modules: the Myc-E2F
pair
Both Myc and E2F are important transcription factors in
coordinating cell-cycle regulation, and partner together to
regulate some common target genes [34,35]. As a restricted
space between two TFBSs, that is, to enable an effective inter-
action, can limit the replacement turnover of each individual
TFBS, we were interested in assessing how two sites can
evolve together as a regulatory module. We studied the RTR
of the Myc-E2F pair in a simple scenario in which there was
one and only one pair of Myc-E2F in a promoter sequence.
For both E2F and Myc, we kept the location restriction rela-
tive to the TSS identical to the above studies on single sites,
and studied their RTRs by simulations with and without a
constraint of restricted space between them (Table 3). We
performed simulations at different divergence distances as
for individual sites above.
RTRs of Myc and NFΚB in simulated promoter sequencesFigure 5
RTRs of Myc and NFΚB in simulated promoter sequences. The x-axis denotes evolutionary divergence measured by the number of substitutions per site,
and the y-axis denotes the RTR of a TFBS in a descendent sequence. The figure shows that the predicted values (lines) from the exponential model given
in equation 2 fit well with observed RTR values (points) from an evolution simulation of (a) Myc and (b) NFΚB.
012345
6.05.04.03.02.01.00.
0
Divergence distance
Mean Median
012345
4.
03.02.01.
0
0.0
Divergence distance
Mean Median
(a) (b)
RTR
RTR
Table 3
Functional constraints placed on a Myc-E2F pair in promoter sequences
E2F location relative to TSS [-50, -100]
Myc location relative to TSS [-100, -150]
Copy number of E2F 1
Copy number of Myc 1
DNA strand of E2F site +
DNA strand of Myc site +
Additional space constraint between Myc and E2F sites [50, 60]
Genome Biology 2007, Volume 8, Issue 10, Article R225 Huang et al. R225.9
Genome Biology 2007, 8:R225
We calculated the observed RTRs of the Myc-E2F pair from
the simulated sequences, and compared them to the expected
ones assuming independent evolution of both sites. The
expected RTR of both sites, defined as the probability of
observing simultaneous replacement turnovers of both Myc
and E2F, was estimated as the product of the individual RTRs
from the simulation of single sites. The expected RTR of a sin-
gle site, defined as the probability of observing a replacement
turnover in only one site of the pair, was estimated from the
above simulation of individual sites. Results showed that the
expected RTRs were close to the observed ones in simulations
without an additional space constraint between two TFBSs
(Figure 6a,b), validating the independent evolution of both
sites. For the simulation with additional space constraints
between the pair, the observed RTRs of both sites showed sig-
nificant deviation from the predicted ones assuming inde-
RTR of a Myc-E2F pairFigure 6
RTR of a Myc-E2F pair. We calculated the observed RTRs of Myc-E2F from simulations with and without an additional space constraint between two
TFBSs, and compared the observed and expected RTRs assuming independence. The fit-1 lines are expected values based on the mean turnover rate of
individual TFBSs, and the fit-2 lines are expected values based on median turnover rate of individual TFBSs. Under simulation without space constraints
between the sites, the expected RTRs are close to the observed ones in both cases: (a) replacement turnover occurred at both Myc and E2F sites; (b)
replacement turnover occurred at only one of two sites. Under simulation with space constraint, the expected RTRs are higher than the observed ones
when (c) replacement turnover occurred at both Myc and E2F sites, but are close to observed ones when (d) replacement turnover occurred at only one
of the two sites. The models based on estimates of turnover for individual sites given in equations 3 and 4 fit the observed RTR data well in those cases
where no dependency between sites exists.
012345
02.051.001.050.000.0
Divergence distance
Mean
Median
fit−1
fit−2
012345
5.04.03.02.01.00.0
Divergence distance
Mean
Median
fit−1
fit−2
012345
02.051.0
01
.05
0
.000
.
0
Divergence distance
Mean
Median
fit−1
fit−2
012345
5.04.0
3
.02.01.00.0
Divergence distance
Mean
Median
fit−1
fit−2
(a)
(b)
(c)
(d)
RTR of both sites
RTR of single site
RTR of both sites
RTR of single site
Genome Biology 2007, 8:R225
Genome Biology 2007, Volume 8, Issue 10, Article R225 Huang et al. R225.10
pendent evolution, although the expected and observed RTRs
of single sites were still close (Figure 6d). The significantly
lower RTRs of both sites indicate that the space constraint
between two sites made it less likely for them to turn over
simultaneously (Figure 6c).
The small difference between the observed RTRs of the Myc-
E2F pair and the expected ones assuming independence of
individual TFBSs suggested that it was reasonable to describe
the independent evolution of two sites within a simple
predictive model. Based on this assumption, we thus
described the RTR of a given TFBS pair by:
where
λ
1
and
λ
2
are the expected Poisson rates of replacement
turnover events for TFBS 1 (E2F) and TFBS 2 (Myc).
Similarly, the probability of a replacement turnover of one
and only one of two TFBSs can be modeled by:
We fitted the observed RTR data with both models 3 and 4.
Both models fitted well with data as shown in Figure 6a,b,d,
validating our assumption for the independent evolution of
TFBSs. However, as the RTRs for the Myc-E2F pair in Figure
6c show, the simple models began to deviate from the simula-
tions in more complex scenarios including dependencies
between sites.
TFBS conservation between human and mouse
Because of the moderate divergence distance between mam-
malian genomes, such as those of human and mouse, there is
a strong interest in comparative studies of their genomes as
an important way to infer gene function and gene regulation
as well as their evolutionary mechanisms. While it is rela-
tively easy to compare the coding sequences of human and
mouse orthologous genes, it remains a difficult task to
compare their promoter sequences, largely because they are
more divergent than coding sequences. One pioneering com-
parative genomics study estimated that a fraction as high as
32-40% of the human functional TFBSs may not be functional
in rodents, suggesting a high turnover rate of TFBSs [6]. A
recent study estimated that the divergence distances of
human and mouse from the last common ancestor are 0.1187
and 0.3987 substitutions per site, respectively [46]. Another
study estimated the total divergence distance of human and
mouse at about 0.8 substitutions per site [47]. Based on these
two estimates, we here set the divergence distances of human
and mouse from their last common ancestor to be 0.2 and 0.6,
respectively, in terms of the number of substitutions per site
in neutrally evolving regions. In this study, we simulated
TFBS evolution of human and mouse from their last common
ancestral species in the hope of shedding some light on the
evolution of their TFBSs. Using the same three TFBSs as
above, we estimated RTRs of individual TFBSs in human and
mouse orthologous sequences at different InDel rates as well
as at different restricted translocation distances.
Effect of InDel rate variation
We again simulated 1,000 ancestral promoter sequences and
evolved 1,000 pairs of human and mouse descendent
sequences from each ancestral sequence, but this time vary-
ing the ratio of InDel to substitution rate from 0 (that is, no
InDels at all) to 0.2 (one InDel per five substitution events) at
ten different steps. Except for the InDel rate, we used the
same models and parameters as given in Table 1. We per-
formed three independent simulations for the TFBSs of E2F,
Myc and NFκB. The evolution of individual TFBSs was under
the same functional constraints as above (Figure 3).
Instead of calculating the TFBS RTRs from their common
ancestral sequences, we estimated the probability of observ-
ing replacement turnovers of individual TFBSs in at least one
species, which we defined as the RTR between human and
mouse. We found that at zero or very low InDel rates, the
RTRs of Myc and NFκB between human and mouse were
almost zero, whereas E2F had a low RTR (Figure 7). As
expected, RTRs of all TFBSs increased as the InDel rate
increased. The RTR of NFκB, however, was almost one mag-
nitude smaller than that of either E2F or Myc, indicating a
significant effect of the nucleotide composition of different
TFBSs. Our analysis suggested that the TFBS RTR between
human and mouse could be approximated by an exponential
function of the InDel rate given by:
Rate = -a + b × e
1.5γ
(5)
where a and b are parameters, and γ is the InDel rate. There-
fore, at a zero InDel rate (γ = 0), the base RTR is (b - a), which
cannot be less than the zero, implying that b must be larger or
equal to a. We found that this model fitted well with the RTR
data of all three TFBSs regardless of using the mean or
median value of the RTR (Figure 7). Estimates of model
parameters for the individual TFBSs are given in Table 4.
Influence of restricted translocation distance
TFBS often have a preferred location relative to the TSS, but
many TFBSs can move within a limited distance while main-
taining their regulatory function. Such a restricted transloca-
tion distance relative to the TSS may have an important
impact on TFBS evolution. In a final simulation, we studied
how the RTR of a TFBS between human and mouse was
affected by its restricted translocation distance.
We simulated TFBS evolution under 10 different restricted
distances of translocation ranging from 0 to 300 bp from the
original location of a TFBS in ancestral sequences, where we
set 20 bp as the minimum distance of a TFBS to TSS. For each
maximal translocation distance, we simulated 1,000
ancestral promoter sequences and 1,000 pairs of descendent
RTR e e
pair
tt
=− ×−
−−
()()11
12
λλ
(3)
RTR e e e e
one in pair
ttt t
__
() ()=− × + ×−
−−− −
11
121 2
λλλ λ
(4)
Genome Biology 2007, Volume 8, Issue 10, Article R225 Huang et al. R225.11
Genome Biology 2007, 8:R225
human and mouse sequences from each ancestral sequence
using the models given in Table 1. We performed a separate
simulation for the same three TFBSs, and estimated the RTR
between human and mouse as defined above. The RTR
between human and mouse increased approximately linearly
with the size of the restricted translocation range (Figure 8).
The means of the RTR could therefore be fitted well with a lin-
ear model given by:
where a, c1, c2 and c are model parameters, c is the product of
c1 and c2, and θ is the restriction translocation distance of a
TFBS. In this model, c1 and c2 are associated with the evolu-
tionary distances of species one and two from their last com-
mon ancestral species. Therefore, the TFBS RTR in a single
species is a linear function of the square root of its restricted
translocation distance. Interestingly, while the median RTRs
for E2F could also be fitted quite well with this model (Figure
6a), the fit for Myc and NFκB was less good, hinting at the
strong effects that different motifs can have on some of the
promoter features studied here.
Impact of transition/transversion ratio
To better simulate sequences of closely related species, which
generally have a higher ratio between transition and transver-
sion substitution rates than distantly related species, we used
a relatively large ratio of transition to transversion (20:1) in
all the above simulations. This large ratio made sense in our
case, as we simulated sequence evolution in a stepwise fash-
ion with a small divergence distance (0.05 substitutions per
site) at each step. To check whether a large change in transi-
tion to transversion ratio would have significant impact on
RTRs, we also ran all the above simulations at a much smaller
ratio of 4:1. We used the Wilcoxon rank sum test to check
whether the difference between the means of the resulting
RTRs was significantly different from zero (data not shown).
We found no statistically significant differences in our results
(Bonferroni-corrected significance level of P ≤ 0.05). The
results suggested that our observed replacement turnovers
were slow processes relative to nucleotide substitutions.
Evaluation of alignment tools
In addition to the theoretical studies regarding turnover
rates, the PSPE simulator can be used to assess the impact of
the turnover phenomenon on practical applications in com-
parative genomics. In the following, we looked specifically at
Figure 7
0.00 0.05 0.10 0.15 0.20
0.005 0.010 0.015 0.020 0.025 0.030
InDel rate
RTR
Mean
Median
0.00 0.05 0.10 0.15 0.20
0.000 0.005 0.010 0.015 0.020 0.025
InDel rate
RTR
Mean
Median
0.00 0.05 0.10 0.15 0.20
0.000 0.002 0.004 0.006
InDel rate
RTR
Mean
Median
(a)
(b)
(c)
Effect of different InDel rates on TFBS RTRFigure 7
Effect of different InDel rates on TFBS RTR. The x-axis denotes the InDel
rate measured by the number of InDel events per substitution events, and
the y-axis shows the RTR of a TFBS in a descendent sequence. The figure
shows that the exponential model given in equation 5 fits well with the
observed RTR values from simulation for all three TFBSs: (a) E2F, (b)
Myc, and (c) NFκB.
RTR a c c a c=+ × =+12
θθ θ
(6)
Genome Biology 2007, 8:R225
Genome Biology 2007, Volume 8, Issue 10, Article R225 Huang et al. R225.12
the problem of identifying functional binding sites in multiple
sequence alignments. Most current alignment tools are based
on the assumption that the functional sites in orthologous
sequences are homologous in sequence space, that is, that
they can be traced back to the same position in the ancestral
genome. Replacement turnover events of functional sites in
promoter sequences, however, make this assumption some-
what unrealistic, which could consequently limit the perform-
ance of a tool for aligning non-coding sequences. Our
evaluation aimed to: compare different multiple sequence
alignment tools for their robustness to violation of this
assumption; and investigate the impact of increasing the
number of species on tool performance.
We evaluated a set of representative MSA tools for their per-
formance in detecting TFBSs in several sets of orthologous
sequences, generated from an underlying phylogenetic tree of
five mammalian genomes (Figure 9). The rationale for using
the mammalian tree topology was to achieve a realistic
assessment of TFBS detection accuracy and to allow for a fair
comparison between different tools. First, in most compara-
tive genomics studies, species in comparison often have dif-
ferent divergence distances from their last common ancestor.
Second, it is also frequently assumed that an MSA tool should
work better when aligning more closely related species at the
beginning stage and adding more distantly related species in
later stages, especially for those based on a progressive
approach. We used evolutionary distances that were recently
inferred from coding regions [46], but evaluated the tree at
different scale factors as it is not generally known how well
these distances reflect the actual substitution rates in non-
coding regions. We extended the simulation to large diver-
gence distances to test the notion that conserved sites should
be readily picked up when the surrounding sequence has suf-
ficiently diverged. To assess the validity of our observations,
we consistently evaluated tool performance with additional
benchmark datasets, generated from a phylogenetic tree with
a star topology in which all descendent sequences had the
same evolutionary distance from their last common ancestral
sequence. The evaluation results are consistent with those
reported below (see Additional data file 2 for details).
We scaled the mammalian phylogenetic tree at eight different
levels from 0.25 to 5, relative to the actual distances, and gen-
erated a benchmark promoter dataset at each scale level
(defined as divergence scale coefficient), where each dataset
contained 1,000 replicates of orthologous promoter
sequences of the five species. Sequences were simulated
under the HKY85 nucleotide substitution model with gamma
and invariant rate (Γ+I) for modeling substitution rate heter-
ogeneity (Table 5). In the dataset, each sequence contained
exactly one functional binding site for each of the six tran-
scription factors: Pax6, TP53, IRF2, PPARG, ROAZ, and
YY1E2F. YY1E2F is a composite TFBS consisting of YY1 and
E2F binding sites that reportedly interact with each other in
cell cycle gene regulation [48]. Binding sites were subject to a
set of functional constraints (Table 6) that were set to allow
for turnover within a restricted distance, but keeping the
overall order of the binding sites unchanged. Simulation
allowed us to quantify the amount of turnover: how many
non-aligned functional sites were due to turnover compared
to 'simple' misalignments, and whether some tools would in
fact be able to align functional sites despite turnover.
We used this dataset to assess the performance of five widely
used MSA tools: CLUSTALW [49], DIALIGN [50], AVID/
MAVID [19,51], LAGAN/MLAGAN [27], and MUSCLE [20].
Among the five tools, AVID/MAVID is the fastest alignment
tool and uses exactly matching words as alignment seeds to
speed up the alignment process, albeit at the expense of lower
alignment accuracy. As an improvement, both DIALIGN and
LAGAN/MLAGAN adopt non-exact word matching for find-
ing alignment seeds, which can improve their ability to detect
degenerate functional sites. DIALIGN identifies alignment
seeds by finding consistent sequence segments of a fixed
length between sequences, while LAGAN/MLAGAN locates
alignment seeds by chaining together neighboring similar
words. Both CLUSTALW and MUSCLE are primarily based
on the dynamic programming algorithm. MUSCLE, however,
has made significant improvements over CLUSTALW by
employing anchoring techniques and a progressive refine-
ment approach. The performance was measured as TFBS
detection accuracy, defined as the proportion of nucleotides
in functionally homologous TFBSs that were correctly
aligned. The detection accuracy reported here is the average
value over 1,000 replicates at each divergence scale level.
Table 4
Estimated parameter values for the exponential model of RTR and InDel rate
Model for mean Model for median
TFBS name abab
E2F -0.216 0.226 -0.181 0.184
Myc -0.252 0.252 -0.265 0.265
NFκB -0.072 0.072 -0.035 0.035
Simulation results suggested that the TFBS RTR can be modeled by an exponential function of InDel rates given in equation 5. The values for
parameters a and b were estimated from observed mean and median values of RTRs at different InDel rates.
Genome Biology 2007, Volume 8, Issue 10, Article R225 Huang et al. R225.13
Genome Biology 2007, 8:R225
For the two species (human and baboon) alignment, all five
tools showed high detection accuracies of TFBS with no sig-
nificant difference between each other (Figure 10a(1)). When
adding more distant species, such as mouse, to the alignment,
we found that TFBS detection accuracies of all tools were
dramatically decreased, especially those of MAVID and
CLUSTALW (Figure 10b(1),c(1),d(1)). Again, we observed
marked differences in performance between different tools
for three or more species alignments. Overall, MUSCLE had
the highest detection accuracy among all tools across all
divergence scale coefficients; MAVID had a slightly worse
performance than all other tools; and CLUSTALW, DIALIGN
and MLAGAN showed similar performance, although their
relative order in performance varied with the number of spe-
cies or a change of the divergence scale coefficient. As
expected, the TFBS detection accuracy decreased for all tools
as the divergence scale coefficient increased. PSPE also
allowed us to consider only the set of sites that had not turned
over, and the relative performance of tools was unchanged
(Figure 10a(2),b(2),c(2),d(2)). With increasing distance, a
large fraction of sites has turned over, but many of those trace
back to the same ancestral nucleotides in several descend-
ants, due to turnover before a branch in the tree or convergent
evolution. These sites should thus be aligned and are counted
positive in at least some of the pairwise comparisons that our
metric is based on, even if they are not in the location of the
original TFBS (see Additional data file 2 for more evaluations
on turnover sites).
Figure 8
0 50 100 150 200 250 300
70.060.05
0
.040.030.02
0
.
0
1
0
.
00
0
.
0
Translocation distance
Mean
Median
(a)
RTR
0 50 100 150 200 250 300
5
00.0400.03
0
0
.
0200.0
1
0
0
.0
Translocation distance
Mean
Median
(c)
RTR
0 50 100 150 200 250 300
57
00
.
00
7
0
0
.
05
6
00.006
0
0
.
0
Translocation distance
Mean
Median
(b)
RTR
Effect of restricted translocation distance on TFBS RTRFigure 8
Effect of restricted translocation distance on TFBS RTR. The x-axis is the
restricted translocation distance relative to the original binding site in the
ancestral sequence, and the y-axis is the RTR of TFBSs. The points are the
RTR observed in simulations, and lines are values predicted by the model
given in equation 6: (a) E2F, (b) Myc, and (c) NFκB.
Phylogenetic tree of five mammalian genomesFigure 9
Phylogenetic tree of five mammalian genomes. The evolutionary distances
shown in the tree were recently inferred from the coding region of
orthologous genes [46]. In our simulation, we used the tree scaled at eight
different levels relative to the evolutionary distances shown.
human
mouse
baboon
dog
cow
0.0238
0.0331
0.0939
0.3987
0.0229
0.1644
0.1620
0.0269
root
Genome Biology 2007, 8:R225
Genome Biology 2007, Volume 8, Issue 10, Article R225 Huang et al. R225.14
The ability of a tool to detect the presence of a common TFBS
varied among different TFBSs, depending on TFBS base com-
position, length, and restricted translocation distance, as well
as the divergence scale coefficient of the phylogenetic tree.
For example, Figure 11 shows that detection accuracies dif-
fered significantly among TFBSs in the alignments of the five
species. In addition, the same figure shows that all tools had
higher detection accuracies for TFBSs with low RTRs, such as
YY1E2F and Pax6, than those with high RTRs, such as IRF2
and ROAZ. While MUSCLE showed a better performance
than all other tools, CLUSTALW as the oldest tool performed
slightly better than DIALIGN, MAVID, and MLAGAN in at
least some cases (YY1E2F and ROAZ). Additionally, for
YY1E2F, Pax6 and TP53, MUSCLE showed higher TFBS
detection accuracies than the baseline of SimuALN,
suggesting its capability of correctly aligning at least some
TFBSs subject to turnover, that is, homologous only at the
functional level. At large divergence scale coefficients, how-
ever, no tool seemed to perform well in detecting ROAZ.
When looking at the performance of each tool individually
(Figure 12), we found that the TFBS detection accuracies of all
tools decreased when adding one or more distant species to
the human/baboon alignment. For alignments from three to
five species, the TFBS detection accuracies of DIALIGN and
MUSCLE showed little change, those of CLUSTALW and
Table 5
Simulation parameters used by PSPE for generating benchmark promoter sequences
Evolution distance per step 0.05 substitution per site
Length of root sequences 3,000 bp
Background sequence model Markov order of third
Base frequencies A = 0.258, C = 0.242, G = 0.242, T = 0.258
Substitution model HKY85
Transition:transversion ratio 20:1
Rate heterogeneity Gamma (1.0) + Iota (0.1)
Range of GC content (0.45, 0.55)
Gap model Negative binomial distribution (1, 0.5)
Table 6
Functional TFBS constraints used in the promoter simulation
Name Accession no. Length (bp) Strand Location (min, max) Copy no. (min, max) Cutoff
YY1E2F MA0095 (YY1)
MA0024 (E2F)
13 + (20, 30) (1, 1) 0.90
Pax6 MA0069 14 + (50, 70) (1, 1) 0.90
TP53 MA0106 20 + (360, 400) (1, 1) 0.90
IRF2 MA0051 18 + (420, 480) (1, 1) 0.90
PPARG MA0066 20 + (2000, 2080) (1, 1) 0.90
ROAZ MA0116 15 + (2100, 2200) (1, 1) 0.90
The accession numbers in the second column are from the JASPAR database [39]. 'Location' refers to the restriction on the upstream minimum and
maximum distances to transcription start site. YY1E2F is a composite TFBS created by joining the YY1 and E2F sites.
Average TFBS detection accuracy of five alignment toolsFigure 10 (see following page)
Average TFBS detection accuracy of five alignment tools. The y-axis shows the TFBS detection accuracy average of six TFBSs, and the x-axis is the
divergence scale coefficient of the mammalian phylogenetic tree (Figure 9). SimuALN stands for the simulated alignment and its measure indicates the
proportion of TFBS nucleotides not subject to replacement turnover in descendent sequences, and thus aligned in simulated alignments. Plots in the left
panel show the overall detection accuracy of all functional TFBSs, while those in the right panel show the detection accuracy on the subset of TFBSs that
had not turned over. Note that insertion and deletion events may affect parts of a binding site (these are still included in the evaluation), and that SimuALN
consequently does not reach a level of one in the right panels. (a) Two species alignments of human and baboon. (b) Three species alignments of human,
baboon and mouse. (c) Four species alignments of human, baboon, mouse, and dog. (d) Five species alignment.
Genome Biology 2007, Volume 8, Issue 10, Article R225 Huang et al. R225.15
Genome Biology 2007, 8:R225
Figure 10 (see legend on previous page)
12345
0.6 0.7 0.8 0.9 1.0
Divergence Scale Coefficient
TFBS Detection Accuracy (Average)
clustalw
dialign
mavid
mlagan
muscle
SimuALN
12345
0.6 0.7 0.8 0.9 1.0
Divergence Scale Coefficient
TFBS Detection Accuracy (Average)
clustalw
dialign
mavid
mlagan
muscle
SimuALN
12345
0.6 0.7 0.8 0.9 1.0
Divergence Scale Coefficient
TFBS detection accuracy (average)
clustalw
dialign
mavid
mlagan
muscle
SimuALN
12345
0.6 0.7
0.8
0.9 1.0
Divergence Scale Coefficient
TFBS detection accuracy (average)
clustalw
dialign
mavid
mlagan
muscle
SimuALN
12345
0.6 0.7 0.8 0.9 1.0
Divergence Scale Coefficient
TFBS detection accuracy (average)
clustalw
dialign
mavid
mlagan
muscle
SimuALN
12345
0.6 0.7 0.8 0.9 1.0
Divergence Scale Coefficient
TFBS detection accuracy (average)
clustalw
dialign
mavid
mlagan
muscle
SimuALN
12345
0.6 0.7 0.8 0.9 1.0
Divergence Scale Coefficient
TFBS detection accuracy (average)
clustalw
dialign
mavid
mlagan
muscle
SimuALN
12345
0.6 0.7 0.8 0.9 1.0
Divergence Scale Coefficient
TFBS detection accuracy (average)
clustalw
dialign
mavid
mlagan
muscle
SimuALN
(a)
(b)
(c)
(d)
Genome Biology 2007, 8:R225
Genome Biology 2007, Volume 8, Issue 10, Article R225 Huang et al. R225.16
MLAGAN had a noticeable change and that of MAVID
markedly decreased, especially at large divergence scale coef-
ficients. We also compared tool performance again with
respect to overall alignment sensitivity and TFBS sensitivity.
We found that in terms of alignment sensitivity, MUSCLE
and CLUSTALW had slightly better overall performance than
the other three (data not shown). The ranks according to
TFBS sensitivity were also in the same order as those accord-
ing to detection accuracies, and this was also true if we con-
sidered non-turnover sites only (Figure 13).
Discussion
In the process of evolution, selection may act directly on reg-
ulatory functions but only indirectly on gene sequences,
which is supported by the experimental observations that
some orthologous genes with highly conserved expression
patterns have substantial divergence in their promoter
sequence [7-9]. That means that functional conservation does
not necessitate conservation on the sequence level. Neutral
sites in promoter sequences may be free to change, and newly
evolved functional sites can readily replace old ones. It is
important, therefore, to understand the evolutionary
mechanisms of regulatory regions in order to improve com-
putational methods that are developed to analyze them. How-
ever, it is difficult to investigate systematically non-protein-
coding evolution on real sequence data because the history of
evolutionary events shaping them is largely unknown, and the
map of functional sites in regulatory sequences is often
incomplete and inaccurate. In many cases, there is no simple
way to distinguish a site newly evolved in a replacement
turnover event from one created by simple translocation of an
old site. Computational simulation seems to be an effective
alternative to study TFBS evolution in this case. Simulators
allow us to investigate evolutionary events such as replace-
ment turnovers of TFBS, which may significantly limit the
effectiveness of phylogenetic footprinting for regulatory
region identification, in an explicit way. Here, we describe a
new sequence simulator to investigate the effect of different
functional constraints on turnover rates, and to create a
framework to evaluate multiple sequence alignment algo-
rithms regarding their ability to detect functional elements in
the presence of turnover events.
Simulation of TFBS turnover
Our simulator PSPE is designed specifically for studying the
evolution of functional sites in regulatory sequences. PSPE is
not only able to use one of many common models of nucleo-
tide substitution, but it can also apply different InDel models
important for regulatory sequence simulation. In contrast to
other simulators, PSPE imposes a variety of functional con-
straints instead of sequence constraints. Such functional con-
straints include GC content, presence of functional sites,
strength of the binding sites, location and copy number
restrictions on functional sites, and space constraints
between different functional sites. All these features enable
PSPE to simulate evolution of promoter sequences more real-
istically than other simulation programs.
Consistent with previous simulation studies [5,14], our
results show that TFBS turnover can occur rapidly in pro-
moter evolution. For example, replacement turnover events
can occur at a Poisson rate as high as 0.083 for the highly con-
strained E2F sites even if we only allow for a small transloca-
tion distance of 50 nucleotides, and is even higher for the less
constrained sites of Myc (0.22) and NFκB (0.103). Further-
more, these parameters may be relatively conservative
considering that we used stringent matrix score cutoffs to
avoid false hits, highly restricted locations for functional sites,
a relatively low rate for transversions, and the requirement of
the presence of exactly one functional site throughout.
However, a high turnover rate of TFBSs can frequently be det-
rimental to an organism, and highly increased turnover rates
may not be observed in practice, even for degenerate sites.
This is supported by an additional simulation study we car-
ried out using a lower cutoff threshold of 0.85 for functional
sites, in which promoters with Myc sites had a lower RTR
despite the higher chance of creating a new site at the lower
cutoff. This was mainly due to our restriction of allowing only
one site to be present in the promoters (see Additional data
file 1 for details). Therefore, TFBS replacement turnovers in
real sequences may happen more frequently than we
estimated, but there is an upper limit of turnover rate for each
individual TFBS imposed by the resulting changes in fitness.
Altogether, our study suggests that the TFBS RTR of a func-
tional site between different species does not depend only on
the base composition of the site and the divergence distances
between species, but also on location constraints, neighbor-
ing functional sites, the InDel rate, and the GC content. While
not discussed in detail, a simulation using lower GC contents
showed a consistently higher or lower RTR depending on the
TFBS, suggesting that the high GC content in promoter
regions near the TSS is affecting the turnover rates of
important functional sites (Additional data file 1).
Consequently, the RTR varies not only among different func-
Detection accuracy of individual TFBSs on five-way mammalian alignmentsFigure 11 (see following page)
Detection accuracy of individual TFBSs on five-way mammalian alignments. All five tools perform better at detecting YY1E2F and Pax6, which have low
RTRs and short restricted distance for translocation, than IRF2 and ROAZ, which have high RTR and long restricted distance for translocation. MUSCLE
shows an overall better performance than the other four tools. MLAGAN performs better than DIALIGN on YY1E2F, PAX6, PPARG and ROZA, while
DIALIGN shows a better performance than MLAGAN on TP53 and PPARG, which have a long restricted distance for translocation but a relatively low
RTR.
Genome Biology 2007, Volume 8, Issue 10, Article R225 Huang et al. R225.17
Genome Biology 2007, 8:R225
Figure 11 (see legend on previous page)
12345
0.3
0.4 0.5 0.6 0.7 0.8 0.9 1.0
Divergence scale coefficient
TFBS detection accuracy (YY1E2F)
clustalw
dialign
mavid
mlagan
muscle
SimuALN
12345
0.3
0.4
0.5 0.6 0.7 0.8 0.9 1.0
Divergence scale coefficient
TFBS detection accuracy (Pax6)
clustalw
dialign
mavid
mlagan
muscle
SimuALN
12345
0.3
0.4 0.5 0.6 0.7 0.8 0.9 1.0
Divergence scale coefficient
TFBS detection accuracy (IRF2)
clustalw
dialign
mavid
mlagan
muscle
SimuALN
12345
0.3
0.4 0.5
0.6
0.7
0.8 0.9
1.0
Divergence scale coefficient
TFBS detection accuracy (TP53)
clustalw
dialign
mavid
mlagan
muscle
SimuALN
12345
0.3
0.4 0.5 0.6 0.7 0.8 0.9 1.0
Divergence scale coefficient
TFBS detection accuracy (PPARG)
clustalw
dialign
mavid
mlagan
muscle
SimuALN
12345
0.3
0.4
0.5 0.6 0.7 0.8 0.9 1.0
Divergence scale coefficient
TFBS Detection Accuracy (ROAZ)
clustalw
dialign
mavid
mlagan
muscle
SimuALN
Genome Biology 2007, 8:R225
Genome Biology 2007, Volume 8, Issue 10, Article R225 Huang et al. R225.18
tional sites and different species, but also among different
instances of the same functional site upstream of different
genes.
While we attempted to choose realistic model parameters and
biologically meaningful functional constraints in our
simulations, our estimates are certainly biased by the
assumptions behind the chosen constraints, and may be sub-
stantially different from the real ones. Furthermore, the TFBS
and evolution models themselves represent simplified
versions of the underlying biological processes, and other fac-
tors, such as the number of replicates used in the simulation,
can add some additional variation as well. We realize that the
weight matrices used here as models of functional sites may
not be as adequate for modeling positional dependencies as
other more advanced motif models [52,53]; however, PWMs
are a valid model for many biological motifs, are available in
open-access databases, and are computationally more effi-
cient than other advanced models. Computational efficiency
is an important factor in simulation studies that are as large
as this one.
Simple evolutionary changes within regulatory regions, such
as turnover events affecting individual sites only, can be
modeled effectively by Poisson events. We could show good
agreement of this for a variety of binding sites and conditions,
such as different translocation distances. In theory, one could
derive closed-form solutions for the probability of these
events, based on the sequence composition of the region and
the composition and degeneracy of a binding site. However,
with an increasing number of restrictions and dependencies
of sites in complex regulatory modules, this becomes increas-
ingly cumbersome and not straightforward. Figure 6c showed
that these simple models begin to deviate as soon as we
address the conservation on the module level instead of indi-
vidual sites only.
One can easily think of a large number of additional parame-
ters and configurations of functional sites that we did not
explore. A tool such as PSPE will allow researchers to explore
empirically a wider range of restrictions and complex config-
urations of regulatory regions in an efficient manner.
Enhancers come in many different flavors, from highly
restricted 'enhanceosomes' corresponding to ultra-conserved
elements, to highly flexible 'billboard' enhancers allowing for
many drastic sequence changes without apparent functional
consequence [54]. PSPE is available to the public and we
anticipate that it will be a beneficial tool for evolutionary biol-
ogists to explore the specific characteristics and evolutionary
space of particular regulatory systems. Future extensions may
include an adaptation for RNA regulatory regions, including
specific modeling of compensatory mutations in RNA second-
ary structure, incorporating transposable elements, and
neighbor-dependent substitution models.
Assessment of MSA tools
During evolution, natural selection forces impose different
functional constraints on protein coding and regulatory
regions. The phenomenon of frequent TFBS turnovers in reg-
ulatory regions may partially explain why comparative
genomics analysis, the most powerful approach so far, has
met with only limited success in identifying functional sites
despite the increasing availability of whole genome
sequences. TFBS turnovers may also be responsible for the
weak relationship between sequence conservation and func-
tional conservation in promoter sequences, which makes the
straightforward tracing of nucleotide evolution between
divergent orthologous sequences meaningless with respect to
their function. Our strategy of defining conservation on the
level of functional constraints such as matrix score cutoffs is
similar to a recent model, which defines conservation on the
level of conserved binding energy [55]. In this sense,
functional homology maps of regulatory regions, where
mapped elements correspond to functionally equivalent sites,
can be more important than strict sequence homology.
While many alignment tools have been developed so far, it is
difficult to systematically evaluate and compare these tools,
especially regarding their performance in aligning non-cod-
ing sequences, for which we have a limited understanding of
evolutionary constraints. Studies that rigorously assess align-
ment tools (for example, [28]) can serve as useful reference
for making more informed decisions about which tool to use
for which task, and can also provide important insights or
suggestions for improvement of existing algorithms. Most
published evaluations of alignment algorithms were based on
alignment sensitivity, specificity, and accuracy, and did not
address replacement turnover of functional sites in evolution.
The evaluation reported here is different: instead of trying to
systematically assess all different performance aspects, we
focus on one particular scenario, the capability of accurately
aligning conserved TFBS in promoter sequences. Specifically,
our evaluation was based on two aspects: the capability of
aligning functionally homologous TFBS in promoter
sequences in which TFBS replacement turnovers are allowed
to occur; and the capability of increasing TFBS detection
power with an increase in the number of homologous aligned
species.
Effects of the number of aligned mammalian species on the TFBS detection accuracyFigure 12 (see following page)
Effects of the number of aligned mammalian species on the TFBS detection accuracy. Each panel shows the performance of a tool in aligning a different
number of species. Human and baboon were used for the two species alignment, mouse was added for the three species alignment, and all five species but
cow were used for four species alignment. While all tools have almost the same performance for aligning the two closely related species human and
baboon, MUSCLE and DIALIGN performed better than other tools in maintaining or improving performance when adding more species to the alignment.
Genome Biology 2007, Volume 8, Issue 10, Article R225 Huang et al. R225.19
Genome Biology 2007, 8:R225
Figure 12 (see legend on previous page)
12345
0.6 0.7 0.8 0.9 1.0
Divergence scale coefficient
TFBS detection accuracy (average)
two
three
four
five
CLUSTALW
12345
0.6 0.7 0.8 0.9 1.0
Divergence scale coefficient
TFBS detection accuracy (average)
two
three
four
five
DIALIGN
12345
0.6 0.7 0.8 0.9 1.0
Divergence scale coefficient
TFBS detection accuracy (average)
two
three
four
five
MAVID
12345
0.6 0.7 0.8 0.9 1.0
Divergence scale coefficient
FBS detection accuracy (average)
two
three
four
five
MLAGAN
12345
0.6 0.7 0.8 0.9 1.0
Divergence scale coefficient
TFBS detection accuracy (average)
two
three
four
five
MUSCLE
Genome Biology 2007, 8:R225
Genome Biology 2007, Volume 8, Issue 10, Article R225 Huang et al. R225.20
The five tools selected for our evaluation are representatives
of many existing tools of different underlying algorithms.
These differences were clearly reflected in the success of
aligning TFBSs, which ranked MUSCLE at the top, AVID/
MAVID at the bottom, and others in between. We purpose-
fully chose transcription factors with long binding sites, and
required strong conservation of orthologous sites (that is, a
high matrix score threshold for each site). Furthermore, while
our choice of constraints allowed for turnover events, it did
not allow for a shuffling of sites, which none of the programs
can take into account. Yet, our results suggest that the ability
of existing tools to detect functionally homologous elements
decreases with increasing replacement turnover rates of func-
tional sites or, related, the sequence divergence distance. An
increased divergence of the non-functional parts of the
sequence does thus not necessarily help to locate individual
functional binding sites, even if the sites are highly conserved
and 15-20 bp long.
It is often reported that an increase in the number of species
may significantly increase the power for functional site
identification in comparative genomics analyses [56]. On the
contrary, our evaluation results show that we should be
extremely cautious at this point to assume that this is a gen-
eral property of many functional DNA regions and/or tools to
analyze them. With the exception of DIALIGN, the TFBS
detection accuracy of all tools was either decreased or
relatively unchanged in most cases. This is in fact not surpris-
ing when ones take a closer look at the approaches used for
multiple sequence alignment. CLUSTALW, MAVID, and
MLAGAN all use the same progressive approach for aligning
multiple sequences, in which intermediate alignments from
the early stages are not allowed to change in later stages. That
means that the mistakes that happen in an early stage of
alignment will be propagated and cannot be corrected at a
later stage. Since a tool based on the progressive approach
can only accumulate more mistakes when aligning more
sequences, it is conceivable that its performance decreases as
the number of species increases. MUSCLE employs an
improved progressive approach that allows changes in the
alignment of sub-groups in a recursive refinement process,
which explains why MUSCLE did not show a significant
decrease in performance as the number of species increased.
It is conceivable, however, that the particular choice of spe-
cies, and the order in which they are presented to a
phylogenetic aligner, may significantly change the accuracy of
these approaches. DIALIGN is the only tool surveyed here
that does not use the progressive approach. Instead, it assem-
bles the whole alignment by greedily finding all consistent
segments of significant similarity from all sequences [57],
which allows DIALIGN to be able to take advantage of the
information from additional species. While these features of
DIALIGN are interesting, there is still much room for
improvement as its overall performance is no better than
MUSCLE.
We want to stress that the tools in this study were not specif-
ically developed for the alignment of non-coding regions. In
The average TFBS sensitivity of five tools in aligning TFBS in five mammalian speciesFigure 13
The average TFBS sensitivity of five tools in aligning TFBS in five mammalian species. (a) The average TFBS sensitivity of all functional TFBSs. (b) The
average TFBS sensitivity with the subset of non-turnover sites among all TFBSs. The relative order of TFBS sensitivity for the five tools is almost the same
as the order of their TFBS detection accuracy (Figure 10d).
12345
0.4 0.5 0.6 0.7 0.8 0.9 1.0
Divergence distance
Sensitivity (average)
clustalw
dialign
mavid
mlagan
muscle
12345
0.4 0.5
0.6
0.7 0.8 0.9 1.0
Divergence distance
Sensitivity (average)
clustalw
dialign
mavid
mlagan
muscle
(a) (b)
Genome Biology 2007, Volume 8, Issue 10, Article R225 Huang et al. R225.21
Genome Biology 2007, 8:R225
fact, some design principles may be counterproductive for
this task: whole genome alignments are built to provide fast
comparative maps and are certainly able to detect coding
conservation. The progressive aligners in our evaluation are
meant to provide the phylogenetic history, that is, to compute
an accurate alignment of bases that are derived from the same
nucleotide in the ancestral genome. Yet, there is no doubt that
many researchers currently use these tools in studies con-
cerning gene regulatory sequences, and we hope that this
evaluation provides clues about what to expect if they are
used in this way. We aimed to include a representative subset
of tools fast enough to perform extensive comparisons. We do
not expect this to have introduced a systematic bias, but of
course some recently developed aligners (for example, TBA
[58], Prank [59], or Probcons [60]) may perform differently
to our selected set.
The objective and systematic evaluation of alignment tools is
a challenging task, in particular for an assessment on non-
coding sequences whose actual functional and evolutionary
mechanisms remain largely unknown. Since we simulated
data under a set of specific conditions that are unlikely to
represent all actual scenarios, one should carefully interpret
our comparison results. For example, our study did not con-
sider the ability of a tool to deal with very large insertions and
deletions because of few large insertions/deletions in our
simulated data. Furthermore, we were very conservative in
our constraints, and, for example, allowed for turnover, but
not for a shuffling of sites. Our results are therefore a rather
optimistic estimate, and performance on real promoters with
shorter sites that do not preserve their order can be expected
to be significantly worse. We are also aware that the criteria
for tool performance can be different in a different study
depending on its objectives. Therefore, our results may not be
applicable for some studies, such as the estimation of diver-
gence distances between species. For such cases, the recent
evaluation by Pollard et al. [29] may be a better reference.
Conclusion
TFBS replacement turnover is an important phenomenon in
the process of promoter evolution, and providing a
framework to address it systematically is critical for our
understanding of the mechanisms driving promoter evolu-
tion. We introduced the new simulation system PSPE,
designed specifically for regulatory sequences, and allowing
for functional site turnover events. PSPE is freely available at
the authors' websites [61,62]. Applying PSPE in a large-scale
simulation, we found that replacement turnovers could hap-
pen rapidly in promoter evolution. We also investigated dif-
ferent factors besides the divergence distance that
significantly affect turnover rates, and describe the relation-
ships between the RTR and different factors in simple math-
ematical models. Our study adds to the increasing evidence
that it is important and advantageous to trace homology on
the functional rather than on the sequence base-pair level in
cross-species comparisons of regulatory sequences.
PSPE also provides a flexible system to generate appropriate
standard test sets for alignment or motif finding algorithms,
and we presented first results of this application. To our
knowledge, our evaluation of MSA tools is the first one to
assess their ability to detect TFBSs that are homologous on a
functional level. Our evaluation of five widely used MSA tools
suggests that the turnover of functional sites poses a chal-
lenge for alignment tools, even for the simplified case where
the functional sites remain co-linear in orthologous
sequences. While all MSA tools under consideration, espe-
cially MUSCLE, performed well in aligning functional sites at
short or moderate divergence distances, they appeared to lack
sufficient capability to align functional sites that have high
RTRs in divergent sequences. In addition, our study suggests
that the widely used progressive approach for MSA is coun-
terproductive for the multiple alignments of homologous
non-coding sequences, and that MUSCLE's improved
progressive approach and DIALIGN's segment assembling
approach are better suited for non-coding MSA. Some recent
approaches are promising to successfully deal with the spe-
cific challenges of non-coding alignments, for example, by
using available models of TFBS to 'anchor' alignments [63].
However, this still leaves us with a number of open issues on
the way towards computational tools that will help us to elu-
cidate the structure and evolution of regulatory regions.
Materials and methods
Background model of ancestral sequences
To generate biologically relevant ancestral sequences, we
used a 3rd order Markov model to generate background
sequences of ancestral promoters. We trained the back-
ground Markov model on a large real dataset of regulatory
sequences extracted from the NCBI human RefSeq database
(build 35). The dataset consists of 25,088 human promoter
sequences each spanning a region of 500 bp immediately
upstream of the transcription start sites. The base frequencies
of four nucleotides were also estimated on this dataset.
Selection of E2F regulated ancestral genes
We obtained 127 experimentally confirmed E2F regulated
genes from a previous publication [42]. We removed the
genes for which we were not able to extract their promoter
sequences from NCBI, and extracted 500 bp long promoter
sequences upstream of their annotated transcription start
site. We then identified potential E2F sites in each promoter
sequence using the PWM model. We removed those genes
that had either zero or more than one E2F binding site based
on the cutoff score of 0.92 given in Figure 3. The remaining 11
genes are given in Additional data file 1 and were used as
ancestral sequences for our simulation study.
Genome Biology 2007, 8:R225
Genome Biology 2007, Volume 8, Issue 10, Article R225 Huang et al. R225.22
Motif model of TFBSs
We used the PWM, a generic and widely used model for DNA
motifs, to represent functional TFBSs. The PWM is generally
given by a matrix with frequencies (or weights) of the four
nucleotides at each position. While there are several different
methods to calculate a motif score, we used a scoring function
similar to the one proposed by [64] and defined by:
The function gives a normalized score from 0 to 1 for any
TFBS, with 0 for the most unlikely and 1 for the most likely
site. A functional binding site defined in this study is a site
having a score larger than a certain cutoff threshold.
Position weight matrices of E2F, Myc, and NFκB were taken
from the JASPAR database [39,65]. The functional sites in
simulated ancestral sequences were generated from these
PWMs. To maintain a low false positive rate of binding sites,
we chose a relative strict cutoff score for each TFBS. At a cut-
off score of 0.92, we estimated the fraction of false positive
predictions to be less than 5% of the total number of planted
sites on coding regions of human genes in the RefSeq
database.
DNA substitution models
PSPE is able to use many different commonly used models for
nucleotide substitution, including Jukes-Cantor (JC) [66],
Felsenstein 1981 (F81) [67], Kimura 2-parameter (K80) [68],
Hasegawa-Kishino-Yano (HKY) [40], Tamura-Nei (TrN)
[69], and the general time reversible (GTR) model [70-72].
The GTR model has eight free parameters with the following
instantaneous substitution rate matrix:
where
μ
ij
is the instantaneous substitution rate of nucleotide i
by j,
π
i
is the frequency of nucleotide i, and
where i = a, c, t, g; j = a, c, t, g. The other substitution models
above can be expressed as special cases of the GTR model.
From the Q matrix, we can obtain the matrix of nucleotide
transition probabilities in continuous time by:
P(t) = e
kQrt
where k is a correction factor, which is used to scale the sub-
stitution matrix such that branch lengths represent the
expected number of substitutions per site, and r is the relative
substitution rate to model heterogeneous substitution rates
among different sites. Based on the Γ+I model [73,74], the
relative rates at each position follow the same independent
and identical distribution as defined by:
where ι is the proportion of invariant rates and α is the shape
parameter of the gamma distribution.
InDel models
PSPE is based on Dawg [75], an earlier sequence evolution
simulation system, and in particular adopted its range of
InDel formation model. The model is based on a Poisson
process that assumes InDel formation to happen at a fixed,
instantaneous rate at any site. The model treats insertions
and deletions as two separate processes. Under the model, the
time intervals between two insertions and those between two
deletions follow exponential distributions with means [λ
Ins
(L
+ 1)]
-1
and [λ
Del
(L + u - 1)]
-1
, respectively, where L is the
sequence length, u is the mean length of deletion segments,
and λ
Ins
and λ
Del
are Poisson rates of insertion and deletion,
respectively.
PSPE models InDel length by one of three commonly used
distributions: geometric, negative binomial, and Zipf's law
distributions. We used the simple geometric distribution for
InDel length in this study.
Simulation of sequence evolution
To address TFBS turnover at different distances, we simu-
lated sequence evolution at each of 15 different divergence
distances: 0.01, 0.05, 0.1, 0.25, 0.5, 0.75, 1.0, 1.25, 1.5, 1.75,
2.0, 2.5, 3.0, 4.0, and 5.0, measured in the number of substi-
tutions per site. These distances should cover the divergence
between most currently sequenced genomes used in compar-
ative genomics studies. To study the effect of different InDel
rates on TFBS conservation between human and mouse, we
performed simulations at ten different InDel rates measured
by the number of InDels per substitution: 0, 0.01, 0.025,
0.05, 0.075, 0.1, 0.125, 0.15, 0.175, 0.2, with, for example, 0
meaning no InDel, and 0.2 meaning one InDel every five sub-
stitutions. For studying the effects of restricted translocation
distances on the RTRs, we compared RTRs of each TFBS at 12
different maximal translocation distances: 0, 5, 10, 20, 30,
40, 50, 75, 100, 150, 200, and 300 bases.
Model fitting method
To estimate parameters of our RTR models, we did a non-lin-
ear least-squares regression analysis on the observed turno-
ver data from simulation. We used the Gauss-Newton
algorithm for the non-linear least-squares fitting, which
Score
i
f
i
b
i
w
ibACGT
f
i
b
i
w
f
=
×
=
∑
×
∈
=
∑
=+ ×
θ
θ
θ
1
1
14
max
(,,,)
lnwhere
i ii
b
i
b
b
fi wln( ), .
∑
= 1
Q
q
q
q
aa ac c ag g at t
ca a cc cg g ct t
gg a gc c gg gt t
t
=
μπ μπ μπ
μπ μπ μπ
μπ μπ μπ
μ
tt a tc c tg t tt
q
πμπμπ
⎡
⎣
⎢
⎢
⎢
⎢
⎢
⎤
⎦
⎥
⎥
⎥
⎥
⎥
q
ii ij j
ji
=
≠
∑
μπ
fr
if r
if r
re r ifr
r
(| ,)
()() /()
αι ι
ια α
αα
=
<
=
−⋅ >
⎧
⎨
⎪
⎩
⎪
−
00
0
10
Γ
Genome Biology 2007, Volume 8, Issue 10, Article R225 Huang et al. R225.23
Genome Biology 2007, 8:R225
minimizes the sum-of-squares error. We performed this anal-
ysis in R.
Alignment tools
We selected five alignment tools, CLUSTALW, DIALIGN,
AVID/MAVID, LAGAN/MLAGAN, and MUSCLE, to assess
their capability of detecting functional sites. The criteria for
our selection were: either widely used or shown good per-
formance in other studies for aligning DNA sequences; capa-
ble of aligning multiple sequences in a reasonable amount of
time; free availability and easy installation in the Linux oper-
ating system; and strict co-linearity for global alignment.
Many excellent alignment tools were not evaluated because:
they did not meet one of the above criteria; their algorithms
were similar to one of five tools we selected; and/or they did
not show a significantly different performance in other
evaluations. For example, ACANA [21], BLASTZ [76],
MUMmer [77], and SSEARCH [78] were not selected because
of the first criterion, and T-COFFEE [22], POA [79] and
MAFFT [80] were not evaluated due to the second criterion.
Our study is therefore not considered to be a systematic eval-
uation of all available good alignment tools and rather as a
representative but somewhat subjective cross-section. Each
of the five tools is briefly described below.
CLUSTALW (v1.83) is one of the best-known MSA tools and
is based on a progressive method, which first aligns the most
similar sequences and then successively adds more distant
sequences or groups to the alignment until all sequences are
aligned together. CLUSTALW employs the Needleman-Wun-
sch pair-wise alignment algorithm for calculating similarities
between sequences and constructing a phylogenetic guide
tree. We ran CLUSTALW with its default settings.
DIALIGN (v2.2.1) is an anchor-based MSA tool for both DNA
and protein sequences. Different from other alignment tools,
DIALIGN assembles alignments by finding consistent seg-
ments exhibiting statistically significant similarity, and does
not align regions showing no significant similarity. Therefore,
strictly speaking, DIALIGN is a local alignment tool that pro-
duces a full global alignment only for sequences with high
similarity. Recent studies [21,28,79] suggested that DIALIGN
performed well in aligning sequences of low similarity with
long insertions and deletions. DIALIGN was run with default
parameters.
AVID (v2.1) is a pair-wise global alignment tool that is capa-
ble of aligning very large genomics sequences. Its employs an
anchor-based approach and uses a suffix tree algorithm for
identifying potential anchoring regions between sequences.
MAVID (v2.0.4) is a progressive MSA tool and is the direct
extension of AVID. To speed up the alignment process,
MAVID does not directly align two intermediate alignments
or groups; instead, it first infers the common ancestral
sequence of each alignment by maximum likelihood, and then
uses AVID to align two ancestral sequences. We used AVID
for two-species alignments, and MAVID for three or more
species. CLUSTALW at default settings was used as the tree
building tool for MAVID.
LAGAN/MLAGAN (v1.21) is a suite of programs for aligning
DNA sequences. As an anchor-based pair-wise alignment
tool, LAGAN first identifies anchoring regions by chaining
similar neighboring words found in a local alignment process,
and subsequently aligns other regions by the Needleman-
Wunsch algorithm to form a global alignment. MLAGAN is a
progressive multiple sequence alignment tool based on
LAGAN pair-wise alignments. Similar to CLUSTALW in scor-
ing multiple sequence alignments, it uses the sum-of-pairs
approach for scoring substitutions and a consensus-based
method for scoring gaps. Since MLAGAN does not build a
phylogenetic tree, which is a required input, we provided it
with the phylogenetic tree from our simulation. In this study,
LAGAN was used for two-species alignments and MLAGAN
for three or more species. Both tools were run with default
settings.
MUSCLE (v3.6) is a relatively new MSA tool for both DNA
and protein sequences based on an improved progressive
approach. Like CLUSTALW and T-COFFEE, MUSCLE is
based on a progressive approach, and uses the sum-of-pairs
scoring scheme for multiple alignments, but it differs from
other progressive tools by allowing changes of both the phyl-
ogenetic tree and the alignment in intermediate steps in an
iterative refining process. MUSCLE was shown to perform
better than T-COFFEE and POA in aligning benchmark pro-
tein sequences [20,81]. Because MUSCLE is quite slow when
running on default settings, we used its diags option for
anchoring alignment and maxiters option to limit the number
of refinement iterations to two.
Simulation of alignment benchmark data
The benchmark sequence datasets were simulated by the
PSPE system. PSPE sequence simulation can be generally
divided into two separate steps. In the first step, PSPE gener-
ates ancestral promoter sequences with different functional
TFBSs (see Table 6 for the sites we used in this study). With
the exception of YY1E2F, a composite of YY1 and E2F and
chosen on purpose for this study, the TFBS sites used here
were arbitrarily selected among those satisfying three crite-
ria: binding site of a human transcription factor; PWM avail-
able in the JASPAR database; and length between 12 and 25
bp. A motif instance, which is generated randomly from a
PWM, is defined as a functional site if its score is larger than
a certain cutoff value. To avoid degenerate motifs, we used a
relatively stringent cutoff of 0.90 for all TFBSs. PSPE first
generates functional sites and a map of their locations, and
then fills the remaining region in promoters with background
sequences. To generate biologically relevant background
sequences, we estimated parameter values of a 3rd order
Markov chain from a large real sequence data set and used
them to simulate the ancestral background sequences. The
Genome Biology 2007, 8:R225
Genome Biology 2007, Volume 8, Issue 10, Article R225 Huang et al. R225.24
actual sequence data consisted of human promoter sequences
of 24,649 transcripts extracted from the NCBI human RefSeq
database (build 35). Each sequence in the training data
comprises a 5,000 bp region upstream of the putative tran-
scription start site.
In the second step, PSPE simulates descendent sequences
from the simulated ancestral promoter sequences according
to specified evolutionary models and functional constraints
(Table 5). For the evaluation on the mammalian tree of five
species, we scaled the tree, relative to evolutionary distance,
at the following eight levels: 0.25, 0.5, 1, 1.5, 2, 3, 4, and 5,
which we refer to as divergence scale coefficient. At each scale
level, PSPE generated 1,000 sets, each consisting of five
descendent mammalian sequences from their common
ancestral sequence of length 3,000 bp.
Performance measures
We use the expressions 'a tool alignment' to refer to an align-
ment produced by an alignment tool, 'a simulated alignment'
to refer to a correct alignment of homologous base pairs from
the simulation, and 'a simulated TFBS map' to refer to a cor-
rect alignment of TFBSs homologous on the functional level.
Both 'a simulated alignment' and 'a simulated TFBS map'
were generated by the PSPE simulator. The ability of an align-
ment tool to detect functional sites was assessed by TFBS
detection accuracy. Tool performance was also assessed by
four additional measures: overall alignment sensitivity, over-
all alignment specificity, TFBS sensitivity and TFBS
specificity, which are similar to measures in [28]. Definitions
of these measures are given below.
TFBS detection accuracy (DA) is defined as the proportion of
functional sites correctly aligned with respect to a simulated
TFBS map, averaged over all different pairs in a multiple
sequence alignment, and can be calculated by:
where n is the number of sequences in the alignment, n(n-1)/
2 is the number of different sequence pairs, and L is the total
length of functional sites (for a DA of an individual functional
site, L is the length of the site). a
ij
has a value of 1 if the bases
at the j
th
position of functionally homologous binding sites in
a sequence pair i are aligned to each other and 0 otherwise.
Since all our simulated sequences contain the same set of
TFBSs, L is the same for all alignments.
The overall alignment sensitivity is the fraction of correctly
aligned bases not considering gaps, averaged over all differ-
ent pairs in a tool alignment:
where k
i
is the total number of positions for which bases are
aligned to bases in the i
th
pair-wise alignment from a simu-
lated alignment. c
ij
has a value of 1 if the j
th
position was
aligned correctly in any given pair of sequences i in the tool
alignment, and 0 otherwise.
Overall alignment specificity is the fraction of correctly
aligned bases among those that are aligned to gaps in a simu-
lated alignment, averaged over all different pairs in a tool
alignment:
where g
i
is the total number of positions, where bases in one
sequence aligned to gaps in the other sequence in the i
th
pair-
wise alignment of a simulated alignment; c
ij
has a value of 1 if
the j
th
position aligned correctly, and 0 otherwise.
TFBS sensitivity is the fraction of correctly aligned bases,
among those in functional sites of ancestral sequences and
not aligned to a gap in a simulated alignment, averaged over
all different pairs in a tool alignment:
where l
i
is the total number of positions in functional sites of
ancestral sequences, where bases in one sequence aligned to
bases from the other sequence in the i
th
pair-wise alignment
of a simulated alignment; c
ij
has a value of 1 if the j
th
position
aligned correctly, and 0 otherwise. In case of no replacement
turnovers of TFBSs, TFBS sensitivity is equal to TFBS detec-
tion accuracy.
TFBS specificity is the fraction of correctly aligned bases,
among those in functional sites of ancestral sequences and
aligned to gaps in a simulated alignment, averaged over all
different pairs in a tool alignment:
where L is total length of all functional sites in the ancestral
sequence.
In this paper, we mostly use detection accuracy and TFBS
sensitivity. The former refers to the fraction of functional sites
in the 'descendants' aligned to each other, the latter to the
fraction of sites corresponding to the location of the TFBS in
the 'ancestral' sequence that are correctly aligned to each
other.
DA
nn L
a
ij
j
L
=
−
=
∑
=
−
∑
2
1
11
12
()
()/
i
nn
overall sensitivity
nn k
i
c
ij
j
k
i
_
()
()/
=
−
=
−
∑
=
∑
2
1
1
1
12
1i
nn
overall specificity
nn g
i
c
ij
j
g
i
_
()
()/
=
−
=
−
∑
=
∑
2
1
1
1
12
1i
nn
tfbs sensitivity
nn l
i
c
ij
j
l
i
_
()
()/
=
−
=
−
∑
=
∑
2
1
1
1
12
1i
nn
tfbs specificity
nn L l
i
c
ij
j
Ll
i
_
()
()/
=
−−
=
−
∑
=
−
∑
2
1
1
1
12
1i
nn
Genome Biology 2007, Volume 8, Issue 10, Article R225 Huang et al. R225.25
Genome Biology 2007, 8:R225
Abbreviations
GTR, general time reversible; HKY, Hasegawa-Kishino-Yano;
InDel, insertion/deletion; MSA, multiple sequence align-
ment; PSPE, Phylogenetic Simulation of Promoter Evolution;
PWM, position weight matrix; RTR, replacement turnover
rate; TFBS, transcription factor binding site; TSS, transcrip-
tion start site.
Authors' contributions
WH, JN and UO contributed to the conception and design of
this study. WH developed PSPE, performed analyses, and
drafted the initial manuscript. WH and UO provided the
interpretation of results. All authors contributed to writing
and critically revising the manuscript. All authors read and
approved the final manuscript.
Additional data files
The following additional data are available with the online
version of this paper. Additional data file 1 provides addi-
tional results of turnover simulations varying the binding site
strength and GC content of the background sequences, and
information on the E2F promoter data set. Additional data
file 2 provides additional evaluations of alignment algorithms
on sequence sets simulated with a phylogenetic tree with a
star topology.
Additional data file 1Additional results of turnover simulations varying the binding site strength and GC content of the background sequences, and infor-mation on the E2F promoter data setAdditional results of turnover simulations varying the binding site strength and GC content of the background sequences, and infor-mation on the E2F promoter data set.Click here for fileAdditional data file 2Additional evaluations of alignment algorithms on sequence sets simulated with a phylogenetic tree with a star topologyAdditional evaluations of alignment algorithms on sequence sets simulated with a phylogenetic tree with a star topology.Click here for file
Acknowledgements
The authors wish to thank Dr Greg Wray at Duke University for many ben-
eficial discussions. UO is an Alfred P Sloan fellow in Computational and
Evolutionary Molecular Biology and is funded by NIH grant 1-R01-
HG004065. JRN is funded by grants from the NIH, 1-RO1-CA104663-05,
1-RO1-CA106520-03 and 5-U54-CA112952-03. This research was also
supported in part by the National Science Foundation under grant NSF
PHY05-51164 through a program participation of UO at the Kavli Institute
for Theoretical Physics.
References
1. Loots GG, Ovcharenko I, Pachter L, Dubchak I, Rubin EM: rVista for
comparative sequence-based discovery of functional tran-
scription factor binding sites. Genome Res 2002, 12:832-839.
2. Lenhard B, Sandelin A, Mendoza L, Engstrom P, Jareborg N, Wasser-
man WW: Identification of conserved regulatory elements by
comparative genome analysis. J Biol 2003, 2:13.
3. Ludwig MZ: Functional evolution of noncoding DNA. Curr Opin
Genet Dev 2002, 12:634-639.
4. Maduro M, Pilgrim D: Conservation of function and expression
of unc-119 from two Caenorhabditis species despite diver-
gence of non-coding DNA. Gene 1996, 183:77-85.
5. Stone JR, Wray GA: Rapid evolution of cis-regulatory
sequences via local point mutations. Mol Biol Evol 2001,
18:1764-1770.
6. Dermitzakis ET, Clark AG: Evolution of transcription factor
binding sites in Mammalian gene regulatory regions: conser-
vation and turnover. Mol Biol Evol 2002, 19:1114-1121.
7. Ludwig MZ, Bergman C, Patel NH, Kreitman M: Evidence for sta-
bilizing selection in a eukaryotic enhancer element. Nature
2000, 403:564-567.
8. Ludwig MZ, Palsson A, Alekseeva E, Bergman CM, Nathan J, Kreitman
M: Functional evolution of a cis-regulatory module. PLoS Biol
2005, 3:e93.
9. Ludwig MZ, Patel NH, Kreitman M: Functional analysis of eve
stripe 2 enhancer evolution in Drosophila: rules governing
conservation and change. Development 1998, 125:949-958.
10. Frith MC, Ponjavic J, Fredman D, Kai C, Kawai J, Carninci P, Hayash-
izaki Y, Sandelin A: Evolutionary turnover of mammalian tran-
scription start sites. Genome Res 2006, 16:713-722.
11. Carter AJ, Wagner GP: Evolution of functionally conserved
enhancers can be accelerated in large populations: a popula-
tion-genetic model.
Proc Biol Sci 2002, 269:953-960.
12. Gerland U, Hwa T: On the selection and evolution of regula-
tory DNA motifs. J Mol Evol 2002, 55:386-400.
13. Wray GA, Hahn MW, Abouheif E, Balhoff JP, Pizer M, Rockman MV,
Romano LA: The evolution of transcriptional regulation in
eukaryotes. Mol Biol Evol 2003, 20:1377-1419.
14. MacArthur S, Brookfield JFY: Expected rates and modes of evo-
lution of enhancer sequences. Mol Biol Evol 2004, 21:1064-1073.
15. Lee AP, Koh EG, Tay A, Brenner S, Venkatesh B: Highly conserved
syntenic blocks at the vertebrate Hox loci and conserved
regulatory elements within and outside Hox gene clusters.
Proc Natl Acad Sci USA 2006, 103:6994-6999.
16. Santini S, Boore JL, Meyer A: Evolutionary conservation of regu-
latory elements in vertebrate Hox gene clusters. Genome Res
2003, 13:1111-1122.
17. Ruvinsky I, Ruvkun G: Functional tests of enhancer conserva-
tion between distantly related species. Development 2003,
130:5133-5142.
18. Davidson EH: Genomic Regulatory Systems: Development and Evolution
San Diego, CA: Academic Press; 2001.
19. Bray N, Dubchak I, Pachter L: AVID: A global alignment
program. Genome Res 2003, 13:97-102.
20. Edgar RC: MUSCLE: multiple sequence alignment with high
accuracy and high throughput. Nucleic Acids Res 2004,
32:1792-1797.
21. Huang W, Umbach DM, Li L: Accurate anchoring alignment of
divergent sequences. Bioinformatics 2006, 22:29-34.
22. Notredame C, Higgins DG, Heringa J: T-Coffee: A novel method
for fast and accurate multiple sequence alignment. J Mol Biol
2000, 302:205-217.
23. McClure MA, Vasi TK, Fitch WM: Comparative analysis of mul-
tiple protein-sequence alignment methods. Mol Biol Evol 1994,
11:571-592.
24. Sauder JM, Arthur JW, Dunbrack RL Jr: Large-scale comparison of
protein sequence alignment algorithms with structure
alignments. Proteins 2000, 40:6-22.
25. Thompson JD, Plewniak F, Poch O: A comprehensive compari-
son of multiple sequence alignment programs. Nucleic Acids
Res 1999, 27:2682-2690.
26. Lassmann T, Sonnhammer EL: Quality assessment of multiple
alignment programs. FEBS Lett 2002, 529:126-130.
27. Brudno M, Do CB, Cooper GM, Kim MF, Davydov E, Green ED,
Sidow A, Batzoglou S: LAGAN and Multi-LAGAN: efficient
tools for large-scale multiple alignment of genomic DNA.
Genome Res 2003, 13:721-731.
28. Pollard DA, Bergman CM, Stoye J, Celniker SE, Eisen MB: Bench-
marking tools for the alignment of functional noncoding
DNA. BMC Bioinformatics 2004, 5:6.
29. Pollard DA, Moses AM, Iyer VN, Eisen MB: Detecting the limits of
regulatory element conservation and divergence estimation
using pairwise and multiple alignments. BMC Bioinformatics
2006, 7:376.
30. DeGregori J, Leone G, Miron A, Jakoi L, Nevins JR: Distinct roles
for E2F proteins in cell growth control and apoptosis. Proc
Natl Acad Sci USA 1997, 94:7245-7250.
31. Muller H, Bracken AP, Vernell R, Moroni MC, Christians F, Grassilli
E, Prosperini E, Vigo E, Oliner JD, Helin K: E2Fs regulate the
expression of genes involved in differentiation, development,
proliferation, and apoptosis. Genes Dev 2001, 15:267-285.
32. Bernard S, Eilers M: Control of cell proliferation and growth by
Myc proteins. Results Probl Cell Differ 2006, 42:329-342.
33. Amati B, Littlewood TD, Evan GI, Land H: The c-Myc protein
induces cell cycle progression and apoptosis through dimer-
ization with Max. EMBO J 1993, 12:5083-5087.
34. La Thangue NB: Transcription. Chromatin control - a place for
E2F and Myc to meet. Science 2002, 296:1034-1035.
35. Ogawa H, Ishiguro K, Gaubatz S, Livingston DM, Nakatani Y: A com-
plex with chromatin modifiers that occupies E2F- and Myc-
responsive genes in G0 cells. Science 2002, 296:1132-1136.
36. Ditsworth D, Zong WX: NF-kappaB: key mediator of
inflammation-associated cancer. Cancer Biol Ther 2004,