Báo cáo y học: " Simplified ontologies allowing comparison of developmental mammalian gene expression" pot
Bạn đang xem bản rút gọn của tài liệu. Xem và tải ngay bản đầy đủ của tài liệu tại đây (596.05 KB, 12 trang )
Genome Biology 2007, 8:R229
Open Access
2007Krugeret al.Volume 8, Issue 10, Article R229
Method
Simplified ontologies allowing comparison of developmental
mammalian gene expression
Adele Kruger
*
, Oliver Hofmann
*
, Piero Carninci
†‡
, Yoshihide Hayashizaki
†‡
and Winston Hide
*
Addresses:
*
South African National Bioinformatics Institute, University of the Western Cape, Bellville 7535, South Africa.
†
Genome Exploration
Research Group (Genome Network Project Core Group), RIKEN Genomic Sciences Center (GSC), RIKEN Yokohama Institute, 1-7-22 Suehiro-
cho, Tsurumi-ku, Yokohama, Kanagawa, 230-0045, Japan.
‡
Genome Science Laboratory, Discovery Research Institute, RIKEN Wako Institute,
2-1 Hirosawa, Wako, Saitama, 351-0198, Japan.
Correspondence: Adele Kruger. Email:
© 2007 Kruger et al.; licensee BioMed Central Ltd.
This is an open access article distributed under the terms of the Creative Commons Attribution License ( which
permits unrestricted use, distribution, and reproduction in any medium, provided the original work is properly cited.
Simplified human and mouse ontologies<p>The Developmental eVOC ontologies presented are simplified orthogonal ontologies describing the temporal and spatial distribution of developmental human and mouse anatomy.</p>
Abstract
Model organisms represent an important resource for understanding the fundamental aspects of
mammalian biology. Mapping of biological phenomena between model organisms is complex and if
it is to be meaningful, a simplified representation can be a powerful means for comparison. The
Developmental eVOC ontologies presented here are simplified orthogonal ontologies describing
the temporal and spatial distribution of developmental human and mouse anatomy. We
demonstrate the ontologies by identifying genes showing a bias for developmental brain expression
in human and mouse.
Background
Ontologies and gene expression
Biological investigation into mammalian biology employs
standardized methods of data annotation by consortia such as
MGED (Microarray Gene Expression Data Society) and CGAP
(Cancer Genome Anatomy Project) or collaborative groups
such as the Genome Network Project group at the genome
Sciences Centre at RIKEN, Japan [1]. Data generated by these
consortia include microarray, CAGE (capped analysis of gene
expression), SAGE (serial analysis of gene expression) and
MPSS (massively parallel signature sequencing) as well as
cDNA and expressed sequence tag (EST) libraries. The diver-
sity of data types offers opportunity to capture several views
on concurrent biological events, but without standardization
between these platforms and data types, information is lost,
reducing the value of comparison between systems. The ter-
minology used to describe data provides a means for the inte-
gration of different data types such as EST or CAGE.
An ontology is a commonly used method of standardization in
biology. It is often defined as a formal description of entities
and the relationships between them, providing a standard
vocabulary for the description and representation of terms in
a particular domain [2,3]. Given a need and obvious value in
the comparison of gene expression between species, anatom-
ical systems and developmental states, we have set out to dis-
cover the potential and applicability of such an approach to
compare mouse and human systems.
Many anatomical and developmental ontologies have been
created, each focusing on their intended organisms. As many
as 62 ontologies describing biological and medical aspects of
Published: 25 October 2007
Genome Biology 2007, 8:R229 (doi:10.1186/gb-2007-8-10-r229)
Received: 18 January 2007
Revised: 9 February 2007
Accepted: 25 October 2007
The electronic version of this article is the complete one and can be
found online at />Genome Biology 2007, 8:R229
Genome Biology 2007, Volume 8, Issue 10, Article R229 Kruger et al. R229.2
a range of organisms can be obtained from the Open
Biomedical Ontologies (OBO) website [4], a system set up to
provide well-structured controlled vocabularies of different
domains in a single website. The Edinburgh Mouse Atlas
Project (EMAP) [5] and Adult Mouse Anatomy (MA) [6]
ontologies are the most commonly used ontologies to
describe mouse gene expression, representing mouse devel-
opment and adult mouse with 13,730 and 7,702 terms,
respectively. Mouse Genome Informatics (MGI), the most
comprehensive mouse resource available, uses both ontolo-
gies. Human gene expression, however, can be represented as
developmental and adult ontologies by the Edinburgh
Human Developmental Anatomy (HUMAT) ontology [7],
consisting of 8,316 terms, and the mammalian Foundational
Model of Anatomy (FMA) [8], consisting of more than
110,000 terms. Selected terms from the above ontologies
have been used to create a cross-species list of terms known
as SOFG Anatomy Entry List (SAEL) [9]. Although these
ontologies more than adequately describe the anatomical
structures of the developing organism, with the exception of
SAEL, they are structured as directed acyclic graphs (DAGs),
defined as a hierarchy where each term may have more than
one parent term [6]. The DAG structure adds to the inherent
complexity of the ontologies, hampering efforts to align them
between two species, making the process of a comparative
study of gene expression events a challenge.
Efforts are being implemented in order to simplify ontologies
for gene expression annotation. The Gene Ontology (GO)
Consortium's GO slim [10] contains less than 1% of terms in
the GO ontologies. GO slim is intended to provide a broad cat-
egorization of cDNA libraries or microarray data when the
fine-grained resolution of the original GO ontologies are not
required. Another set of simplified ontologies are those from
eVOC [11]. The core eVOC ontologies consist of four orthogo-
nal ontologies with a strict hierarchical structure to describe
human anatomy, histology, development and pathology, cur-
rently consisting of 512, 180, 156 and 191 terms, respectively.
The aim of the eVOC project is to provide a standardized, sim-
plified representation of gene expression, unifying different
types of gene expression data and increasing the power of
gene expression queries. The simplified representation
achieved by the eVOC ontologies is due to the implementation
of multiple orthogonal ontologies with a lower level of granu-
larity than its counterparts.
Mammalian development
The laboratory mouse is being used as a model organism to
study the biology of mammals [12]. The expectation is that
these studies will provide insight into the developmental and
disease biology of humans, colored by the finding that 99% of
mouse genes may have a human ortholog [13], and cDNA
libraries can be prepared from very early mouse developmen-
tal stages for gene expression analysis.
The study of developmental biology incorporates the identifi-
cation of both the temporal and spatial expression patterns of
genes expressed in the embryo and fetus [14]. It is important
to understand developmental gene expression because many
genetic disorders originate during this period [13]. Similari-
ties in behavior and expression profiles between cancer cells
and embryonic stem cells [15] also fuel the need to investigate
developmental biology.
Using mice as model organisms in research requires the need
for comparison of resulting data and provides a means to
compare mouse data to human data [13]. The cross-species
comparison of human and mouse gene expression data can
highlight fundamental differences between the two species,
impacting on areas as diverse as the effectiveness of therapeu-
tic strategies to the elucidation of the components that deter-
mine species.
Cross-species gene expression comparison
Function of most human genes has been inferred from model
organism studies, based on the transitive assumption that
genes sharing sequence similarity also share function when
conserved across species [16]. The same principle can be
applied to gene regulation. The first step is to find not only the
orthologs, but the commonly expressed orthologs. We predict
that although two genes are orthologous between human and
mouse, their expression patterns differ on the temporal and
spatial levels, indicating that their regulation may differ
between the two species.
The terminology currently used to annotate human and
mouse gene expression can be ambiguous [17] among species,
which is a result of different ontologies being used to annotate
different species. Although the EMAP, MA, HUMAT and
FMA ontologies describe the anatomical structures through-
out the development of the mouse and human, their complex-
ities complicate the alignment of the anatomy between the
two species. With the alignment of terms between a mouse
and human ontology, the data mapped to each term become
comparable, allowing efficient and accurate comparison of
mammalian gene expression. A SAEL-related project, XSPAN
[18], is aimed at providing a web tool to enable users to find
equivalent terms between ontologies of different species.
Although useful, the ontologies used describe only spatial
anatomy and are not temporal.
We have attempted to address the issue by developing simpli-
fied ontologies that allow the comparison of gene expression
between human and mouse on a temporal and spatial level.
The distribution of human and mouse anatomy terms across
development match the structure of the human adult ontolo-
gies that form the core of the eVOC system.
Due to the ambiguous annotation of current gene expression
data between human and mouse, and the lack of data map-
pings accompanying the available ontologies, the ontologies
Genome Biology 2007, Volume 8, Issue 10, Article R229 Kruger et al. R229.3
Genome Biology 2007, 8:R229
presented here have been developed in concert with semi-
automatic mapping and curation of 8,852 human and 1,210
mouse cDNA libraries. We have therefore created a resource
of standardized gene expression enabling cross-species com-
parison of gene expression between mammalian species that
is publicly available.
Results and discussion
Ontology development
The ontologies were originally created to accommodate
requests by the FANTOM3 consortium [19] for a simple
mouse ontology that could be used in alignment to the human
eVOC ontologies. The FANTOM3 project was a collaborative
effort by many international laboratories to analyze the
mouse and human transcriptome. The aim was to generate a
transcriptional landscape of the mouse genome that led to the
evolutionary and comparative developmental analysis in
mammals. The ontologies presented here provided the
FANTOM3 consortium with a platform to compare the
human and mouse transcriptome in the context of mamma-
lian development.
Shared structure between the ontologies ensures effective
interoperability on the developmental and species levels. The
importance of shared structure between two ontologies
becomes apparent when attempting to align them for com-
parison. If two terms in an ontology are mapped to each
other, ontology rules infer that the children terms in each of
the ontologies share the same characteristics. For example, if
gene X is mapped to 'heart' in a human ontology and gene Y is
mapped to 'cardiovascular system' in mouse, we can infer that
because 'cardiovascular system' is the parent of 'heart' in both
ontologies, gene X and gene Y have an association with
respect to their expression in the cardiovascular system
although their annotations are not identical. This is especially
important when the granularity of annotation in one species
is different to that of another.
Terms from the EMAP, MA and HUMAT ontologies have
been used to create 28 mouse and 23 human ontologies, rep-
resenting the 28 Theiler stages and 23 Carnegie stages of
mouse and human development, respectively. The 28 Theiler
stages represent mouse embryonic, fetal and adult anatomi-
cal development, whereas the 23 Carnegie stages represent
only human embryonic development. Human adult is repre-
sented by the Anatomical System ontology of the eVOC sys-
tem, upon which the other ontologies are based. The terms
from the source ontologies (EMAP, MA and HUMAT) have
been mapped to the equivalent term in the developmental
eVOC ontologies to ensure interoperability between external
ontologies and eVOC. Terms from the mouse have also been
mapped to those from human to enable cross-species com-
parison of the data mapped.
The integration of the ontologies is described in Figure 1,
where 'Mouse eVOC' refers to the individual mouse ontolo-
gies and 'Human eVOC' refers to the individual human ontol-
ogies (including the adult human ontology). The EMAP and
MA ontologies represent mouse pre- and post-natal develop-
mental anatomical structures, respectively, and, therefore,
exhibit no commonality. The mouse developmental eVOC
ontologies integrate the two ontologies by containing terms
from, and mappings to, both the EMAP and MA ontologies.
Of the 2,840 terms in the individual mouse ontologies, 1,893
and 237 map to EMAP and MA, respectively. The human
developmental eVOC ontology is an untangled version of the
HUMAT ontology and has one-to-one mappings to the mouse
developmental ontology, providing a link between the terms
and data mappings between the mouse and human
ontologies.
The presence of species-specific anatomical structures posed
a challenge when aligning the mouse and human terms. An
obvious example is the presence of a tail in mouse but not in
human. We decided that there would simply be no mapping
between the two terms. Further challenges involved struc-
tures such as paw and hand. The two terms cannot be made
identical because it is incorrect to refer to the anterior
appendage of a mouse as a hand. However, due to the fact that
the mouse paw and human hand share functional similarities,
the two terms are not identical, but are mapped to each other
based on functional equivalence.
In order to provide simplified ontologies, the 28 mouse and
23 human ontologies were merged to create two ontologies -
one for each species. In addition, a Theiler Stage ontology was
created that represents the Theiler stages of mouse develop-
ment. The human stage ontology is represented by the cur-
rent eVOC Development Stage. A cross-product of two terms
(one from the merged and one from the stage ontology) for a
species can, therefore, represent any anatomical structure at
any stage of development.
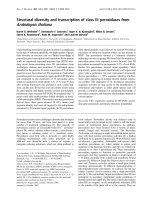
The relationship between the developmental mouse and indi-
vidual ontologies is illustrated in Figure 2, where the term
'brain' is mapped to 12 terms in the individual ontologies and,
therefore, occurs in 12 of the 28 Theiler stages. All terms in
the individual ontologies that are derived from EMAP or MA
for mouse, and HUMAT for human are mapped to the corre-
sponding term by adding the term's accession from the exter-
nal ontology as a database cross-reference in the eVOC
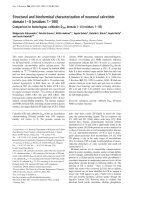
ontologies. Figure 3 shows that the database cross-reference
is the accession of the EMAP term, indicating that 'intestine'
of the 'Theiler Stage 13' ontology is equivalent to the term rep-
resented by 'EMAP:600'. This feature allows cross-communi-
cation, and thereby integration, of the EMAP, MA, HUMAT
and eVOC ontologies.
The ontologies presented here are simplified versions of
existing human and mouse developmental and adult ontolo-
Genome Biology 2007, 8:R229
Genome Biology 2007, Volume 8, Issue 10, Article R229 Kruger et al. R229.4
gies, containing 1,670 and 2,840 terms, respectively. Table 1
shows the number of terms and database cross-references for
the individual mouse and human ontologies. The Theiler
Stage 4 ontology contains 12 terms and has 9 mappings to the
EMAP ontology. The mouse and human stages have been
aligned in the table, showing that mouse Theiler stage 4 is
equivalent to human Carnegie stage 3, based on morphologi-
cal similarities during development [20]. The Carnegie Stage
3 ontology contains 13 terms and has 11 mappings to the
HUMAT ontology. The difference in the number of ontology
terms and external references is attributed to the addition of
terms to maintain the standard structure of the eVOC system.
In this example, the term 'germ layers' is in the eVOC ontolo-
gies, but not in the EMAP or HUMAT ontologies. Many eVOC
terms are mapped to more than one term in the external ref-
erencing ontology as an artifact of the simplification of the
ontologies, resulting in a one-to-many relationship between
eVOC and its reference ontology. For example, 'myocardium'
at Theiler stage 12 in the eVOC ontologies is mapped to five
EMAP identifiers. Each EMAP identifier references a cardiac
muscle, but at a different location. eVOC does not distinguish
between cardiac muscle of the common atrial chamber
(EMAP:337) and cardiac muscle of the rostral half of the bul-
bus cordis (EMAP:330). Compared to their counterparts, the
Developmental eVOC ontologies represent 22% of both the
human HUMAT and mouse EMAP ontologies, with the only
relationship between the terms being 'IS_A'. Note that rela-
tionships within the eVOC ontologies indicate only an associ-
ation between parent and child term and do not
systematically distinguish between is_a or part_of relation-
ships. As eVOC moves to adopt relationship types from the
OBO Relation Ontology [21], relations will be reviewed and
curated. Using a principle of data-driven development, eVOC
terms are added at an annotator's request, resulting in a
dynamic vocabulary describing gene expression.
Data mapping
The resources providing ontologies to annotate gene expres-
sion do not always provide the data themselves. In order to
obtain mouse and human data, one would have to search sep-
arate databases for each species. An example of this would be
searching MGI for mouse gene expression data, and ArrayEx-
press for human. Apart form having to access different data-
bases to obtain data, the terminology used to describe the
data is ambiguous and differs in the level of granularity,
impacting on the accuracy of inter-species data comparison.
The ontology terms have, therefore, been used to annotate
8,852 human and 1,210 mouse cDNA libraries from CGAP
[22].
The mapping process revealed inconsistencies in the annota-
tion of the human and mouse CGAP cDNA libraries, requiring
manual intervention and emphasizing the need for a stand-
ardized annotation. All genes associated with the libraries
have been extracted by association through UniGene. A gene
was considered to be associated with a cDNA library if at least
one EST was evident for the gene in a particular library. The
result is a set of 21,152 human and 24,047 mouse genes from
UniGene that are represented by CGAP cDNA libraries and
annotated with eVOC terms, and represent the set of human
and mouse genes for which there is expression evidence.
CGAP represents an ascertainment bias where there is a
strong over-representation for cancer genes, and, therefore,
future efforts for this research will include obtaining a well-
represented, evenly distributed dataset of human and mouse
gene expression. The list of human and mouse orthologs were
extracted from HomoloGene to represent the 16,324 human-
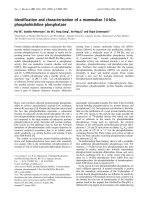
Venn diagram illustrating the integration of mouse and human ontologies represented by the eVOC systemFigure 1
Venn diagram illustrating the integration of mouse and human ontologies
represented by the eVOC system. The total number of terms in each
ontology is in parentheses. The numbers in each set are the number of
terms in the intersection represented by that set. 'Mouse eVOC'
represents the 28 individual mouse ontologies and 'Human eVOC'
represents the 23 individual human and adult ontologies; therefore, the
numbers in parentheses refer to the total number of terms in all the
eVOC ontologies for each species. The intersection of the Mouse eVOC
with the EMAP and MA ontologies represents the number of terms in
Mouse eVOC that have database cross-references to EMAP and MA.
Similarly, the intersection of the Human eVOC and HUMAT sets
represents the number of Human eVOC terms that map to HUMAT
terms. The number within the arrows represents the number of mapped
human and mouse eVOC terms.
1893 237
1379
335
11837 710
MOUSE
eVOC
(2840)
7465
803
6937
MOUSE
EMAP
(13730)
MOUSE
MA
(7702)
HUMAN
HUMAT
(8316)
HUMAN
eVOC
(2182)
Genome Biology 2007, Volume 8, Issue 10, Article R229 Kruger et al. R229.5
Genome Biology 2007, 8:R229
mouse orthologs. Two genes were considered to be orthologs
if they shared the same HomoloGene group identifier.
Data mining
Genes may be categorized according to their eVOC annota-
tion on a spatial or temporal level, or a combination of both.
An example of this would be genes expressed in the heart at
Theiler stage 26 for mouse. For the purposes of this study, we
searched for human-mouse orthologs that are expressed in
the normal postnatal and developmental brain of both spe-
cies, where a gene is classified as normal if its originating
library was annotated as 'normal'. Research involving gene
expression of the brain aims at identifying causes of psycho-
logical and neurological diseases, many of which originate
during development. With the use of mice as model organ-
isms in this kind of research, it is important to identify genes
that are co-expressed in human and mouse on the temporal
and spatial levels. The results of our analysis show that of the
available 16,324 human-mouse orthologs, 14,434 can be
found in CGAP libraries for both human and mouse. When
looking at brain gene expression, we could segregate genes
according to their spatial and temporal expression patterns.
We found that of all the orthologs expressed in the brain,
10,980 genes were expressed in the post-natal brain of both
species whereas 1,692 genes were expressed in the developing
brain of both species. Of these two sets of genes, 90 genes
were found to have biased expression for developmental
brain (Table 2) where developmentally biased genes are those
that are expressed during development and not the post-natal
organism in either human, mouse or both species (see Addi-
tional data file 1 for illustration). The 9,378 genes found to
have a bias for post-natal brain gene expression can be found
in Additional data file 2. It is important to note that only
genes whose orthologs also have expression evidence were
considered for analysis. This small number of genes found to
be biased for expression during brain development in both
species may be a result of data-bias due to the difficulty
involved in accessing developmental libraries. Our future
efforts will include expanding the data platforms to provide
data that are representative of the biology. This analysis does,
however, demonstrate the usefulness of the ontologies in per-
forming cross-species gene expression analyses.
Screenshot of the Mouse Development ontology, visualized in COBrAFigure 2
Screenshot of the Mouse Development ontology, visualized in COBrA. The left panel shows the hierarchy of the ontology, with 'brain' as the highlighted
term. The right panel lists the 12 database cross-references mapped to 'brain', representing the accession of 'brain' in each of the 12 individual ontologies.
Genome Biology 2007, 8:R229
Genome Biology 2007, Volume 8, Issue 10, Article R229 Kruger et al. R229.6
The GO categories that are highly associated with the 90
genes biased for developmental brain expression were
extracted with the use of the DAVID bioinformatics resource
[18]. The human representatives of the human-mouse
orthologs cluster with GO terms such as 'nervous system
development' and 'cell differentiation', suggesting a shared
role for development of the mammalian brain, and, therefore,
may be potential targets for the analysis in neurological dis-
eases. Given the existence of ascertainment bias on these
kinds of data, it was still surprising to see how many genes
passed the stringent selection criteria. Searching the Online
Mendelian Inheritance of Man (OMIM) database implicated
some of the 90 genes, such as GOPC, ARX and DEK, in dis-
eases such as astrocytoma, lissencephaly and leukemia.
To assess the similarity in expression across major human
and mouse tissues other than brain, the expression profiles of
the 90 genes with bias for developmental expression were
determined for developmental and adult expression in the
following tissues: female reproductive system, heart, kidney,
liver, lung, male reproductive system and stem cell. These tis-
sues were chosen based on the availability of data for each tis-
sue in the developmental and adult categories. For each
ortholog-pair, we determined the correlation between their
expression profiles (Additional data file 3). We found that,
according to the cDNA libraries, one mouse gene was found to
be expressed in all the tissues in both post-natal and develop-
ment (Twsg1), and three mouse genes were expressed only in
the mouse brain (Resp18,Gm872,Barhl1) as opposed to all
other tissues (see Additional data file 4 for expression pro-
file). The highest correlation score between an ortholog-pair
is 0.646 (HomoloGene identifier: 27813), having identical
expression profiles during development (expressed in liver
and stem cell), but differing during post-natal expression
(expression in mouse heart, kidney and stem cell but not in
their human counterparts). The correlations observed sug-
gest that the expression profiles of orthologs across these
major tissues are only partially conserved between human
and mouse. This finding strengthens our understanding of
orthologous gene expression in that although two genes are
Screenshot of the individual Theiler Stage 13 ontology, visualized in COBrAFigure 3
Screenshot of the individual Theiler Stage 13 ontology, visualized in COBrA The left panel displays the ontology with terms of anatomical structures
occurring only in Theiler stage 13 of mouse development. The right panel lists the accession of the equivalent term in the external ontology as a database
cross-reference.
Genome Biology 2007, Volume 8, Issue 10, Article R229 Kruger et al. R229.7
Genome Biology 2007, 8:R229
orthologs, they do not share temporal and spatial expression
patterns and, therefore, probably do not share a majority of
their regulatory modules [23].
Developmental gene expression may be subdivided into
embryonic and fetal expression, which in turn may be catego-
rized further according to the Theiler and Carnegie stages for
mouse and human, allowing a high-resolution investigation
of gene expression profiles between the two species. This
stage by-stage expression profile for human and mouse will
allow investigation into common regulatory elements of co-
developmentally expressed genes and give new insight into
the characterization of the normal mammalian developmen-
tal program.
Conclusion
The developmental mouse ontologies were developed in col-
laboration with the FANTOM3 consortium to have the same
structure and format as the existing human eVOC ontologies
Table 1
Statistics of the individual developmental eVOC ontologies, representing the alignment between human and mouse stages
Theiler stage Mouse terms External reference Carnegie stage Human terms External reference
1 64154
2 53254
364
4 129 31311
596
6 107 4108
7119
8 12105a10 8
5b 11 10
5c 9 8
9 14146a1416
6b 19 18
10 14 18 7 20 17
11 32 29 8 22 19
12 56 63 9 52 54
13 55 64 10 60 80
14 67 85 11 72 92
15 80 109 12 80 98
16 93 128 13 103 131
17 103 137 14 122 149
18 116 155 15 131 165
19 134 173 16 155 178
20 157 171 17 170 184
21 193 239 18 188 223
19 199 237
22 209 299 20 200 237
23 216 303
24 226 316
25 234 339
26 238 348
27 266 0
28 266 246 Adult 512
Total 2,840 3,288 2,049 1,951
The first three columns display the individual mouse ontologies, the number of terms in each ontology, and the number of external references of
each. The last three columns display the individual human ontologies, the number of terms, and the number of external references of each. The
external references refer to the EMAP and MA ontologies for mouse, and to HUMAT for human. The alignment of the rows between the mouse and
human ontologies represents the alignment of the Theiler and Carnegie stages of development based on morphological similarities. For example, the
Theiler Stage 4 ontology contains 12 terms and has 9 mappings to the EMAP ontology. Mouse Theiler Stage 4 is equivalent to human Carnegie Stage
3. The Carnegie Stage 3 ontology contains 13 terms and has 11 mappings to terms from the HUMAT ontology.
Genome Biology 2007, 8:R229
Genome Biology 2007, Volume 8, Issue 10, Article R229 Kruger et al. R229.8
Table 2
Genes showing developmental expression bias in human and mouse brain
HomoloGene group
identifier
Human Entrez Gene ID Human Entrez Gene
symbol
Mouse Entrez Gene ID Mouse Entrez Gene
Symbol
32 435 ASL 109900 Asl
268 5805 PTS 19286 Pts
413 353 APRT 11821 Aprt
1028 1606 DGKA 13139 Dgka
1290 9275 BCL7B 12054 Bcl7b
1330 857 CAV1 12389 Cav1
1368 1054 CEBPG 12611 Cebpg
1871 4760 NEUROD1 18012 Neurod1
1933 5050 PAFAH1B3 18476 Pafah1b3
2212 6182 MRPL12 56282 Mrpl12
2593 7913 DEK 110052 Dek
2880 8835 SOCS2 216233 Socs2
3476 9197 SLC33A1 11416 Slc33a1
4397 8971 H1FX 243529 H1fx
4983 10991 SLC38A3 76257 Slc38a3
6535 11062 DUS4L 71916 Dus4l
7199 11054 OGFR 72075 Ogfr
7291 10683 DLL3 13389 Dll3
7500 5806 PTX3 19288 Ptx3
7516 389075 RESP18 19711 Resp18
7667 1154 CISH 12700 Cish
7717 24147 FJX1 14221 Fjx1
7922 6150 MRPL23 19935 Mrpl23
9120 25851 DKFZP434B0335 70381 2210010N04Rik
9355 51637 C14orf166 68045 2700060E02Rik
9813 55627 FLJ20297 77626 4122402O22Rik
10026 55172 C14orf104 109065 1110034A24Rik
10494 58516 FAM60A 56306 Tera
10518 84273 C4orf14 56412 2610024G14Rik
10663 57171 DOLPP1 57170 Dolpp1
10695 57120 GOPC 94221 Gopc
10774 57045 TWSG1 65960 Twsg1
11653 79730 FLJ14001 70918 4921525L17Rik
11920 84303 CHCHD6 66098 Chchd6
11980 84262 MGC10911 66506 1810042K04Rik
12021 84557 MAP1LC3A 66734 Map1lc3a
12418 124056 NOXO1 71893 Noxo1
12444 84902 FLJ14640 72140 2610507L03Rik
12993 84217 ZMYND12 332934 Zmynd12
14128 91107 TRIM47 217333 Trim47
14157 90416 CCDC32 269336 Ccdc32
14180 115294 PCMTD1 319263 Pcmtd1
14667 113510 HEL308 191578 Hel308
15843 79591 C10orf76 71617 9130011E15Rik
16890 399664 RKHD1 237400 Rkhd1
17078 387914 TMEM46 219134 Tmem46
17523 115290 FBXO17 50760 Fbxo17
Genome Biology 2007, Volume 8, Issue 10, Article R229 Kruger et al. R229.9
Genome Biology 2007, 8:R229
to enable the comparison of developmental expression data
between human and mouse. The developmental ontologies
have been constructed by integrating EMAP, MA, the devel-
opmental Human Anatomy and the human adult eVOC ontol-
ogies. The re-organization of existing ontological systems
under a uniform format allows the consistent integration and
querying of expression data from both human and mouse
databases, creating a cross-species query platform with one-
18123 140730 RIMS4 241770 Rims4
18833 143678 LOC143678 75641 1700029I15Rik
18903 440193 KIAA1509 68339 0610010D24Rik
19028 146167 LOC146167 234788 Gm587
20549 4324 MMP15 17388 Mmp15
21334 10912 GADD45G 23882 Gadd45g
22818 29850 TRPM5 56843 Trpm5
24848 266629 SEC14L3 380683 RP23-81P12.8
26702 93109 TMEM44 224090 Tmem44
27813 84865 FLJ14397 243510 A230058J24Rik
31656 27000 ZRF1 22791 Dnajc2
32293 51018 CGI-115 67223 2810430M08Rik
32331 51776 ZAK 65964 B230120H23Rik
32546 64410 KLHL25 207952 Klhl25
32633 136647 C7orf11 66308 2810021B07Rik
35002 93082 LINCR 214854 Lincr
37917 1293 COL6A3 12835 Col6a3
40668 9646 SH2BP1 22083 Sh2bp1
40859 27166 PX19 66494 2610524G07Rik
41703 118881 COMTD1 69156 Comtd1
45198 65117 FLJ11021 208606 1500011J06Rik
45867 139189 DGKK 331374 Dgkk
46116 401399 LOC401399 101359 D330027H18Rik
49899 143282 C10orf13 72514 2610306H15Rik
49970 83879 CDCA7 66953 Cdca7
55434 1289 COL5A1 12831 Col5a1
55599 669 BPGM 12183 Bpgm
55918 6882 TAF11 68776 Taf11
56005 6328 SCN3A 20269 Scn3a
56571 26503 SLC17A5 235504 Slc17a5
56774 54751 FBLIM1 74202 Fblim1
64353 126374 WTIP 101543 Wtip
65280 286128 ZFP41 22701 Zfp41
65318 23361 ZNF629 320683 Zfp629
65328 7559 ZNF12 231866 Zfp12
68420 9559 VPS26A 30930 Vps26
68934 57016 AKR1B10 14187 Akr1b8
68973 1663 DDX11 320209 Ddx11
68998 170302 ARX 11878 Arx
78698 387876 LOC387876 380653 Gm872
81871 56751 BARHL1 54422 Barhl1
82250 150678 MYEOV2 66915 Myeov2
84799 22835 ZFP30 22693 Zfp30
The table lists the HomoloGene group identifier, Entrez Gene identifier and gene symbol of the 90 human-mouse orthologs found to have an
expression bias towards the embryonic and fetal stages of brain development, without expression during postnatal development. Genes were
considered for analysis only if they have an ortholog, and if the ortholog also has expression evidence based on eVOC annotation.
Table 2 (Continued)
Genes showing developmental expression bias in human and mouse brain
Genome Biology 2007, 8:R229
Genome Biology 2007, Volume 8, Issue 10, Article R229 Kruger et al. R229.10
to-one mappings between terms within the human and
mouse ontologies.
The ontologies have been used to map human and mouse
gene expression events, and can be used to identify differen-
tial gene expression profiles between the two species. In
future, the ontologies presented here will be used to investi-
gate the transcriptional regulation of genes according to their
characteristics based on developmental stage, tissue and
pathological expression profiles, providing insight into the
mechanisms involved in the differential regulation of genes
across mammalian development.
Materials and methods
Ontology development
The ontologies were constructed using the COBrA [24] and
DAG-edit [25] ontology editors. Each term has a unique
accession identifier with 'EVM' as the namespace for mouse
and 'EV' for human, followed by seven numbers. This is con-
sistent with the rules defined by the GO consortium [26].
Using the human adult eVOC anatomical system ontology as
a template, terms from the Theiler stage 26 (mouse develop-
mental stage immediately prior to birth) section of the EMAP
ontology were inserted to create the Theiler Stage 26
developmental eVOC mouse ontology. Proceeding from
Theiler stage 26 to Theiler stage 1, each stage was used as a
template for the next stage and any term not occurring at that
specific stage, using EMAP as reference, was removed. Simi-
larly, if a term occurred in EMAP that was not present in the
previous stage, it was added to the ontology. The result is a set
of 26 ontologies, one for each Theiler stage of mouse develop-
ment, with many terms appearing and disappearing through-
out the ontologies according to changes of anatomy during
mouse development.
The Theiler Stage 28 (adult mouse) ontology was constructed
in the same way as the developmental ontologies, using the
MA ontology as a reference. A previously unavailable Theiler
Stage 27 ontology was developed by comparing Theiler stage
26 and Theiler stage 28. Any terms that differed between the
two stages were manually curated and included or removed in
Theiler stage 27 as needed. The Theiler Stage 27 ontology
therefore represents all immature, post-natal anatomical
structures. Theiler Stage 28 ontology terms have been
mapped to the adult human eVOC terms by using the human
eVOC accession identifiers as database cross-references in
the mouse ontology. Similarly, the EMAP accession number
for each term was mapped to the developmental mouse ontol-
ogies. The result is a set of 28 ontologies that are an untangled
form of the EMAP and MA ontologies, with mappings
between them.
A set of human developmental ontologies were created by
using the same method as was used for mouse. The reference
ontologies for human development were the HUMAT ontolo-
gies, which describe the first 23 Carnegie stages of develop-
ment, classified according to morphological characteristics.
The 28 mouse and 23 human ontologies were merged into
two ontologies - one for mouse and one for human. Each
merged ontology (named Mouse Development and Human
Development) contains all terms present in the individual
ontologies. A Theiler Stage ontology was created for mouse,
which contains all 28 Theiler stages categorized into embryo,
fetus or adult. The existing eVOC Development Stage ontol-
ogy serves as the human equivalent of the mouse Theiler
Stage ontology. The Mouse Development, Human Develop-
ment, Theiler Stage and the existing Development Stage
ontologies form the core of the Developmental eVOC
ontologies.
Data mapping
Mouse and human cDNA libraries were obtained from the
publicly available CGAP resource and mapped (semi-auto-
mated) to the entire set of eVOC ontologies. The eVOC ontol-
ogies consist of Anatomical system, Cell type, Developmental
stage, Pathology, Associated with, Treatment, Tissue prepa-
ration, Experimental technique, Pooling and Microarray plat-
form. The 'age' annotation of the mouse CGAP libraries was
manually checked against the Gene Expression Database
(version 3.41) [27] to determine the Theiler stage of each
library. Due to the lack of a resource providing the Carnegie
stage annotation for cDNA libraries, the human cDNA librar-
ies were annotated according to the age annotation originally
provided by CGAP. Genes associated with each mouse and
human cDNA library were obtained from NCBI's UniGene
[28]. A list of human-mouse orthologs were obtained from
HomoloGene (build 53) [29].
Data mining
The genes were filtered according to the presence or absence
of expression evidence and homology. A gene passed the
selection criteria if it has an ortholog and if both genes in the
ortholog pair have eVOC-annotated expression. According to
eVOC annotation, genes were categorized into those that
showed expression in normal adult brain and those expressed
in normal developmental brain, many genes appearing in
more than one category. Genes expressed in normal adult
brain were subtracted from those with expression in normal
developmental brain to establish genes whose expression in
the brain occurs only during development. The expression
profiles of the developmentally biased genes annotated to
female reproductive system, heart, kidney, liver, lung, male
reproductive system and stem cell for post-natal and develop-
mental expression were determined according to the eVOC
annotation of the cDNA libraries, and the correlation coeffi-
cient of the ortholog-pairs were calculated.
Genome Biology 2007, Volume 8, Issue 10, Article R229 Kruger et al. R229.11
Genome Biology 2007, 8:R229
Availability
The mouse eVOC ontologies, their mappings and the datasets
referred to in this manuscript are available under a FreeBSD-
style license at the eVOC website [30].
Abbreviations
CAGE, capped analysis of gene expression; CGAP, Cancer
Genome Anatomy Project; DAG, directed acyclic graph;
EMAP, Edinburgh Mouse Atlas Project; EST, expressed
sequence tag; FMA, Foundational Model Of Anatomy; GO,
Gene Ontology; HUMAT, Edinburgh Human Developmental
Anatomy; MA, Adult Mouse Anatomy; MGI, Mouse Genome
Informatics; OBO, Open Biomedical Ontologies; SAEL, SOFG
Anatomy Entry List.
Authors' contributions
AK was responsible for ontology development and integra-
tion, data mapping, data mining and drafting the manuscript.
OH helped with ontology development and integration
between the human and mouse ontologies. PC and YH drove
development requirements for the study. WH was responsi-
ble for study design and revised the manuscript. All authors
read and approved the final manuscript.
Additional data files
The following additional data are available with the online
version of this paper. Additional data file 1 is a diagram illus-
trating the sets of genes analyzed for developmental brain
expression bias. Additional data file 2 is a table listing genes
not showing developmental expression bias in human and
mouse brain. Additional data file 3 is a table listing the corre-
lation coefficients of the 90 genes showing bias for develop-
mental expression in the human and mouse brain. Additional
data file 4 shows the expression profiles of the 90 genes show-
ing bias for developmental expression across major human
and mouse tissues in the form of a binary pseudoarray.
Additional data file 1Sets of genes analyzed for developmental brain expression biasGenes for human and mouse grouped together if they are expressed in post-natal or developmental brain, respectively. The intersection between the human and mouse developmental brain genes repre-sent those genes showing common expression in the two species. Subtracting genes commonly expressed in human and mouse post-natal brain determines those genes that show developmental restriction in either human, mouse or both species.Click here for fileAdditional data file 2Genes not showing developmental expression bias in human and mouse brainThe table lists the Entrez Gene identifier and gene symbol of the 9,378 human-mouse orthologs found not to have an expression bias towards the embryonic and fetal stages of brain development. Genes were considered for analysis only if they have an ortholog, and if the ortholog also has expression evidence based on eVOC annotation.Click here for fileAdditional data file 3Correlation coefficients of the 90 genes showing bias for develop-mental expression in the human and mouse brainThe table lists the HomoloGene group identifier, Human Entrez Gene identifier, Human Entrez gene symbol, Mouse Entrez Gene identifier, Mouse Entrez gene symbol and the correlation coeffi-cient between the expression profiles of the genes in each species.Click here for fileAdditional data file 4Expression profiles of the 90 genes showing bias for developmental expression across major human and mouse tissues in the form of a binary pseudoarrayThe tissues represented are female reproductive system, heart, kid-ney, liver, lung, male reproductive system and stem cell for both post-natal and developmental expression. The table lists the HomoloGene group identifier, Entrez Gene identifier and Entrez gene symbol for human and mouse, as well as the species each row represents. Values in the table are 1 if the genes (in rows) are expressed in the given tissues (in columns) and 0 if the genes are not found to be expressed in the tissues.Click here for file
Acknowledgements
This work was supported by research grants from the Alternate Transcript
Diversity consortium (EC grant 503329), National Bioinformatics Network
of South Africa (grant no. NBN/RP2/2005 and NBN/RP2/2006), the
Research Grant for the RIKEN Genome Exploration Research Project from
the Ministry of Education, Culture, Sports, Science and Technology of the
Japanese Government to YH, the Research Grant for the Genome Net-
work Project from the Ministry of Education, Culture, Sports, Science and
Technology of the Japanese Government and the Research grant for the
Strategic Programs for R&D of RIKEN. AK is funded by a training grant
under the Stanford-South Africa Biomedical Informatics Training Program,
which is supported by the Fogarty International Center, part of the
National Institutes of Health (grant no. 5 D43 TW006993). The authors
wish to thank Duncan Davidson for helpful discussions regarding ontology
development.
References
1. RIKEN Genomic Sciences Centre [ />indexE.html]
2. Gkoutos GV, Green EC, Mallon AM, Hancock JM, Davidson D: Using
ontologies to describe mouse phenotypes. Genome Biol 2005,
6:R8.
3. Bard J, Winter R: Ontologies of developmental anatomy: their
current and future roles. Brief Bioinform 2001, 2:289-299.
4. The Open Biomedical Ontologies [ />5. Baldock RA, Bard JB, Burger A, Burton N, Christiansen J, Feng G, Hill
B, Houghton D, Kaufman M, Rao J, et al.: EMAP and EMAGE: a
framework for understanding spatially organized data. Neu-
roinformatics 2003, 1:309-325.
6. Hayamizu TF, Mangan M, Corradi JP, Kadin JA, Ringwald M: The
Adult Mouse Anatomical Dictionary: a tool for annotating
and integrating data. Genome Biol 2005, 6:R29.
7. Hunter A, Kaufman MH, McKay A, Baldock R, Simmen MW, Bard JB:
An ontology of human developmental anatomy. J Anat 2003,
203:347-355.
8. Rosse C, Mejino JLJ: A reference ontology for biomedical infor-
matics: the Foundational Model of Anatomy. J Biomed Inform
2003, 36:478-500.
9. Parkinson H, Aitken S, Baldock RA, Bard JBL, Burger A, Hayamizu TF,
Rector A, Ringwald M, Rogers J, Rosse C, et al.: The SOFG anat-
omy entry list (SAEL): an annotation tool for functional
genomics data. Comparative Functional Genomics 2004, 5:521-527.
10. Martin D, Brun C, Remy E, Mouren P, Thieffry D, Jacq B: GOTool-
Box: functional analysis of gene datasets based on Gene
Ontology. Genome Biol 2004, 5:R101.
11. Kelso J, Visagie J, Theiler G, Christoffels A, Bardien S, Smedley D,
Otgaar D, Greyling G, Jongeneel CV, McCarthy MI, et al.: eVOC: a
controlled vocabulary for unifying gene expression data.
Genome Res 2003, 13:1222-1230.
12. Marra M, Hillier L, Kucaba T, Allen M, Barstead R, Beck C, Blistain A,
Bonaldo M, Bowers Y, Bowles L,
et al.: An encyclopedia of mouse
genes. Nat Genet 1999, 21:191-194.
13. Lindsay S, Copp AJ: MRC-Wellcome Trust Human Develop-
mental Biology Resource: enabling studies of human devel-
opmental gene expression. Trends Genet 2005, 21:586-590.
14. Magdaleno S, Jensen P, Brumwell CL, Seal A, Lehman K, Asbury A,
Cheung T, Cornelius T, Batten DM, Eden C, et al.: BGEM: an in situ
hybridization database of gene expression in the embryonic
and adult mouse nervous system. PLoS Biol 2006, 4:e86.
15. Kho AT, Zhao Q, Cai Z, Butte AJ, Kim JY, Pomeroy SL, Rowitch DH,
Kohane IS: Conserved mechanisms across development and
tumorigenesis revealed by a mouse development perspec-
tive of human cancers. Genes Dev 2004, 18:629-640.
16. Zhou XJ, Gibson G: Cross-species comparison of genome-wide
expression patterns. Genome Biol 2004, 5:232.
17. Eilbeck K, Lewis SE, Mungall CJ, Yandell M, Stein L, Durbin R, Ash-
burner M: The Sequence Ontology: a tool for the unification
of genome annotations. Genome Biol 2005, 6:R44.
18. Dennis GJ, Sherman BT, Hosack DA, Yang J, Gao W, Lane HC, Lem-
picki RA: DAVID: Database for Annotation, Visualization, and
Integrated Discovery. Genome Biol 2003, 4:P3.
19. Carninci P, Kasukawa T, Katayama S, Gough J, Frith MC, Maeda N,
Oyama R, Ravasi T, Lenhard B, Wells C, et al.: The transcriptional
landscape of the mammalian genome. Science 2005,
309:1559-1563.
20. EHDA: Human Versus Mouse Development Stage Compar-
ison [ />Comp.html]
21. Smith B, Ceusters W, Klagges B, Kohler J, Kumar A, Lomax J, Mungall
C, Neuhaus F, Rector AL, Rosse C: Relations in biomedical
ontologies. Genome Biol 2005, 6:R46.
22. The Cancer Genome Anatomy Project [ />]
23. Odom DT, Dowell RD, Jacobsen ES, Gordon W, Danford TW,
Macisaac KD, Rolfe PA, Conboy CM, Gifford DK, Fraenkel E: Tissue-
specific transcriptional regulation has diverged significantly
between human and mouse. Nat Genet 2007, 39:730-732.
24. Aitken S, Korf R, Webber B, Bard J: COBrA: a bio-ontology
editor. Bioinformatics 2005, 21:825-826.
25. DAG-edit [ />26. Ashburner M, Ball CA, Blake JA, Botstein D, Butler H, Cherry JM,
Davis AP, Dolinski K, Dwight SS, Eppig JT, et al.: Gene ontology:
tool for the unification of biology. The Gene Ontology
Consortium. Nat Genet 2000, 25:25-29.
27. Hill DP, Begley DA, Finger JH, Hayamizu TF, McCright IJ, Smith CM,
Beal JS, Corbani LE, Blake JA, Eppig JT, et al.: The mouse Gene
Genome Biology 2007, 8:R229
Genome Biology 2007, Volume 8, Issue 10, Article R229 Kruger et al. R229.12
Expression Database (GXD): updates and enhancements.
Nucleic Acids Res 2004, 32:D568-571.
28. NCBI UniGene [ />query.fcgi?db=unigene]
29. NCBI HomoloGene [ />query.fcgi?db=homologene]
30. eVOC ontology []