Báo cáo y học: "Canada. §Research Unit on Biomedical Informatics of IMIM/UPF" doc
Bạn đang xem bản rút gọn của tài liệu. Xem và tải ngay bản đầy đủ của tài liệu tại đây (400.03 KB, 14 trang )
Genome Biology 2007, 8:R230
Open Access
2007Marques-Bonetet al.Volume 8, Issue 10, Article R230
Research
On the association between chromosomal rearrangements and
genic evolution in humans and chimpanzees
Tomàs Marques-Bonet
*
, Jesús Sànchez-Ruiz
*
, Lluís Armengol
†#
,
Razi Khaja
‡
, Jaume Bertranpetit
*#
, Núria Lopez-Bigas
§
, Mariano Rocchi
¶
,
Elodie Gazave
*
and Arcadi Navarro
*¥#**
Addresses:
*
Unitat de Biologia Evolutiva Departament de Ciències Experimentals i de la Salut, Departament de Ciències Experimentals i de la
Salut. Universitat Pompeu Fabra. Parc de Recerca Biomèdica de Barcelona. Dr. Aiguader 88. 08003 Barcelona. Catalonia, Spain.
†
Genes and
Disease Program, Center for Genomic Regulation,. Parc de Recerca Biomèdica de Barcelona. Dr. Aiguader 88, 1. 08003 Barcelona. Catalonia,
Spain.
‡
The Center for Applied Genomics. The Hospital for Sick Children. MaRS Centre - East Tower. 101 College Street, Room 14-706. Toronto,
Ontario. Canada.
§
Research Unit on Biomedical Informatics of IMIM/UPF. Parc de Recerca Biomèdica de Barcelona. Dr. Aiguader 88. 08003
Barcelona. Catalonia, Spain.
¶
Dipartimento di Genetica e Microbiologia. Universita di Bari, Bari, Italy.
¥
Institucio Catalana de Recerca i Estudis
Avancats (ICREA) and Unitat de Biologia Evolutiva, Departament de Ciències Experimentals i de la Salut, Universitat Pompeu Fabra. Parc de
Recerca Biomèdica de Barcelona. Plaça Dr. Aiguader 88. 08003 Barcelona. Catalonia, Spain.
#
CIBER Epidemiología y Salud Pública
(CIBERESP), Spain.
**
Population Genomics Node (GNV8) National Institute for Bioinformatics (INB), Spain.
Correspondence: Arcadi Navarro. Email:
© 2007 Marques-Bonet et al; licensee BioMed Central Ltd.
This is an open access article distributed under the terms of the Creative Commons Attribution License ( which
permits unrestricted use, distribution, and reproduction in any medium, provided the original work is properly cited.
Chromosomal rearrangements in human and chimpanzee<p>Analysis of the genes located in rearranged human and chimpanzee chromosomes identified lower divergence than for those in colinear chromosomes.</p>
Abstract
Background: The role that chromosomal rearrangements might have played in the speciation
processes that have separated the lineages of humans and chimpanzees has recently come into the
spotlight. To date, however, results are contradictory. Here we revisit this issue by making use of
the available human and chimpanzee genome sequence to study the relationship between
chromosomal rearrangements and rates of DNA sequence evolution.
Results: Contrary to previous findings for this pair of species, we show that genes located in the
rearranged chromosomes that differentiate the genomes of humans and chimpanzees, especially
genes within rearrangements themselves, present lower divergence than genes elsewhere in the
genome. Still, there are considerable differences between individual chromosomes. Chromosome
4, in particular, presents higher divergence in genes located within its rearrangement.
Conclusion: A first conclusion of our analysis is that divergence is lower for genes located in
rearranged chromosomes than for those in colinear chromosomes. We also report that non-
coding regions within rearranged regions tend to have lower divergence than non-coding regions
outside them. These results suggest an association between chromosomal rearrangements and
lower non-coding divergence that has not been reported before, even if some chromosomes do
not follow this trend and could be potentially associated with a speciation episode. In summary,
without excluding it, our results suggest that chromosomal speciation has not been common along
the human and chimpanzee lineage.
Published: 30 October 2007
Genome Biology 2007, 8:R230 (doi:10.1186/gb-2007-8-10-r230)
Received: 12 August 2006
Revised: 12 October 2007
Accepted: 30 October 2007
The electronic version of this article is the complete one and can be
found online at />Genome Biology 2007, 8:R230
Genome Biology 2007, Volume 8, Issue 10, Article R230 Marques-Bonet et al. R230.2
Background
Genomic DNA sequences of humans and chimpanzees differ
by only 1.23% if considering only point mutations [1,2], a fig-
ure that grows up to 5% if small insertions and deletions are
taken into account [3] and up to a yet unknown percentage
when segmental duplications are added to the picture [2,4,5]
Besides such relatively small-scale changes in their DNA
sequences, the two species differ by large-scale rearrange-
ments in their karyotypes. Human chromosome 2 results
from the fusion of two acrocentric chromosomes that are
independent in the great apes [6]. In addition, there are at
least 7 major (larger than 10 Mb) pericentric inversions (in
human chromosomes 4, 5, 9, 12, 15, 17 and 18) that range in
size between 16 and 77 Mb and many smaller ones. Break-
point regions of most of these rearrangements have been well
defined both in silico [2,7] and experimentally [6,8-16],
although the exact location of some of them is still unclear.
Over the past three years, the role that these chromosomal
rearrangements might have played in the speciation proc-
esses that have separated the lineages of humans and chim-
panzees has come into the spotlight. According to models of
chromosomal speciation based on the recombination-reduc-
ing effects of rearrangements, genome rearrangements
enhance the speciation process by limiting gene flow between
the inverted chromosomes [17-20]. Under some models, such
limited gene flow may preclude introgression upon secondary
contact or facilitate the fixation of genes presenting geo-
graphically divergent selection [20-22]; under other models,
lower gene flow may allow incompatibility genes to accumu-
late on different genetic backgrounds [21,23]. Under any of
these models, rearranged genomic regions involved in speci-
ation become isolated earlier compared to the rest of the
genome. For pairs of species that have diverged in recent
times by means of chromosomal speciation, these models
predict an association between speciation-related rearrange-
ments and higher rates of sequence divergence [20,21,23,24].
Under models based on the accumulation of incompatibili-
ties, protein evolution rates may also be higher since amino
acid changes are more likely to take part in incompatibilities
and will thus present lower gene flow than synonymous
changes [23]. Current evidence for or against such models is
contradictory. The first studies, including our own, that made
use of human and chimpanzee DNA sequence data seemed to
support the existence of an association of chromosomal rear-
rangements with higher rates of protein and DNA sequence
evolution [19,25,26]. However, these studies were seriously
affected by problems such as small sample size and biases in
the data that were available in the GenBank at the time [27].
More recent studies, using larger datasets, have detected
opposite trends [28] or no association at all [26-28]. Also, a
study based on human-chimpanzee gene expression diver-
gence suggested that some inversions (in particular those in
chromosomes 4, 5, 9, 15 and/or 16) could have been involved
in the original speciation event separating the human and
chimpanzee lineages [29]. Finally, an increasing amount of
data coming from other species seems to fit the chromosomal
speciation model. This is the case, at the moment, of studies
involving such different lineages as Drosophila, Anopheles,
murids, shrew or sunflowers [17,20,30-35]. So far the ques-
tion thus remains unsolved: has chromosomal speciation
taken place along the human and chimpanzee lineages?
This question is even more important if one considers the cur-
rent uncertainty about how the split of humans and chimpan-
zees came about. The traditional view of allopatric speciation
at the two sides of the Rift Valley has recently been challenged
by several studies suggesting parapatric speciation [36] or a
complex speciation process involving secondary contact [37].
Still, neither of these works has fully convinced the commu-
nity [18] and it is clear that more evidence is needed. Tests of
the predictions of chromosomal speciation between humans
and chimpanzees may help to build the case for or against
chromosomal speciation. If higher rates of sequence diver-
gence are found in genes included in or close to rearrange-
ments, this can be taken as indirect evidence for
chromosomal speciation and trigger further research on these
genomic regions. If, in contrast, these increased rates are not
found, then there is no positive evidence for the hypothesis of
chromosomal speciation to be sustained, even if it cannot be
totally excluded.
Here we perform one such test. We revisit the issue of chro-
mosomal speciation between humans and chimpanzees by
making use of the recently available chimpanzee genome
sequence [2]. Our aims are, first, to exhaustively compare
rates of pairwise human-chimpanzee sequence divergence in
rearranged and in colinear genomic regions and, second, to
study lineage-specific divergence rates in these same regions.
To do so, we made use of the sets of measures of divergence
between orthologous genes in humans, chimpanzees, rats and
mice (including information for coding and non-coding
sequences) gathered by the Chimpanzee Genome Consortium
[2].
Results
A simple analysis of the full set of genes in autosomes showed
a pattern that was exactly opposite to our expectations. Genes
in rearranged chromosomes presented lower non-coding
divergence (KI), synonymous substitution rates (KS) and
non-synonymous divergence rates (KA) than genes in colin-
ear chromosomes. The ratio KA/KI was also lower in genes
located in rearranged chromosomes. Similarly, genes located
within evolutionary inversions in rearranged chromosomes
showed lower divergence, although with lower statistical sup-
port (Table 1). Multiple causes might be underlying these
results, so we endeavored to control for the several factors -
such as sex chromosomes or segmental duplications - that are
known to affect rates of DNA sequence evolution according to
their genomic location. As shown below, these factors were
Genome Biology 2007, Volume 8, Issue 10, Article R230 Marques-Bonet et al. R230.3
Genome Biology 2007, 8:R230
studied one by one and sequentially removed from further
analysis.
Filtering of factors affecting divergence
First, we considered sex chromosomes in detail. It has long
been known that, due to the particular evolutionary dynamics
of sex chromosomes [38-41], sequences linked to the X chro-
mosome have lower divergence rates than those linked to
autosomes [31,40,42]. These results are confirmed by our
analysis of human-chimpanzee pairwise divergence. Genes
located in the X chromosomes presented lower synonymous
substitution rates (K
S
) and lower non-coding divergence (K
I
)
than those in autosomes, whereas non-synonymous diver-
gence rates (K
A
) did not differ (Table 2). Lineage-specific sub-
stitution rates (obtained from the second dataset; see
Materials and methods) showed the same trends, although
significance was lost is some comparisons (Table A1 in Addi-
tional data file 1). As usually done in previous studies
[2,27,29,31], we removed genes linked to sex chromosomes
from further analysis.
Next we dealt with segmental duplications (SDs), since they
are known to be associated with higher rates of molecular
evolution [31,43,44]. In the pairwise dataset, divergence rates
in the non-coding regions of genes involved in SDs (either in
the chimpanzee or in the human lineage) are not different
from divergence rates of single-copy genes. This is also the
case for K
A
and the K
A
/K
I
ratio (Table 2). Surprisingly, how-
ever, K
S
is significantly lower in genes within SDs. To explore
this discrepancy with the previous literature referenced
above, we split genes overlapping SDs in three main catego-
ries: those genes that overlap SDs shared by the human and
the chimpanzee lineages; genes that overlap human SDs but
not chimpanzee SDs; and genes that overlap chimpanzee SDs
but not human SDs (Table 3). As expected, genes overlapping
human SDs showed higher divergence than genes that do not
Table 1
Unfiltered dataset: comparison of evolutionary rates for genes in autosomes
Genes in rearranged versus colinear chromosomes Genes in rearranged chromosomes: within versus outside
inversions
Colinear Rearranged P value Outside Inside P value
N 5,873 5,818 4,710 1,108
K
I
0.0128 0.0126 < 0.001 0.0128 0.0126 < 0.001
K
A
0.0033 0.003 < 0.001 0.0031 0.0028 0.048
K
S
0.0149 0.014 0.001 0.0146 0.0118 < 0.001
K
A
/K
I
0.2535 0.2383 0.007 0.2393 0.2342 0.605
Evolutionary rates are compared for genes in colinear versus rearranged chromosomes between human and chimpanzee, and for genes in
rearranged chromosomes but inside versus outside the major cytological evolutionary rearrangements between these two species. P values were
calculated by means of permutation tests (1,000 random permutations).
Table 2
Analysis of factors known to affect evolutionary rates
HSA X versus
autosomes
Segmental duplications Telomeres versus rest
of genome
Centromeres versus rest of
genome
HSA19
Genes in
autosomes
Genes in
HSA X
Genes
outside
SDs
Genes
within SDs
Genes
outside
telomeres
Genes
within
telomeres
Genes
outside
centromeres
Genes within
centromeres
Genes
outside
HSA19
Genes
within
HSA19
N 11,691 434 8,431 3,260 6,627 1,804 6,165 462 5,804 361
K
I
0.0127 0.0094 0.0127 0.0127 0.0121 0.0149 0.0121 0.0118 0.0121 0.0132
< 0.001 0.982 < 0.001 < 0.001 < 0.001
K
A
0.0032 0.0029 0.0031 0.0033 0.0029 0.0040 0.0029 0.0030 0.0029 0.0032
0.129 0.048 < 0.001 0.687 0.114
K
S
0.0145 0.0088 0.0147 0.0138 0.0129 0.0213 0.0130 0.0118 0.0127 0.0176
< 0.001 0.002 < 0.001 0.039 < 0.001
K
A
/K
I
0.2459 0.2987 0.2434 0.2525 0.2370 0.2669 0.2364 0.2453 0.2360 0.2422
0.002 0.161 < 0.001 0.537 0.671
Average divergence measures are compared between genes within and outside genomic regions previously shown to be affected by processes
influencing divergence rates. See text for details.
Genome Biology 2007, 8:R230
Genome Biology 2007, Volume 8, Issue 10, Article R230 Marques-Bonet et al. R230.4
overlap with SDs. On the other hand, genes overlapping
chimpanzee SDs present the opposite pattern, that is, evolu-
tionary rates are significantly lower for coding evolutionary
rates. Finally, for those genes that overlap SDs and are shared
by the human and chimpanzee lineages, only synonymous
divergence is lower within shared SDs. This suggests that the
lower rates of divergence for genes overlapping SDs that were
detected in the overall analysis may be an artifact of the pre-
liminary state of the annotation of chimpanzee SDs. At any
rate, we excluded from further analysis any gene overlapping
SDs.
The chimpanzee genome project unveiled higher human-
chimpanzee divergence within 10 Mb of the telomeres [2].
This effect can be detected in both the pairwise and the line-
age-specific datasets (Table 2) and for both exonic and non-
coding divergence. This is a particularly important factor,
since nine out of the ten major rearrangements separating the
two species are pericentric inversions, that is, they exclude
telomeres. Thus, considering genes in telomeres might lead to
under-estimation of divergence within rearrangements. To
avoid such bias, genes within 10 Mb of the telomeres were
removed from further analysis.
Recent evidence suggests that, just as telomeres do, centro-
meric and centromeric transition regions exhibit unique
organizational and evolutionary characteristics [45-47]. In
our pairwise dataset, genes located within 5 Mb of pericentro-
meric regions at each side of centromeres showed signifi-
cantly lower divergence rates than genes elsewhere in the
genome (Table 2). In contrast, there are no significant line-
age-specific differences in substitution rates between genes
located in centromeric regions and genes in other parts of the
genome (Table A1 in Additional data file 1). Given these inter-
esting but potentially confusing patterns, genes in centro-
meric regions were removed from our dataset.
Finally, human chromosome 19 (HSA19) has been reported to
present peculiar divergence and nucleotide composition pat-
terns [48]. Our results also pinpoint this chromosome as an
outlier. All neutral divergence measures in the pairwise data-
set are markedly higher in HSA19 (Table 2). Differences in
lineage-specific substitution rates are not as striking. Still,
significant differences for K
S
in the human and chimpanzee
lineages and for K
A
in the hominid lineage can be found
(Table A1in Additional data file 1). Thus, genes located in this
chromosome were also removed from our dataset.
The successive removal of all the genes whose divergence val-
ues could be affected by any of the aforementioned confound-
ing factors left 5,804 genes for pairwise analysis (dataset 1)
and 2,742 in the lineage-specific analysis (dataset 2). Such fil-
tered datasets, even if dramatically reducing our sample size,
allow for a detailed testing of the hypothesis of an association
between chromosomal rearrangements and genic divergence
rates. A graphic overview of the regions that were included in
the following analysis or excluded from it is presented in Fig-
ure 1.
Major rearrangements
As a rough preliminary test, we repeated the comparison
between rearranged and collinear chromosomes in this fil-
tered dataset. Human-chimpanzee pairwise divergence rates
are not different for synonymous sites (K
S
) or for the K
A
/K
I
ratio (Table 4). In contrast to these results and to all previous
literature, average rates of non-coding, K
I
, and non-synony-
mous divergence, K
A
, are significantly lower in rearranged
chromosomes (Table 4). That is, the original trends detected
in the unfiltered dataset remain, albeit with weaker statistical
support. None of the comparisons performed upon lineage-
specific rates are strikingly different. Only non-synonymous
divergence for humans and neutral divergence in the hominid
branches present marginal differences, being lower in rear-
ranged chromosomes.
We then focused on rearranged chromosomes themselves
and compared genes within inversions against genes outside
them. In the pairwise dataset, non-coding sequences showed
significantly lower divergence within rearrangements than
outside them (0.0120 versus 0.0117, P value < 0.001) whereas
Table 3
Comparison of genes overlapping segmental duplications
Genes overlapping shared SDs Genes overlapping human specific SDs Genes overlapping chimp specific SDs
Genes
outside SDs
Genes
within SDs
P value Genes
outside SDs
Genes
within SDs
P value Genes
outside SDs
Genes
within SDs
P value
N 5,804 330 5,804 720 5,804 1,364
K
I
0.0121 0.0121 0.574 0.0121 0.0122 0.032 0.0121 0.0121 0.127
K
A
0.0029 0.0030 0.502 0.0029 0.0040 < 0.001 0.0029 0.0025 0.001
K
S
0.0127 0.0110 0.009 0.0127 0.0138 0.016 0.0127 0.0118 0.005
K
A
/K
I
0.2360 0.2425 0.713 0.2360 0.3126 < 0.001 0.2360 0.2068 0.002
Genes in sex chromosomes, in telomeres, centromeres and chromosome 19 were removed before this analysis to avoid known confounding factors.
Genome Biology 2007, Volume 8, Issue 10, Article R230 Marques-Bonet et al. R230.5
Genome Biology 2007, 8:R230
no significant divergence differences were detected for K
A
, K
S
and the K
A
/K
I
ratio (Table 4). No general pattern was detected
in the lineage-specific analysis, even if genes within rear-
rangements show marginally lower rates in some cases (K
A
in
human branch, K
S
in the chimpanzee branch and both K
A
and
K
S
in the hominid lineage; Table A2 in Additional data file 1).
This suggests that the association between rearranged chro-
mosomes and lower divergence rates reported above is
mainly due to genes within the rearrangements themselves.
However, when the analysis is repeated removing genes
within rearrangements, divergence is still lower in genes
located in rearranged chromosomes (but outside rearrange-
ments; Table 4).
These results cannot be biased by the strict filtering applied
before our main analysis. Equivalent, although stronger,
trends were obtained before filtering when all genes were
included in the analysis (data not shown). It is interesting,
however, to consider the relative contributions of the various
factors under study upon the divergence patterns between the
two species. To do so, we used K
I
, since it is based on much
larger amounts of data and, thus, it is less noisy than the other
measures (K
I
is computed for a 250 kb window centered in
each gene; see Materials and methods for details). A simple
regression analysis allows us to see that, altogether, the loca-
tion of genes in sex chromosomes, telomeres, centromeres,
SDs, HSA19 or within rearrangements explains only about
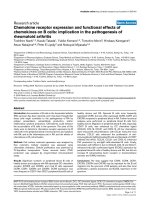
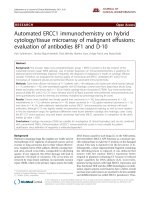
Abstract overview of the chromosomal regions that were included and excluded from our analysisFigure 1
Abstract overview of the chromosomal regions that were included and excluded from our analysis. A colinear and an inverted chromosome are
presented. The inversion in the rearranged chromosome is highlighted in red. For every chromosome, regions considered in this paper are labeled in
black. Regions excluded from the main analysis (telomeres, centromeres and breakpoints (BKP)) are within boxes and labeled in red.
Rearranged chromosome Colinear chromosome
Outside rearranged region
Inside rearranged region
Inside rearranged region
Outside rearranged region
Colinear region
Colinear region
Telomere
Telomere
Centromere
BKP
BKP
Genome Biology 2007, 8:R230
Genome Biology 2007, Volume 8, Issue 10, Article R230 Marques-Bonet et al. R230.6
37% of the variance in K
I
(R
2
= 0.372). This shows that, as
expected, other smaller-scale factors, including the individual
history of each gene, have a considerable influence on nucleo-
tide divergence patterns. All the studied factors present
highly significant regression coefficients (P values < 0.001)
with the exception of centromeres, whose effect is non-signif-
icant under our linear regression model. Among the remain-
ing factors, telomeres, HSA19 and sex chromosomes show the
largest standardized regression coefficients (β = 0.488, -
0.274 and 0.143, respectively; with approximately 27% of the
variance explained by telomeres alone), while the fact of a
gene being within rearrangements or segmental duplications
has much smaller power to predict divergence values
(β = -0.054 and 0.036, respectively).
Rearrangement breakpoints
If rearrangements did affect divergence rates due to their
recombination-reducing effect (including effects due to speci-
ation-related processes), their effect should be maximum
around the rearrangement breakpoints, where recombina-
tion between different chromosomal arrangements is most
strongly reduced [49]. To test for this possibility, we defined
windows of 2 Mb around each rearrangement breakpoint (1
Mb at each side). Then, we compared genes within these win-
dows against all genes in rearranged chromosomes (Table 5).
In the pairwise analysis, we detected lower divergence in non-
coding regions surrounding the evolutionary breakpoints.
Exons also show lower K
S
and K
A
values near breakpoints
when compared to the rest of the chromosome, although nei-
ther of these results are statistically significant (Table 5).
None of these differences can be detected in lineage-specific
substitution rates (Table A3 in Additional data file 1).
It would thus seem that evolutionary rates of genes close to
breakpoints follow the same trend as genes within rearrange-
ments. To check whether these two trends are independent,
we removed genes surrounding breakpoints and repeated the
main analysis comparing divergence within and outside rear-
rangements. Results did not change: in the pairwise analysis,
genes within rearrangements displayed lower non-coding
divergence than the rest of the rearranged chromosomes
(Table 6), even if reduced sample size limits our power and
some results are not significant anymore (Table A4 in Addi-
tional data file 1).
Finally, the accumulation of genes with K
A
/K
S
> 1 in colinear
chromosomes reported by Zhang et al. [28] can also be
detected in our pairwise dataset, although K
A
/K
I
is used
instead of the 'standard' K
A
/K
S
ratio. When focusing on rear-
ranged chromosomes alone, no significant accumulation of
genes with K
A
/K
I
> 1 was found either within or outside rear-
rangements (Table A9 in Additional data file 1).
Table 4
Analysis of genes according to their position in relation to rearrangements
Genes in rearranged versus colinear
chromosomes
Genes within versus outside inversions
(excluding HSA2, PTR12, PTR13)
Genes outside inversions versus genes in
colinear chromosomes
(excluding HSA2, PTR12, PTR13)
Colinear Rearranged P value Outside Inside P value Colinear Outside P value
N 2,677 3,127 2,072 610 2,677 2,072
K
I
0.0122 0.0120 0.001 0.0120 0.0117 < 0.001 0.0122 0.0120 0.027
K
A
0.0030 0.0028 0.036 0.0027 0.0028 0.648 0.0030 0.0027 0.014
K
S
0.0131 0.0125 0.122 0.0127 0.0119 0.119 0.0131 0.0127 0.518
K
A
/K
I
0.2442 0.2290 0.080 0.2255 0.2346 0.504 0.2442 0.2255 0.038
Comparison of genes in regions involved in rearrangements versus genes in colinear chromosomes or regions. Genes in breakpoints are included.
Table 5
Comparison of genes in breakpoints versus genes in other rearranged chromosomes or regions
Genes in breakpoints versus inverted chromosomes (excluding HSA2, PTR12, PTR13)
Rearranged BKP P value
N2,61072
K
I
0.0120 0.0113 0.001
K
A
0.0028 0.0023 0.260
K
S
0.0126 0.0117 0.427
K
A
/K
I
0.2283 0.2001 0.406
BKP, breakpoint.
Genome Biology 2007, Volume 8, Issue 10, Article R230 Marques-Bonet et al. R230.7
Genome Biology 2007, 8:R230
Simulated rearrangements
As explained above, genes located near the centromere had
lower divergence than genes elsewhere in the genome (Table
2). This suggests that a possible explanation for our
observation of lower divergence within rearrangements could
be related to the fact that all the rearrangements analyzed are
pericentric inversions. It is thus possible that removing genes
in the centromeres and within a 5 Mb pericentromeric region
on each side, as we did, is not enough to control for any poten-
tial centromere-related effects.
To test this hypothesis, we defined virtual pericentric inver-
sions in colinear chromosomes, spanning the same average
proportion of each chromosome as the real nine major inver-
sions do in rearranged chromosomes. We compared genes
within these virtual regions with genes outside them but in
the same chromosomes. Table 7 shows that divergence pat-
terns in these virtual rearrangements are similar to those in
real rearranged chromosomes. In the pairwise comparison,
non-coding divergence is also lower within virtual inversions
(Table 7) and, again, no pattern can be detected in the line-
age-specific analysis (Table A5 in Additional data file 1). This
suggests that centromere-related effects extending beyond
the 5 Mb windows we considered may be responsible for
some, even if not all, of our observations.
Smaller rearrangements
All the above results refer to the ten major rearrangements
separating humans and chimpanzees. More detailed informa-
tion on the structural changes between the two species has
recently become available by means of mapping chimpanzee
fosmid paired-end sequences against the human genome
[50]. This analysis unveiled 37 smaller rearrangements (usu-
ally < 1 Mb) which, in contrast to the major ones, do not
include centromeric regions and, thus, allow the exclusion of
any potential bias caused by centromeres. We compared sub-
stitution rates of genes overlapping these rearrangements
with genes in colinear regions. Pairwise non-coding substitu-
tion rates were found to be marginally higher within these
rearrangements (K
I
= 0.0121 versus 0.0128, P value = 0.020;
Table 8) whereas other divergence measures do not present
significant differences. This observation can not be retrieved
in the lineage-specific analysis but, in any case, the sample
size for this kind of approach is really small and should be
treated with caution (Table A6 in Additional data file 1).
Chromosome by chromosome analysis
So far, all the tests presented here were performed by pooling
all rearranged chromosomes together. It is clear, however,
that no chromosomal speciation model proposes that every
single rearrangement ought to have played a relevant role in
the speciation processes that separated humans and
chimpanzees. In fact, it is reasonable to assume that most
Table 6
Comparison of genes in regions involved in rearrangements versus genes outside inversions
Genes within versus outside inversions (excluding breakpoints and HSA2, PTR12, PTR13)
Outside Inside P value
N 2,070 540
K
I
0.0120 0.0118 0.001
K
A
0.0027 0.0029 0.301
K
S
0.0127 0.0119 0.144
K
A
/K
I
0.2251 0.2406 0.316
Genes in breakpoints are excluded.
Table 7
Comparison of genes with pericentric inversions simulated in colinear chromosomes versus genes outside them
Genes in simulated pericentric inversions in colinear chromosomes (without HSA2 and without centromere)
Outside Inside P value
N 2,237 440
K
I
0.0122 0.0119 0.009
K
A
0.0030 0.0029 0.562
K
S
0.0129 0.0133 0.551
K
A
/K
I
0.2448 0.2410 0.810
Genome Biology 2007, 8:R230
Genome Biology 2007, Volume 8, Issue 10, Article R230 Marques-Bonet et al. R230.8
rearrangements would have appeared and become fixed
along the evolutionary history of lineages (anagenesis) and
not during the relatively shorter cladogenic periods [25,26]. It
is thus possible that a majority of speciation-unrelated rear-
rangements could be masking the molecular signature of
chromosomal speciation in the few rearrangements involved
in such processes. Provided, of course, that there are any
speciation-related rearrangements at all. In fact, a recent
comparative gene-expression study hints at some chromo-
somes (such as HSA4, HSA5, HSA9, HSA15 and HSA16) as
the most different in terms of differences in expression pat-
tern [29].
Thus, we repeated all previous analyses on a chromosome-
per-chromosome basis (Table 9; Table A7 in Additional data
file 1). In most cases, the small sample size caused by our
extremely conservative filtering process precludes the detec-
tion of any trend or even the performance of tests (for exam-
ple, no genes from chromosomes HSA15, HSA16 or HSA 18
are included in our dataset after filtering). For the rest of the
chromosomes, the trends reported after filtering were similar
to those obtained with the unfiltered dataset (not shown) but,
of course, lower divergence in genes within pericentric rear-
rangements is to be expected if, for example, the highly diver-
gent telomeres are not filtered-out.
HSA 4 clearly stands out in the pairwise comparison. It
presents statistically higher K
A
, K
I
and K
A
/K
I
within the inver-
sion (having removed the breakpoints). The centromeric
region of HSA4 presents the usual lower divergence, thus
confirming that the effect of HSA4 was not due to any special
properties of its centromere extending beyond 5 Mb. In con-
trast to other chromosomes, genes outside the inversion in
HSA4 also present higher divergence than genes in colinear
chromosomes.
The other chromosome that stands out in the analysis is
HSA12, which presents lower divergence, both for genes
within its inversion relative to those outside it and for genes
outside the inversion relative to genes in colinear chromo-
somes (data not shown). HSA15 presents the same trend,
although with less statistical strength. Together, these two
chromosomes are the major contributors to the observation
of lower divergence for genes outside rearrangements than
for genes in colinear chromosomes.
Recombination rates
Recombination rates have been shown to correlate positively
with divergence [51]. We first examined the relationship
between recombination and the factors we have excluded
from our analysis. All figures are given in cM·Mb
-1
. In our
dataset, recombination rates are higher for genes located in
the X chromosome than for genes elsewhere in the genome
(1.43 versus 1.21, P value 0.027). This is also the case for genes
in telomeric regions (1.09 versus 1.97, P value < 0.001) and in
HSA19 (1.08 versus 1.57, P value < 0.001). All these results
are congruent with previous observations [52]. Recombina-
tion rates are also lower for genes located in SDs (1.28 versus
1.04, P value < 0.001) and centromeric regions (1.10 versus
0.82, P value = 0.002).
We then focused on chromosomal rearrangements. Recombi-
nation rates for both classes of chromosomes (colinear and
rearranged) are very similar (1.06 versus 1.09, P value not sig-
nificant). Within rearranged chromosomes, recombination
rates are significantly higher within inversions than in
regions outside the inversion, but marginally so (1.07 versus
1.24, P value = 0.07). Also, regions surrounding breakpoints
show higher levels of recombination than the rest of their
chromosome (1.91 versus 1.08, P value = 0.002).
GO categories
To see whether rearrangements were enriched in genes with
functions leading to reproductive isolation, we performed an
analysis of Gene Ontology (GO) [53] terms. In our dataset,
several GO categories are overrepresented in rearranged
regions (Table A10 in Additional data file 1). Some of the func-
tions, such as cytokine activity, G-protein-coupled receptor
binding or immune response have been previously pin-
pointed as enriched in genes presenting positive selection
along the human lineage [2,54-56]. Interestingly, genes
related to 'behavior' are also found more often within the
inverted regions than expected by chance. Finally, in the spe-
cific inversion of HSA4, only the category of response to biotic
stimulus is overrepresented.
Table 8
Comparison of genes overlapping those inversion located in silico in Newman et al. [50]
Genes overlapping microinversions versus genes in rest of chromosomes
Outside Inside P value
N5,77826
K
I
0.0121 0.0128 0.020
K
A
0.0029 0.0026 0.744
K
S
0.0127 0.0090 0.079
K
A
/K
I
0.2362 0.2079 0.625
Genome Biology 2007, Volume 8, Issue 10, Article R230 Marques-Bonet et al. R230.9
Genome Biology 2007, 8:R230
Table 9
Comparison of evolutionary rates of genes within inversions in individual chromosomes versus genes outside inversions
Genes within versus outside inversion (no BKP 1Mb)
Outside Inside P value
HSA1
N7746
K
I
0.0117 0.0111 0.207
K
A
0.0029 0.0032 0.833
K
S
0.0134 0.0050 0.049
K
A
/K
I
0.2387 0.2754 0.769
HSA4
N18366
K
I
0.0125 0.0130 0.015
K
A
0.0030 0.0047 0.002
K
S
0.0122 0.0120 0.896
K
A
/K
I
0.2353 0.3468 0.017
HSA5
N217105
K
I
0.0120 0.0120 0.950
K
A
0.0026 0.0029 0.503
K
S
0.0113 0.0097 0.078
K
A
/K
I
0.2154 0.2420 0.477
HSA9
N19717
K
I
0.0123 0.0117 0.117
K
A
0.0027 0.0024 0.667
K
S
0.0127 0.0135 0.750
K
A
/K
I
0.2221 0.2016 0.777
HSA12
N161170
K
I
0.0118 0.0115 0.013
K
A
0.0023 0.0022 0.787
K
S
0.0119 0.0105 0.181
K
A
/K
I
0.1946 0.1907 0.891
HSA15
N195
K
I
0.0122
K
A
0.0024
K
S
0.0109
K
A
/K
I
0.1932
HSA16
N219
K
I
0.0120
K
A
0.0029
K
S
0.0158
Genome Biology 2007, 8:R230
Genome Biology 2007, Volume 8, Issue 10, Article R230 Marques-Bonet et al. R230.10
Discussion
In the present whole-genome analysis, several puzzling pat-
terns have been detected that were not reported by previous
publications. In particular, Mikkelsen et al. [2] performed a
full-fledged descriptive analysis of the new sequence of the
chimpanzee genome and, among other analyses, they tested
for an increase in the rates of protein evolution of genes in
rearranged chromosomes relative to genes on colinear chro-
mosomes and of genes within the rearrangements themselves
relative to genes outside them. We extended our analysis not
only to the ratio of evolutionary rates, but also to individual
synonymous and non-synonymous evolutionary rates. More-
over, we carefully screened rearranged and colinear regions
together with their breakpoints.
A first conclusion of our analysis is that, overall, divergence is
lower for genes located in rearranged chromosomes than for
those in colinear chromosomes. The effect is of the same
order as that of SDs. This result - consistently obtained both
before and after applying any filters to our data - contradicts
all previous observations. First, it contradicts the original
analysis by one of us, which, based on small datasets,
reported a trend for increased divergence in rearranged chro-
mosomes [19,25,26]. And, second, it is also contrary to the
results of Zhang et al. [28] and Vallender et al. [27], who
found no significant association between rearrangements and
average genic evolutionary rates using large datasets.
Another pattern emerging from our results is that, when
focusing on rearranged chromosomes, non-coding regions
within rearranged regions tend to have lower divergence than
non-coding regions outside them. Again, this result suggests
a relationship between chromosomal rearrangements and
lower non-coding divergence that has not been reported
before. Moreover, this overall trend is against the general pre-
dictions of the models of suppressed-recombination chromo-
somal speciation and, thus, this suggests that the lineages of
humans and chimpanzees have not frequently speciated by
such a mechanism.
Clusters of genes under strong functional constraints located
non-randomly within rearrangements might produce similar
effects to those reported here. However, the finding that this
association is stronger in non-coding regions than in coding
regions would rule out this explanation, as coding sequences
are, on average, under stronger functional constraints than
non-coding regions.
But why should non-synonymous and non-coding divergence
be lower in rearranged chromosomes, particularly within
rearrangements? It is tempting to speculate that rearrange-
ments tend to occur in regions with particular sequence fea-
tures, such as lower recombination and, thus, lower ancestral
polymorphism that would translate into lower divergence.
Also, it is possible that changes in recombination rates
induced by rearrangements could be affecting mutation rates.
However, we lack the ancestral recombination data that
would be needed to properly test these hypotheses. Extant
evidence is not only scarce, but contradictory. For example, in
humans there are no differences in rates of recombination
between rearranged and colinear chromosomes (Table A2 in
Additional data file 1), but, of course, one would not expect
fixed inversions to affect current recombination rates. Evi-
dence weakly hinting at lower ancestral polymorphism comes
from current polymorphism levels in humans. Using
intraspecific population data from the 256 genes in Seat-
tleSNP [57], we found that nucleotide divergence is lower in
rearranged chromosomes than in colinear chromosomes
(8.13 × 10
-4
versus 9.34 × 10
-4
, P value = 0.021), but there
K
A
/K
I
0.2395
HSA17
N40174
K
I
0.0126 0.0114 < 0.001
K
A
0.0023 0.0030 0.248
K
S
0.0130 0.0148 0.537
K
A
/K
I
0.1899 0.2533 0.221
HSA18
N72
K
I
0.0131
K
A
0.0033
K
S
0.0105
K
A
/K
I
0.2476
Genes in breakpoints (BKP) are excluded.
Table 9 (Continued)
Comparison of evolutionary rates of genes within inversions in individual chromosomes versus genes outside inversions
Genome Biology 2007, Volume 8, Issue 10, Article R230 Marques-Bonet et al. R230.11
Genome Biology 2007, 8:R230
were no differences between genes outside the rearrange-
ments versus genes inside them (7.45 × 10
-4
versus 8.26 × 10
-
4
, P value = 0.42). Still, the last analysis must be taken with
care, since the number of genes within inversions was as low
as 20.
Another potential explanation comes from the effect of cen-
tromeres. The major rearrangements analyzed in this paper
are all pericentromeric. Even when removing genes in centro-
meres and within 5 Mb of pericentromeric regions, we can
still see lower divergence within rearrangements. This is not
the case for small inversions, which do present slightly higher
non-coding divergence. Taken together, these data suggest
that centromeres have a divergence-reducing effect that
extends beyond 5 Mb and helps to explain our global observa-
tion. However, divergence rates are still lower for genes in
rearranged chromosomes after removing genes within rear-
rangements, a result for which, at the moment, we lack an
explanation. At any rate, these observations should be inter-
preted carefully, as they are based on the comparison of only
two genomes. As noted by Navarro and Barton [19] and Val-
lender et al. [27], the genome-wide non-uniform distribution
of genes and rates of divergence could be at the origin of our
observation. Additional analyses involving more species and
making use of outgroup sequences are needed to clarify this
point.
As to the evolutionary rates of specific lineages, it is not sur-
prising to find almost no significant differences. The murid
lineage can not be defined as a 'close' brother lineage to the
human-chimpanzee speciation, and, thus, is giving us an
unbalanced tree with long inner and short terminal branches.
As a consequence, we lack power in the interesting terminal
branches (that is, the chimpanzee and human branches).
More appropriate species for this sort of comparison will be
available shortly, making it possible to increase the power of
this analysis by adding density to the primate tree.
Another interesting observation is related to the relationship
between recombination rates and rearrangements. We report
higher recombination rates in regions surrounding evolution-
ary breakpoints. It is widely admitted that recombination is
greatly reduced around rearrangement breakpoints of heter-
okaryotypic individuals [49] and this may seem to contradict
our results. However, it is quite clear that measures of recom-
bination reported here correspond to present, and not to
ancestral, recombination rates. Because recombination rates
change dramatically over time [58] we can not infer any rele-
vant conclusion about this relationship. It is, however, tempt-
ing to speculate that rearrangements may tend to take place
in regions of high recombination. New primate recombina-
tion data from chimpanzees and other primate species (such
as Bornean and Sumatran orangutans, especially since a
chromosomal inversion differentiates these two subspecies
[59]) will help to shed some light on this issue.
Our final observation is that certain chromosomes seem to
present some strong individual trends. Blurry results are to be
expected in this analysis, since our statistical power was
greatly reduced by the conservative approach we choose (out-
right removal of certain factors) and, thus, any putative chro-
mosome-per-chromosome patterns are likely to be
overshadowed by the great variation of rates of divergence
across the genome. Analysis of unfiltered data produces the
same patterns, of course, but most of the effect is due to tel-
omeres. Still, in a general context of lower divergence within
rearrangements, chromosome 4 presents significantly higher
divergence rates for genes inside its inversion. This result is
consistent with previous analysis of gene expression and
sequence data [2,29].
An important issue is the relevance of our observations to the
problem of the mode of speciation between humans and
chimpanzees and along their respective lineages. Our results
show that there is very little positive evidence for recurrent
chromosomal speciation along the human or chimpanzee lin-
eages. The prediction of higher DNA sequence divergence
that suppressed-recombination models of chromosomal spe-
ciation make is not fulfilled by most rearrangements. How-
ever, chromosomal speciation can not be fully ruled out for
several reasons. First, a chromosomal speciation episode
involving HSA4 is possible, since this rearrangement harbors
highly divergent genes with interesting GO functions, such as
response to stimulus produced by other living organisms
(biotic stimulus), which could well be related to adaptation.
Second, chromosomal speciation might have taken place, but
it might have been too quick or too ancient to be detected with
extant sequence data. And third, speciation might have
involved other functional elements besides the single-copy
protein-coding genes that have been the object of all analyses
published so far. These elements could be genes that do not
code for proteins (microRNAs, for example); other regulatory
elements (such as transcription factor binding sites) or even
protein-coding genes included in SDs, which we and other
authors have always filtered-out.
In the near future, it will become possible to perform detailed
tests upon individual chromosomes, or rearrangements, by
means of a proper set of outgroups. Also, the increasing
amount of genomic information will allow us to include other
functional elements in the tests. In the meantime, however,
the issue of the mode of speciation between humans and
chimpanzees will remain just as elusive as revealed by the
recent works trying to look for signals of parapatric or allopat-
ric speciation between the two species [18,36,37,60]. More
experimental and theoretical knowledge needs to be gathered
before the debate can be satisfactorily settled.
Conclusion
Based on the observations we report here, chromosomal spe-
ciation does not appear to have been common along the
Genome Biology 2007, 8:R230
Genome Biology 2007, Volume 8, Issue 10, Article R230 Marques-Bonet et al. R230.12
human and chimpanzee lineages, although chromosome 4
clearly stands out as the best candidate to have played a role
in some particular speciation process. In the future, the
detailed study of the interaction of chromosomal rearrange-
ments with some of the factors we removed in the present
study, particularly with SDs, will certainly shed light on the
issue of the genomic distribution of rates of genic evolution.
Materials and methods
Sequence gathering and evolutionary rates
All data analyzed were retrieved from the initial chimpanzee
genome sequence [2] and the methods therein should be con-
sulted. In summary, two databases were used. First, a set of
more than 13,000 unambiguous human-chimpanzee ortholo-
gous genes filtered to avoid overrepresentation of gene fami-
lies. From that initial dataset, only those genes with
unequivocal coordinates in both species were kept. The chro-
mosomal position of the sequences is a key parameter of our
analysis, and, thus, genes in random chromosomes were also
removed from our analysis, leaving a total of 12,135 genes.
For every coding sequence, several conventional indexes of
molecular evolution, such as the number of non-synonymous
substitutions per non-synonymous site (K
A
), the number syn-
onymous substitutions per silent site (K
S
), and their ratio
(K
A
/K
S
) were estimated using the maximum likelihood
method implemented in the package PAML [61]. Substitution
rates for non-coding sequence were calculated as K
I
, the
number of substitutions per non-coding nucleotide. A K
I
value was obtained for a window of 250 kb, centered on each
gene. We used K
A
/K
I
instead of K
A
/K
S
as the measure of rates
of protein evolution, because of the close proximity between
human and chimpanzees, which results quite often in a K
S
equal to 0. The averages for K
A
, K
S
, K
I
, and the ratio K
A
/K
I
are
0.00317, 0.0142, 0.0126 and 0.2483, respectively. Because of
the strict criteria defined to retrieve the set of orthologous
genes, the maximum values of each index are not high enough
to be suspicious of false orthology or misalignment (K
S
<
0.32, K
A
< 0.055 and K
I
< 0.0259)
A second dataset was used to calculate lineage specific evolu-
tionary rates. More than 7,000 unambiguously orthologous
genes were recovered for 4 species (human, chimpanzee, rat
and mouse). We applied the same filtering criteria as in the
previous dataset and were left with a set of 4,905 orthologous
genes with coordinates in both species and evolutionary rates
for every branch in the non-rooted tree. Finally, the lineage
specific evolutionary rates were estimated using a non-rooted
tree in PAML.
Polymorphism data
Polymorphism data were gathered from the SeattleSNP web-
page [57]. Briefly, we downloaded nucleotide diversity meas-
ures for 256 genes. These measures have been obtained from
full resequenceing of 24 African-American and 23 European
(Centre d'Etude du Polymorphisme Humain (CEPH))
subjects.
Recombination
Human recombination rates, measured in cM·Mb
-1
, were
obtained from the fine-resolution recombination map in the
USCS genome browser by selecting the track SNP Recombi-
nation Rates. Estimates are based on the HapMap phase I
data, release 16a, and Perlegen data [62]. Fine scale
recombination maps are not yet available for chimpanzees.
All genes were assigned a recombination rate computed as the
average of all SNPs included within them. Any genes for
which recombination rates could not be determined were
removed from any recombination-based analysis.
Structural information
Coordinates of telomeres and centromeres of all chromo-
somes were obtained from Build 34 of the human genome
[63] and NCBI Build 1 of the chimpanzee genome [63]. We
considered as rearranged chromosomes all those for which
major chromosomal rearrangements in either the human or
the chimpanzee lineages have been indicated by recent in
silico [2,7] or cytological data [8-13]. This comprised human
chromosomes 1, 4, 5, 9,12,15, 16, 17 and 18, which differ by a
pericentric inversion, and human chromosome 2, which has
been generated by an ancestral telomere-telomere fusion [6].
For all chromosomes, all in silico-estimated coordinates were
compared with newly available cytological data in order to
confirm inversion coordinates. The most remarkable differ-
ence from both methodologies comes from chromosome 1, in
which an inversion of about 30 Mb was detected in silico that
has not been detected by cytological approaches (Table A9 in
Additional data file 1).
Segmental duplications
Human and chimpanzee SD coordinates were downloaded
from the Segmental Duplications Database [64,65]. As a con-
servative measure against false orthology, genes in our data-
set overlapping the positions of SDs were removed from the
analysis related to rearrangements.
Genomic position of genes
Location information was derived from both humans and
chimpanzees. When genes located in different genomic
regions of interest (such as sex chromosomes, SDs or telom-
eres) were studied, being in one such region in either human
or chimpanzee was enough to classify a gene as located in
such a region. Location was established sequentially as shown
in the Results section.
Permutation tests
Genes in different categories were compared by means of
pairwise permutation tests (based on 1,000 permutations). P
values are calculated as the proportion of times that the dif-
ference of averages between two categories in a permuted
dataset is equal to or larger than the observed difference.
Genome Biology 2007, Volume 8, Issue 10, Article R230 Marques-Bonet et al. R230.13
Genome Biology 2007, 8:R230
Go categorization and analysis
Functional annotations of genes based on GO [53] were
extracted from [66] for the three ontologies Molecular func-
tion, Biological process and Cellular component. GO terms
are organized into hierarchical structures such that a special-
ized term can be associated with several less specialized
terms. We used an inclusive analysis, in which genes anno-
tated with terms that are descendant of a term corresponding
to a given level take their annotation from their parent.
To test whether there was a significant deviation from ran-
dom expectation for distribution of GO annotations for genes
in colinear chromosomes compared to genes in rearranged
chromosomes or genes within the inverted zone compared to
genes outside of the inversion, we used the Z-score
transformation:
where
μ
x
= mean and = standard error). was calcu-
lated as:
where p = proportion of genes in the category in question and
N = number of genes in the category. If several inclusive cat-
egories were found overrepresented in the regions of study,
we picked up the significant GO category with higher hierar-
chical level. P values were estimated from Z-score using the
algorithm described in [67]. Only significant values after Bon-
ferroni correction for multiple testing were considered.
Abbreviations
GO, Gene Ontology; SD, segmental duplication.
Authors' contributions
T. M B. and J. S R. performed the divergence analysis. L. A.,
and R. K. were involved in data gathering. E. G. and J. B. par-
ticipated in the discussion and interpretation of results. M. R.
provided cytological information of the rearrangements and
dicussion of results. N. L B. performed the GO analysis. T.
M B. and A N. designed the study and wrote the paper.
Additional data files
The following additional data are available with the online
version of this paper. Additional data file 1 includes analysis
of lineage-specific evolutionary rates and recombination
rates for factors known to affect evolutionary rates and
according to their position in relation to rearrangements as
well as a comparison of evolutionary breakpoints between
human and chimpanzee.
Additional data file 1Analysis of lineage-specific evolutionary rates and recombination rates for factors known to affect evolutionary rates and according to their position in relation to rearrangements and a comparison of evolutionary breakpoints between human and chimpanzeeAnalysis of lineage-specific evolutionary rates and recombination rates for factors known to affect evolutionary rates and according to their position in relation to rearrangements as well as a comparison of evolutionary breakpoints between human and chimpanzee.Click here for file
Acknowledgements
We thank O Lao, O Fernando, E Eichler, M Przeworski and the members
of the Evolutionary Biology Unit in UPF for enriching discussions during the
preparation of this work. This research was supported by grants to AN
from the Ministerio de Ciencia y Tecnologia (Spain, BOS2003-0870 and
BFU2006 15413-C02-01); the Genome Canada-Genoma España Joint
R+D+I Projects in Human Health (JLI/038) and the National Institute of
Bioinformatics , a platform of Genoma España. T M-B
is a research fellow supported by Departament d'Educacio i Universitats de
la Generalitat de Catalunya.
References
1. Chen FC, Li WH: Genomic divergences between humans and
other hominoids and the effective population size of the
common ancestor of humans and chimpanzees. Am J Human
Genet 2001, 68:444-456.
2. Mikkelsen TS, Hillier LW, Eichler EE, Zody MC, Jaffe DB, Yang SP,
Enard W, Hellmann I, Lindblad-Toh K, Altheide TK, et al.: Initial
sequence of the chimpanzee genome and comparison with
the human genome. Nature 2005, 437:69-87.
3. Britten RJ: Divergence between samples of chimpanzee and
human DNA sequences is 5%, counting indels. Proc Natl Acad
Sci USA 2002, 99:13633-13635.
4. Cheng Z, Ventura M, She XW, Khaitovich P, Graves T, Osoegawa K,
Church D, DeJong P, Wilson RK, Paabo S, et al.: A genome-wide
comparison of recent chimpanzee and human segmental
duplications. Nature 2005, 437:88-93.
5. She XW, Liu G, Ventura M, Zhao S, Misceo D, Roberto R, Cardone
MF, Rocchi M, Green ED, Archidiacano N, et al.: A preliminary
comparative analysis of primate segmental duplications
shows elevated substitution rates and a great-ape expansion
of intrachromosomal duplications. Genome Res 2006,
16:576-583.
6. Yunis JJ, Prakash O: The origin of man - a chromosomal picto-
rial legacy. Science 1982, 215:1525-1530.
7. Feuk L, MacDonald JR, Tang T, Carson AR, Li M, Rao G, Khaja R,
Scherer SW: Discovery of human inversion polymorphisms by
comparative analysis of human and chimpanzee DNA
sequence assemblies. Plos Genet 2005, 1:489-498.
8. Kehrer-Sawatzki H, Sandig CA, Goidts V, Hameister H: Breakpoint
analysis of the pericentric inversion between chimpanzee
chromosome 10 and the homologous chromosome 12 in
humans. Cytogenet Genome Res 2005, 108:91-97.
9. Kehrer-Sawatzki H, Sandig C, Chuzhanova N, Goidts V, Szamalek JM,
Tanzer S, Muller S, Platzer M, Cooper DN, Hameister H: Break-
point analysis of the pericentric inversion distinguishing
human chromosome 4 from the homologous chromosome
in the chimpanzee (Pan troglodytes). Hum Mut 2005, 25:45-55.
10. Szamalek JM, Goidts V, Chuzhanova N, Hameister H, Cooper DN,
Kehrer-Sawatzki H: Molecular characterisation of the pericen-
tric inversion that distinguishes human chromosome 5 from
the homologous chimpanzee chromosome. Hum Genet 2005,
117:168-176.
11. Kehrer-Sawatzki H, Szamalek JM, Tanzer S, Platzer M, Hameister H:
Molecular characterization of the pericentric inversion of
chimpanzee chromosome 11 homologous to human chro-
mosome 9. Genomics 2005, 85:542-550.
12. Kehrer-Sawatzki H, Schreiner B, Tanzer S, Platzer M, Muller S,
Hameister H: Molecular characterization of the pericentric
inversion that causes differences between chimpanzee chro-
mosome 19 and human chromosome 17. Am J Hum Genet 2002,
71:375-388.
13. Goidts V, Szamalek JM, Hameister H, Kehrer-Sawatzki H: Segmen-
tal duplication associated with the human-specific inversion
of chromosome 18: a further example of the impact of seg-
mental duplications on karyotype and genome evolution in
primates. Hum Genet 2004, 115:116-122.
14. Locke DP, Archidiacono N, Misceo D, Cardone MF, Deschamps S,
Roe B, Rocchi M, Eichler EE: Refinement of a chimpanzee peri-
centric inversion breakpoint to a segmental duplication
cluster. Genome Biol 2003, 4:R50.
15. Goidts V, Szamalek JM, de Jong PJ, Cooper DN, Chuzhanova N,
Hameister H, Kehrer-Sawatzki H: Independent intrachromo-
somal recombination events underlie the pericentric inver-
sions of chimpanzee and gorilla chromosomes homologous
ZX
xxx
=−()/
μσ
σ
x
σ
x
σ
x
pp
N
=
−()1
Genome Biology 2007, 8:R230
Genome Biology 2007, Volume 8, Issue 10, Article R230 Marques-Bonet et al. R230.14
to human chromosome 16. Genome Res 2005, 15:1232-1242.
16. Dennehey BK, Gutches DG, McConkey EH, Krauter KS: Inversion,
duplication, and changes in gene context are associated with
human chromosome 18 evolution. Genomics 2004, 83:493-501.
17. Ayala FJ, Coluzzi M: Chromosome speciation: humans, Dro-
sophila, and mosquitoes. Proc Natl Acad Sci USA 2005,
102:6535-6542.
18. Barton N: How did the human species form? Curr Biol 2006,
16:647-650.
19. Navarro A, Barton NH: Chromosomal speciation and molecu-
lar divergence - accelerated evolution in rearranged
chromosomes. Science 2003, 300:321-324.
20. Noor MAF, Grams KL, Bertucci LA, Reiland J: Chromosomal
inversions and the reproductive isolation of species. Proc Natl
Acad Sci USA 2001, 98:12084-12088.
21. Kirkpatrick M, Barton N: Chromosome inversions, local adapta-
tion and speciation. Genetics 2006, 173:419-434.
22. Ortiz-Barrientos D, Reiland J, Hey J, Noor MAF: Recombination
and the divergence of hybridizing species. Genetica 2002,
116:167-178.
23. Navarro A, Barton NH: Accumulating postzygotic isolation
genes in parapatry: A new twist on chromosomal speciation.
Evolution 2003, 57:447-459.
24. Rieseberg LH: Chromosomal rearrangements and speciation.
Trends Ecol Evol 2001, 16:351-358.
25. Lu J, Li WH, Wu CI: Comment on "Chromosomal speciation
and molecular divergence - accelerated evolution in rear-
ranged chromosomes". Science 2003, 302:
988.
26. Navarro A, Marques-Bonet T, Barton NH: Response to comment
on "Chromosomal speciation and molecular divergence -
accelerated evolution in rearranged chromosomes". Science
2003, 302:988.
27. Vallender EJ, Lahn BT: Effects of chromosomal rearrangements
on human-chimpanzee molecular evolution. Genomics 2004,
84:757-761.
28. Zhang JZ, Wang XX, Podlaha O: Testing the chromosomal spe-
ciation hypothesis for humans and chimpanzees. Genome Res
2004, 14:845-851.
29. Marques-Bonet T, Caceres M, Bertranpetit J, Preuss TM, Thomas JW,
Navarro A: Chromosomal rearrangements and the genomic
distribution of gene-expression divergence in humans and
chimpanzees. Trends Genet 2004, 20:524-529.
30. Armengol L, Pujana MA, Cheung J, Scherer SW, Estivill X: Enrich-
ment of segmental duplications in regions of breaks of syn-
teny between the human and mouse genomes suggest their
involvement in evolutionary rearrangements. Hum Mol Genet
2003, 12:2201-2208.
31. Marques-Bonet T, Navarro A: Chromosomal rearrangements
are associated with higher rates of molecular evolution in
mammals. Gene 2005, 353:147-154.
32. Rieseberg LH, Whitton J, Gardner K: Hybrid zones and the
genetic architecture of a barrier to gene flow between two
sunflower species. Genetics 1999, 152:713-727.
33. Rieseberg LH, Vanfossen C, Desrochers AM: Hybrid speciation
accompanied by genomic reorganization in wild sunflowers.
Nature 1995, 375:313-316.
34. Armengol L, Marques-Bonet T, Cheung J, Khaja R, Gonzalez JR,
Scherer SW, Navarro A, Estivill X: Murine segmental duplica-
tions are hot spots for chromosome and gene evolution.
Genomics 2005, 86:692-700.
35. Basset P, Yannic G, Bruenner H, Hausser J: Restricted gene flow at
specific parts of the shrew genome in chromosomal hybrids
zones. Evolution 2006, 60:1718-1730.
36. Osada N, Wu CI: Inferring the mode of speciation from
genomic data: A study of the great apes. Genetics 2005,
169:259-264.
37. Patterson N, Richter DJ, Gnerre S, Lander ES, Reich D: Genetic evi-
dence for complex speciation of humans and chimpanzees.
Nature 2006, 441:1103-1108.
38. Crow JF: A new study challenges the current belief of a high
human male : female mutation ratio. Trends Genet 2000,
16:525-526.
39. Hurst LD, Ellegren H: Sex biases in the mutation rate. Trends
Genet 1998, 14:446-452.
40. Li WH, Yi SJ, Makova K: Male-driven evolution. Curr Opin Genet
Dev 2002, 12:650-656.
41. Makova KD, Li WH: Strong male-driven evolution of DNA
sequences in humans and apes. Nature 2002, 416:624-626.
42. Wolfe KH, Sharp PM: Mammalian gene evolution - nucleotide-
sequence divergence between mouse and rat. J Mol Evol 1993,
37:441-456.
43. Lynch M, Conery JS: The evolutionary fate and consequences of
duplicate genes. Science 2000, 290:1151-1155.
44. Zhang P, Gu ZL, Li WH: Different evolutionary patterns
between young duplicate genes in the human genome.
Genome Biol 2003, 4:R56.
45. Rudd MK, Willard HF: Analysis of the centromeric regions of
the human genome assembly. Trends Genet 2004, 20:529-533.
46. She XW, Horvath JE, Jiang ZS, Liu G, Furey TS, Christ L, Clark R,
Graves T, Gulden CL, Alkan C, et al.: The structure and evolution
of centromeric transition regions within the human genome.
Nature 2004, 430:857-864.
47. She XW, Jiang ZX, Clark RL, Liu G, Cheng Z, Tuzun E, Church DM,
Sutton G, Halpern AL, Eichler EE: Shotgun sequence assembly
and recent segmental duplications within the human
genome. Nature 2004, 431:927-930.
48. Castresana J: Genes on human chromosome 19 show extreme
divergence from the mouse orthologs and a high GC
content.
Nucleic Acids Res 2002, 30:1751-1756.
49. Andolfatto P, Depaulis F, Navarro A: Inversion polymorphisms
and nucleotide variability in Drosophila. Genetical Res 2001,
77:1-8.
50. Newman TL, Tuzun E, Morrison VA, Hayden KE, Ventura M,
McGrath SD, Rocchi M, Eichler EE: A genome-wide survey of
structural variation between human and chimpanzee.
Genome Res 2005, 15:1344-1356.
51. Hellmann I, Ebersberger I, Ptak SE, Paabo S, Przeworski M: A neutral
explanation for the correlation of diversity with recombina-
tion rates in humans. Am J Hum Genet 2003, 72:1527-1535.
52. Kong A, Gudbjartsson DF, Sainz J, Jonsdottir GM, Gudjonsson SA,
Richardsson B, Sigurdardottir S, Barnard J, Hallbeck B, Masson G, et
al.: A high-resolution recombination map of the human
genome. Nat Genet 2002, 31:241-247.
53. Harris MA, Clark JI, Ireland A, Lomax J, Ashburner M, Collins R, Eil-
beck K, Lewis S, Mungall C, Richter J, et al.: The Gene Ontology
(GO) project in 2006. Nucleic Acids Res 2006, 34:D322-D326.
54. Arbiza L, Dopazo J, Dopazo H: Positive selection, relaxation, and
acceleration in the evolution of the human and chimp
genome. Plos Computational Biol 2006, 2:288-300.
55. Nielsen R, Bustamante C, Clark AG, Glanowski S, Sackton TB, Hubisz
MJ, Fledel-Alon A, Tanenbaum DM, Civello D, White TJ, et al.: A scan
for positively selected genes in the genomes of humans and
chimpanzees. Plos Biol 2005, 3:976-985.
56. Voight BF, Kudaravalli S, Wen XQ, Pritchard JK: A map of recent
positive selection in the human genome (vol 4, pg 154, 2006).
Plos Biol 2006, 4:659-659.
57. SeattleSNPs [ />58. Ptak SE, Hinds DA, Koehler K, Nickel B, Patil N, Ballinger DG, Prze-
worski M, Frazer KA, Paabo S: Fine-scale recombination pat-
terns differ between chimpanzees and humans. Nat Genet
2005, 37:445-445.
59. Seuanez HN, Evans HJ, Martin DE, Fletcher J: Inversion of chromo-
some-2 that distinguishes between Bornean and Sumatran
orangutans. Cytogenet Cell Genet 1979, 23:137-140.
60. Innan H, Watanabe H: The effect of gene flow on the coalescent
time in the human-chimpanzee ancestral population. Mol Biol
Evol 2006, 23:1040-1047.
61. Yang ZH: PAML: a program package for phylogenetic analysis
by maximum likelihood. Computer Appl Biosci 1997, 13:555-556.
62. Hinds DA, Stuve LL, Nilsen GB, Halperin E, Eskin E, Ballinger DG,
Frazer KA, Cox DR: Whole-genome patterns of common DNA
variation in three human populations. Science 2005,
307:1072-1079.
63. USCS Genome Browser []
64. Human Segmental Duplications Database [http://humanparal
ogy.gs.washington.edu/]
65. Chimpanzee Segmental Duplications Database [http://
chimpparalogy.gs.washington.edu/]
66. Hubbard TJP, Aken BL, Beal K, Ballester B, Caccamo M, Chen Y,
Clarke L, Coates G, Cunningham F, Cutts T, et al.: Ensembl 2007.
Nucleic Acids Res 2007, 35:D610-D617.
67. Ibbetson D: Algorithm 209: Gauss. Commun ACM 1963, 6:616.