Báo cáo y học: "The global landscape of sequence diversity" docx
Bạn đang xem bản rút gọn của tài liệu. Xem và tải ngay bản đầy đủ của tài liệu tại đây (3.28 MB, 17 trang )
Genome Biology 2007, 8:R238
Open Access
2007Peregrín-Álvarez and ParkinsonVolume 8, Issue 11, Article R238
Research
The global landscape of sequence diversity
José Manuel Peregrín-Álvarez
*†
and John Parkinson
*†
Addresses:
*
Molecular Structure and Function, Hospital for Sick Children, 555 University Avenue, Toronto, ON M5G 1X8, Canada.
†
Departments of Biochemistry and Molecular Genetics, 1 King's College Circle, University of Toronto, Toronto, ON M5S 1A1, Canada.
Correspondence: John Parkinson. Email:
© 2007 Peregrín-Álvarez and Parkinson; licensee BioMed Central Ltd.
This is an open access article distributed under the terms of the Creative Commons Attribution License ( which
permits unrestricted use, distribution, and reproduction in any medium, provided the original work is properly cited.
Sequence diversity across eukaryotes and prokaryotes<p>Comparison of genomic and EST sequences reveals a greater genetic diversity within eukaryotes than prokaryotes and enables identi-fication of taxon-specific sequences.</p>
Abstract
Background: Systematic comparisons between genomic sequence datasets have revealed a wide
spectrum of sequence specificity from sequences that are highly conserved to those that are
specific to individual species. Due to the limited number of fully sequenced eukaryotic genomes,
analyses of this spectrum have largely focused on prokaryotes. Combining existing genomic
datasets with the partial genomes of 193 eukaryotes derived from collections of expressed
sequence tags, we performed a quantitative analysis of the sequence specificity spectrum to provide
a global view of the origins and extent of sequence diversity across the three domains of life.
Results: Comparisons with prokaryotic datasets reveal a greater genetic diversity within
eukaryotes that may be related to differences in modes of genetic inheritance. Mapping this
diversity within a phylogenetic framework revealed that the majority of sequences are either highly
conserved or specific to the species or taxon from which they derive. Between these two
extremes, several evolutionary landmarks consisting of large numbers of sequences conserved
within specific taxonomic groups were identified. For example, 8% of sequences derived from
metazoan species are specific and conserved within the metazoan lineage. Many of these sequences
likely mediate metazoan specific functions, such as cell-cell communication and differentiation.
Conclusion: Through the use of partial genome datasets, this study provides a unique perspective
of sequence conservation across the three domains of life. The provision of taxon restricted
sequences should prove valuable for future computational and biochemical analyses aimed at
understanding evolutionary and functional relationships.
Background
Sequence space - the sum of all distinct protein and DNA
sequences - is vast. A single copy of every possible 300 residue
protein, for example, would fill several universes [1]. In con-
sequence, the evolution of genes, which mainly occurs
through duplication, divergence and recombination [2], has
led to only a small sampling of the available space. Systematic
comparisons of proteins and coding sequences from existing
genome scale datasets from a wide variety of organisms [3]
are beginning to yield insights into the generation and extent
of sequence diversity across life [4-9]. In addition to the con-
tinued discovery of apparently novel genes and gene families
with each new sampled organism, these studies are beginning
to reveal a wide spectrum of sequence specificity. At one
extreme, sequences may be highly conserved across many dif-
ferent species from several evolutionarily distant lineages.
Published: 8 November 2007
Genome Biology 2007, 8:R238 (doi:10.1186/gb-2007-8-11-r238)
Received: 25 May 2007
Revised: 18 October 2007
Accepted: 8 November 2007
The electronic version of this article is the complete one and can be
found online at />Genome Biology 2007, 8:R238
Genome Biology 2007, Volume 8, Issue 11, Article R238 Peregrín-Álvarez and Parkinson R238.2
The identification of these conserved sequences, perhaps con-
strained through extensive interactions with several different
protein partners (for example, histones [10]), can provide
clues about the genome content of the last universal common
ancestor [11]. At the other end of the spectrum of sequence
specificity, sequences may be unique to a single species [12-
14]. These so-called ORFan sequences are thought to repre-
sent sequences that are either remote homologs of known
gene families, difficult to detect through current tools, or
sequences that may have arisen de novo from non-coding
sequences. However, it should be noted that many ORFans
may simply arise as a consequence of incomplete sampling of
sequence space. Further exploration of this space through
additional sequencing is, therefore, expected to reduce their
incidence [9].
While the exploration of this spectrum of sequence specificity
is being usefully exploited to derive novel evolutionary and
functional relationships, much of the focus has centered on
sequences of prokaryotic origin. This is primarily due to the
greater number of bacterial genomes that have been
sequenced to date. However, the high incidence of lateral
gene transfer (LGT) events in prokaryotes has resulted in the
lack of a robustly defined phylogeny and, hence, studies of
sequence diversity have largely focused on the identification
and characterization of sequences at the two extremes of the
spectrum [14-18]. On the other hand, while the taxonomic
relationships in eukaryotes are more clearly defined, detailed
systematic analyses of diversity within eukaryotes on the
basis of fully sequenced genomes are precluded by the limited
number and phylogenetic range of organisms that have been
sequenced [19].
Aside from fully sequenced genomes, a large amount of
sequence data has been, and continues to be, generated
within the context of survey sequencing projects. Metagen-
omics projects, such as those exploring sequence diversity in
the human gut or niches within the ocean, are continuing to
expand the known repertoire of protein families [4,9,20].
However, due to the methods employed, these projects tend
to focus on prokaryotes. Furthermore, the use of shotgun
sequencing applied to heterogeneous samples leads to diffi-
culties in assessing the taxonomic relationships within these
datasets. More pertinently, over the past decade a plethora of
sequencing projects has been initiated with the express aim of
generating sequence data in the form of expressed sequence
tags (ESTs) from eukaryotic taxa that have previously been
neglected by genome sequencing initiatives (for example, [21-
24]). As we have previously demonstrated, it is possible to use
these datasets to identify non-redundant sets of genes associ-
ated with each species [25,26]. Due to the incomplete nature
of these collections of genes, we term such collections 'partial
genomes'. These datasets provide a tremendous source of
eukaryotic sequence information from a diverse range of spe-
cies with well defined taxonomic relationships and have
recently been exploited to explore genetic diversity within, for
example, Nematoda [24] and the Coleoptera [21]. In a previ-
ous study we collated and processed 1.2 million ESTs from
193 species of eukaryotes to create 546,451 putative gene
sequences [26]. Here we use these data to supplement
741,098 protein sequences from 198 fully sequenced genome
datasets to perform a systematic analysis of sequence diver-
sity across the three domains of life. Uniquely, we place our
findings in the context of previously defined taxonomic rela-
tionships to identify and characterize landmarks of sequence
evolution within the tree of life. These evolutionary datasets
are provided through a publicly accessible online resource
[27].
Results
Sampling sequence space within the three domains of
life
Previous studies of bacterial genomes have shown that as new
genome sequences become available, there is an almost con-
stant increase in new coding sequences discovered [17,28].
From the analysis of 1.28 million sequences (Table 1), we
extend these studies to examine the extent to which sequence
space has been sampled across the three domains of life
(Additional data files 1-3). In the following, we quantify the
accumulation of 'distinct' coding sequences and gene families
with the addition of genome datasets across a broad set of dif-
ferent taxonomic groups. In the context of this study we
define a sequence as 'distinct' if it does not possess significant
sequence similarity, on the basis of exhaustive BLAST
searches, to previously sampled sequences.
Consistent with previous studies, we find an almost constant
increase in the discovery of distinct sequences as new
genomes are sequenced (Figure 1a, b) [6,17]. In bacteria, of
477,069 sequences (from 161 genomes sampled), 92,763 were
defined as distinct (Figure 1a). This gives an 'overall sequence
discovery rate' (OSDR) of 19.5%, compared with 39% for
eukaryotes (86,665/221,948 for 19 genomes) and 37.8% for
Archaea (15,903/42,079 for 19 genomes) (Table 2). From the
bacterial datasets it is obvious that as more genomes are
added, the rate of new sequence discovery decreases. Hence,
the disparity in OSDR between the bacterial and the other two
datasets may stem from the difference in the number of
genomes sampled. For example, random samples of 19 bacte-
rial genomes yields an OSDR of 40.3 ± 3.3% (n = 400), com-
parable to the archaeal and eukaryotic datasets. At this time,
however, the limited number of genomes available for
Archaea and Eukarya negates our ability to predict with any
confidence the future trends associated with these datasets.
Furthermore, at least for eukaryotes, the OSDR may be
skewed by the close evolutionary relationships of some of the
genomes sampled (for example, Caenorhabditis briggsae
and C. elegans; Mus musculus and Homo sapiens; Figure 1b).
For example, sequence similarity analyses of 16 highly con-
served gene families found that sequences from the eukaryo-
tic genomes tended to be more closely related than those from
Genome Biology 2007, Volume 8, Issue 11, Article R238 Peregrín-Álvarez and Parkinson R238.3
Genome Biology 2007, 8:R238
randomly selected sets of equivalent numbers of bacterial
genomes (Additional data file 4). On the other hand, with
sequence data from 193 different species of eukaryotes, par-
tial genomes offer a depth and breadth of sampling that can
be usefully exploited to examine sequence diversity in more
detail (Figure 1c and Table 2). For the entire dataset we
observe an almost constant (but decreasing) rate of new
sequence discovery (OSDR = 53.7%). Interestingly, the rate
varied between different taxonomic groups (Figure 1c). Plants
had the lowest rate (OSDR = 48.3%), reflecting the close evo-
lutionary relationships of species from this group (70/76
datasets were derived from Spermatophyta). Protists had the
highest rate (OSDR = 88.1%), highlighting their huge diver-
sity and an associated lack of sequence sampling for these
organisms [29].
Since the rate of sequence discovery decreases as a function of
accumulated genomes, we were interested in determining the
'current sequence discovery rate' (CSDR), here defined as the
percentage of distinct sequences associated with the last
genome added to the existing dataset. From Figure 1d we
obtain CSDR values of 11.8% for the 161 bacterial genomes
(consistent with previous estimates [17]) and 40.3% for the
193 eukaryotic partial genomes (Table 2). Together with the
large difference in OSDR, these values suggest that the
eukaryotic partial genome datasets are more genetically
diverse than the bacterial datasets. Previously, it has been
suggested that many apparently novel sequences may rather
represent artifacts of short, potentially mis-annotated
sequences. Therefore, while subsequent studies have shown
that many short sequences do indeed encode functional pro-
teins [14,17], it is possible that short sequences may be
responsible for the observed increase in diversity associated
with the partial genome datasets. We therefore repeated these
analyses using only sequences greater than 100 residues in
the bacterial datasets and 300 bp in the partial genome data-
sets (Figure 1a, d). Although we noted decreases in the rate of
sequence discovery, excluding the shorter sequences resulted
in similar trends to those observed in the full sequence data-
sets (CSDR = 8.6% for bacterial genomes and 35.6% for par-
tial genomes; Table 2).
Impact of sampling bias and genome duplication on
genetic diversity
Rather than being randomly sampled, selection of organisms
for genome sequencing projects have primarily been moti-
vated by medical or economic concerns. This bias has resulted
in the generation of sequences from many closely related
strains of bacteria (for example, five strains of Staphylococ-
cus aureus are represented in our dataset) that could affect
sequence discovery rates (Additional data file 5). Recalcula-
tions of sequence discovery rates using only a single repre-
sentative (largest) for each bacterial species (127 genomes
total) or only a single representative (largest) for each bacte-
rial genus (86 genomes total) increased CSDR by 2.5% and
4.6%, respectively (Figure 1e and Table 2). However, despite
these increases, rates of sequence discovery are still consider-
ably lower than those obtained for the partial genome data-
sets in which no genomes were removed.
In addition to sampling biases in bacteria, whole genome
duplication events observed for many eukaryotic lineages
could result in the retention of many replicates of similar
genes and, thus, contribute to the higher sequence discovery
rates observed in eukaryotes. We therefore repeated our anal-
yses using gene families (Table 2 and Additional data files 2
and 3). For both bacterial and partial genome datasets, the
'current gene family discovery rate' (CGDR - similar to CSDR
but applied to gene families) was slightly higher (15.4% and
42.8%, respectively) than the respective CSDRs (Figure 1e
and Table 2). However, the large difference observed between
the two datasets indicates that genome-specific duplication
Table 1
Taxonomic distribution of genomic datasets used in this study
Set Taxonomic group No. of species No. of sequences
Fully sequenced genomes Archaea 19 42,079
Bacteria 160 477,069
Eukarya 19 221,950
Total 198 741,098
Partial genomes Protists 17 43,550
Viridiplantae 76 221,896
Fungi 27 62,528
Arthropods 17 22,528
Nematodes 31 95,341
Lophotrochozoa 4 10,365
Deuterostomes 21 90,243
Total 193 546,451
Genome Biology 2007, 8:R238
Genome Biology 2007, Volume 8, Issue 11, Article R238 Peregrín-Álvarez and Parkinson R238.4
Figure 1 (see legend on next page)
0 100,000 200,000 300,000 400,000
500,000
0
20,000
40,000
60,000
80,000
100,000
All bacterial sequences, random order
All bacterial sequences, ordered by genome size
Bacterial sequences > 100 residues, ordered by
genome size
Number of sequences
Number of ‘distinct’ sequences
Number of ‘distinct’ sequences
0 100,000 200,000 300,000
0
20,000
40,000
60,000
80,000
100,000
H. sapiens
A. thaliana
M. musculus
D. melanogaster
A. gambiae
C. elegans
C. briggsae
(a)
(b)
Number of sequences
(d)
(e)
Number of genomes / partial genomes
Number of sequences
Number of ‘distinct’ sequences
(c)
Plants
Nematodes
Deuterostomes
Fungi
Protists
Arthropods
Gene family discovery rate
Sequence discovery rate
0 20,000 40,000
60,000
80,000 100,000 120,000
0
10,000
20,000
30,000
40,000
50,000
60,000
70,000
0
50,000
100,000
150,000
200,000
250,000
0
20,000
40,000
60,000
80,000
100,000
120,000
Number of genomes / partial genomes
02040
60
80 100 120 140
160
180
0.00 0.00
0.10 0.10
0.20 0.20
0.30 0.30
0.40 0.40
0.50 0.50
0.60 0.60
0.70 0.70
0.80 0.80
0.90 0.90
Bacterial sequences
Partial genome sequences
Bacterial sequences >100 residues
Partial genome sequences > 300 bp
Bacterial sequences - strains filtered
Bacterial sequences - species filtered
02040
60
80 100 120 140
160
180
0.00 0.00
0.10 0.10
0.20 0.20
0.30 0.30
0.40 0.40
0.50 0.50
0.60 0.60
0.70 0.70
0.80 0.80
0.90 0.90
Bacterial gene families
Partial genome gene families
Bacterial gene families - strains filtered
Bacterial gene families - species filtered
Genome Biology 2007, Volume 8, Issue 11, Article R238 Peregrín-Álvarez and Parkinson R238.5
Genome Biology 2007, 8:R238
events do not have a major influence on sequence discovery
rates. Furthermore, analyses of gene family discovery rates
within different eukaryotic taxa revealed similar trends to
those observed for sequence discovery rates (Additional data
file 5).
Together these results suggest that the observed differences
in sequence discovery rates between the various taxa are not
simply due to sequencing biases or lineage specific duplica-
tions, but rather reflect genuine differences in sequence
diversity.
Sequence comparisons between the three domains of
life
It is clear that sequencing of new genomes will continue to
reveal a substantial fraction of previously unidentified
sequence. We next wished to investigate how non-unique
sequences are distributed across the various taxonomic
groupings. In this section we use the fully sequenced genome
datasets to examine the extent of sequence conservation
between the three domains of life (Additional data file 2).
Only 20% of eukaryotic sequences are conserved across all
three domains (defined as sequences with sequence similarity
to at least one bacterial, eukaryotic and archaeal genome), a
much lower proportion than for both Archaea and Bacteria
(33% and 34.4%, respectively). Conversely, eukaryotes had
the highest percentage of domain specific sequences (65.2%
compared with 39.4% and 44.5% for Archaea and Bacteria,
respectively; Figure 2a). Consistent with our earlier findings,
Bacteria possess proportionately fewer (11.3%) species-spe-
cific sequences than Eukarya and Archaea (20.1% and 19.5%,
respectively).
Within the set of sequences common to all three domains, we
may expect to find a core set of 'promiscuous' sequences com-
mon to all 198 complete genomes. Previous estimates suggest
that there may be as few as 34-80 such genes per genome
[15,16,30]. Our analyses identified 13,055 sequences (repre-
senting 2% of all sequences from the complete genomes) pos-
sessing significant sequence similarity to a sequence from
each of the 198 complete genomes. Compared with other less
well conserved sequences and consistent with previous find-
ings, these promiscuous sequences are associated with a lim-
ited number of basic biological processes, including
transcription, translation and metabolism (Figure 2b).
Although we might expect to find similar numbers of promis-
cuous sequences in each genome, there was considerable var-
iation: from 15 in the nanoarchaeotan Nanoarchaeum
equitans to 208 in the alphaproteobacterium Sinorhizobium
meliloti (mean = 64, standard deviation = 33.7). This varia-
tion could indicate species-specific expansions associated
with one or more of these core genes. Using the COGENT
database [31], the 13,055 sequences could be classified into 74
distinct gene families (Additional data file 2). The numbers of
gene families per genome (mean = 19.5, standard deviation =
2.6) varied from 13 for Cryptosporidium parvum (derived
from 16 sequences) to 28 for Saccharomyces cerevisiae and
Homo sapiens (59 and 150 sequences, respectively).
The large variation in numbers of promiscuous sequences per
genome compared to gene families suggests that, in certain
lineages, gene families have undergone significant expan-
sions. For example, of the 208 promiscuous sequences iden-
tified in S. meliloti, 166 were associated with a single family of
ABC transporters. The identification of 74 distinct families
with an average of only about 20 families per genome indi-
cates that the Markov clustering (MCL) process used by
COGENT may be separating otherwise related sequences into
distinct subfamilies on the basis of specialized sequence fea-
tures. To investigate this further we examined the incidence
of other non-promiscuous (that is, with sequence similarity
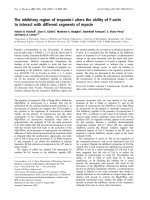
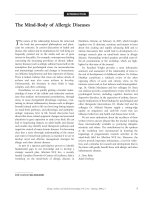
Sequence discovery rates across various taxonomic groupsFigure 1 (see previous page)
Sequence discovery rates across various taxonomic groups. (a) Discovery of 'distinct' sequences as a function of sampled bacterial genomes. Distinct
sequences are defined as those that do not share significant sequence similarity with a sequence in a previously sampled genome. Each point represents the
addition of a new genome, ordered either by the number of sequences (largest first) or by random. Two datasets are shown: one that considers all
sequences; and one that considers only sequences that consist of more than 100 residues. (b) Discovery of distinct sequences in fully sequenced
eukaryotic genomes. Genome addition was ordered by the number of sequences (largest first). Certain points are labeled to indicate the species added to
show how the addition of closely related species influences the local gradient of the graph. (c) Rate of distinct sequence discovery within various
taxonomic groupings of eukaryotic partial genomes. As before, each point represents the addition of a new partial genome (largest first), and color
indicates the taxonomic group sampled. It should be noted that the classification of Protista as a group is historical and has recently been shown to consist
of several paraphyletic taxa, many of which (including the species examined here) are considered basal to the root of Eukarya [29]. The inset graph
provides an expanded display. (d) Rate of sequence discovery as a function of genomes sampled for both bacterial genomes and eukaryotic partial
genomes. Each point represents the average and standard deviations of the rate of distinct sequence discovery over a sliding window representing the
cumulative addition of 30 complete or partial genomes, obtained from 400 random orderings of genome addition (see Materials and methods for more
details). The six data series include sequences from all bacterial and all partial genomes, bacterial sequences > 100 residues in length, partial genome
sequences > 300 bp in length and two 'restricted' groups of bacterial sequences: those from a collection of genomes with only a single (largest)
representative from each species ('strains filtered'); and those from a collection of genomes with only a single (again largest) representative from each
genus ('species filtered'). (e) Rate of gene family discovery for partial and bacterial genomes. Gene families include singletons (families with only a single
sequence representative) and were obtained with reference to the COGENT database for bacteria, or determined through an equivalent clustering
procedure for partial genomes (see Materials and methods). As for (d), each point represents the average and standard deviations of the rate of gene
family discovery over a sliding window representing the cumulative addition of 30 complete or partial genomes, obtained from 400 random orderings of
genome addition (see Materials and methods for more details). Also shown are the gene family discovery rates for the two 'restricted' groups of bacterial
sequences mentioned above.
Genome Biology 2007, 8:R238
Genome Biology 2007, Volume 8, Issue 11, Article R238 Peregrín-Álvarez and Parkinson R238.6
matches to < 198 genomes) members of these 74 families and
applied two dimensional clustering to group gene family pro-
files on the basis of membership of promiscuous sequences
(Figure 3). Four groups of families could be identified: those
containing promiscuous sequences from a majority of
genomes from each of the three domains of life; those con-
taining promiscuous sequences restricted to one or two
domains; those containing promiscuous sequences from a
limited number of genomes but many non-promiscuous
sequences from many other sequences (for example, TR-
000223 and TR-000013); and those containing examples of
promiscuous (and non-promiscuous) sequences from only a
limited number of genomes
The families that contain promiscuous sequences from a
majority of genomes from each of the three domains of life
include tRNA synthetases (TR-000178, TR000339, TR-
000213 and TR-00352), ABC transporters (TR-00006, and
TR-000000), elongation factors (TR-000038), translation
initiation factors (TR-000155) and GTP binding proteins
(TR-000443). These groups may be indicative of a high level
of sequence integrity associated with coupling nucleotide
binding activity required for their respective functionalities.
Of the families containing promiscuous sequences restricted
to one or two domains, 17 are common to at least 50% of the
eukaryotic species, 11 are common to at least 50% of Archaeal
Table 2
Sequence and gene family discovery rates for various complete and partial genome datasets
Sequence rate (%)
†
Family rate (%)
†
Dataset* No. of complete/partial genomes OSDR CSDR OGDR CGDR
CG Archaea 19 37.8 - 38.7 -
CG Bacteria 161 19.5 11.8 (± 1.5) 22.4 15.4 (± 1.8)
CG Bacteria strains filtered 127 28.4 15.9 (± 1.5) 26.6 20.6 (± 1.7)
CG Bacteria 127 13.4 (± 1.7) 17.0 (± 2.0)
CG Bacteria species filtered 86 23.2 20.9 (± 1.6) 31.5 26.1 (± 1.6)
CG Bacteria 86 16.3 (± 1.8) 19.9 (± 2.1)
CG Eukarya 19 39.0 - 30.8 -
PG All 193 53.7 40.3 (± 2.9) 47.7 42.8 (± 2.8)
PG Arthropods 16 74.7 - 66.4 -
PG Deuterostomes 21 71.7 - 60.8 -
PG Fungi 27 70.2 - 60.2 -
PG Nematodes 31 62.8 - 47.0 -
PG Protists 17 88.1 - 71.5 -
PG Viridiplantae 76 48.3 - 37.8 -
CG Bacteria sequences > 100 residues 161 - 8.6 (± 1.4) - -
PG Sequences > 300 bp 193 - 35.6 (± 2.8) - -
*CG, complete genome datasets; PG, partial genome datasets; 'strains filtered' indicate that only a single species representative was included in the
analysis; 'species filtered' indicate that only a single genus representative was included in the analysis.
†
OSDR, overall sequence discovery rate (the
total number of distinct sequences/total number of sequences); CSDR, current sequence discovery rate (obtained from Figure 1d, e); OGDR, overall
gene family discovery rate (total number of families/total number of sequences); CGDR, current gene family discovery rate (obtained from Figure 1d,
e).
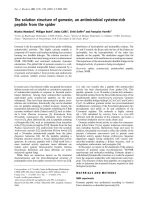
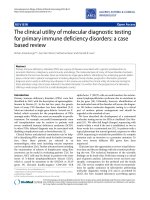
Taxonomic distribution and functional analysis of genes from fully sequenced genomesFigure 2 (see following page)
Taxonomic distribution and functional analysis of genes from fully sequenced genomes. On the basis of a raw BLAST score cutoff of 50, we determined the
number of sequences with similarity of sequences derived from the three domains of life. (a) The Venn diagram shows the proportion of sequences
associated with each group. Numbers in grey boxes show the proportion of sequences specific to their parent domain; numbers in white boxes show the
proportion of sequences that are shared with one or more members of the same domain. The numbers in the overlapping regions of the diagram show
the proportion of sequences shared between the overlapping domains: yellow, archaeal sequences; blue, bacteria; red, eukaryotes. (b) Pie charts showing
the proportion of each functional category for three datasets of sequences: highly conserved sequences (with sequence similarity to every other complete
genome dataset); semi-conserved sequences (with similarity to at least one species from each of the three domains of life); and sequences unique to a
genome (possessing no similarity to any other genome dataset). Functional categories were assigned with reference to the KEGG database (see Materials
and methods).
Genome Biology 2007, Volume 8, Issue 11, Article R238 Peregrín-Álvarez and Parkinson R238.7
Genome Biology 2007, 8:R238
Figure 2 (see legend on previous page)
(a)
(b)
EukaryaBacteria
Archaea
21.9 4.3
42079
34.4
477069
33.0
13.0
9.6
20.0
221950
12.0
2.8
19.9 19.5
20.1
45.1
11.3
33.2
% sequences
unique to a
species
% sequences
specific to
domain
No. of
sequences
% sequences
common to >1
domains
Highly conserved (present in all 198
complete genomes – 13055 sequences)
Environmental Information Processing; Membrane Transport
Genetic Information Processing; Translation
Metabolism; Amino Acid Metabolism
Metabolism; Nucleotide Metabolism
Unknown
Metabolism; Metabolism of Other Amino Acids
Metabolism; Metabolism of Cofactors and Vitamins
Metabolism; Carbohydrate Metabolism
Metabolism; Lipid Metabolism
Metabolism; Energy Metabolism
Environmental Information Processing; Signal Transduction
Genetic Information Processing; Replication and Repair
Genetic Information Processing; Folding, Sorting and Degradation
Genetic Information Processing; Transcription
Others
KEGG Functional Categories
Semi-conserved (present in three
domains of life - 206675 sequences)
Species specific (present only in a
single species – 103995 sequences)
Genome Biology 2007, 8:R238
Genome Biology 2007, Volume 8, Issue 11, Article R238 Peregrín-Álvarez and Parkinson R238.8
species, and 9 are common to at least 50% of the bacterial
species. These families represent taxa specific subgroups. For
example, there are two distinct families of aspartyl, glutami-
nyl and leucyl synthetases. One set (TR-000216, TR-000742
and TR-002174) is represented in Archaea and Eukarya,
while the other (TR-000296, TR-000139 and TR-000266) is
represented in Bacteria and Eukarya.
The families containing promiscuous sequences from a lim-
ited number of genomes but many non-promiscuous
sequences from many other sequences (for example, TR-
000223 and TR-000013) may indicate potential gene fusion
events or incorrect gene models in which the promiscuous
sequences are associated with additional sequence not found
in the other members of the family.
Most of the families containing examples of promiscuous
(and non-promiscuous) sequences from only a limited
number of genomes are representative of sequences that are
related to others in the promiscuous sequence dataset (note,
for example, the many instances of families of ABC transport-
ers) but which the MCL algorithm has presumably assigned to
different families on the basis of distinctive sequence fea-
tures. Alternatively, promiscuous sequences in these families
may possess sequence similarity to sequences outside the set
of 13,055 'core' sequences. For example, BLAST analyses of
promiscuous sequences derived from Escherichia coli reveal
that the genes RBG2, RFC2, RIX7 and RFC3 do not have sig-
nificant sequence similarity to any of the 59 promiscuous
sequences identified in S. cerevisiae (data not shown).
These analyses confirm that COGENT has grouped a number
of promiscuous sequences into families on the basis of either
domain or species-specific adaptations (groups 2 and 4).
Interestingly, there are few examples of families containing
promiscuous sequences that are representative of adapta-
tions associated with intermediate taxonomic groups of bac-
teria (for example, the proteobacteria or spirochaetes).
However, further investigations are required to determine if
this is biologically meaningful or simply an artifact associated
with the sequence clustering algorithm.
Quantifying sequence diversity within a phylogenetic
framework
Prokaryotes
Dividing the prokaryotic genomes into 13 distinct taxonomic
groupings (with reference to the National Center for Biotech-
nology Information's (NCBI) taxonomy resource [32]), com-
prehensive BLAST comparisons were used to explore
sequence diversity within a detailed evolutionary framework
(Figure 4). The combined number of taxon-specific
(sequences sharing homology only with sequences from at
least one other species in the same taxon) and species-specific
sequences varied between the 13 taxa from 15.2% (Betapro-
teobacteria) to 43.1% (Crenarchaeota) with a mean of 30.1%.
Taxa with fewer species tended to have a greater number of
species-specific sequences. Furthermore, while it might be
expected that genomes containing fewer sequences are
enriched for more highly conserved sequences (and hence
contain fewer species-specific sequences), statistically signif-
icant correlation between genome size and the number of spe-
cies-specific sequences was observed only for the bacterial
subdivisions Cyanobacteria and Others (Additional data file
6).
Within the three main proteobacterial divisions (Alphapro-
teobacteria, Betaproteobacteria and Gamma/Delta/Epsi-
lonproteobacteria) 2-3% of their sequences were common
(found in at least one species from each of the three main
divisions) and specific to proteobacteria (likely representing
core proteobacterial genes). Furthermore, a greater fraction
of Betaproteobacterial (6.8%) and Gamma/Delta/Epsi-
lonproteobacterial (4.1%) sequences shared significant simi-
larity with sequences from the other group, compared with
the Alphaproteobacteria. Even considering the different sizes
of the datasets, these results suggest a closer evolutionary
relationship between these first two groups consistent with
previous findings [28].
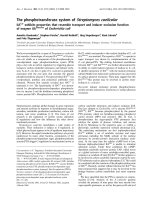
Phylogenetic profile of 74 gene families derived from 'promiscuous' sequencesFigure 3 (see following page)
Phylogenetic profile of 74 gene families derived from 'promiscuous' sequences. We identified 13,055 sequences from the complete genome datasets as
possessing significant sequence similarity to each of the 198 complete genomes. Gene family assignments obtained from the COGENT database were used
to group these promiscuous sequences into 74 gene families. Annotations associated with the gene families show the high incidence of tRNA synthetases
(blue text) and ABC transporters (red text). Phylogenetic profiles of each gene family were constructed from the presence or absence of promiscuous
sequences in each genome. Two dimensional hierarchical clustering was performed on the profiles using average linkage on the basis of their Spearman
rank correlation coefficients. Colored boxes indicate: presence of a promiscuous sequence in the genome (yellow); presence of a non-promiscuous
sequence in the genome (blue, shaded according to the number of genomes with which it shares a sequence similarity match - in cases of more than one
family member in a genome, the member with the highest number of matches was used); or absence of any family member in the genome (black box).
Although the first nine gene families (indicated by the orange bar) contain representatives from the majority of genomes, the remaining gene families
demonstrate various levels of specificity. For example, an additional 17 families (light green bars) are common to at least 50% of the eukaryotic genomes
while 25 families possessed promiscuous sequences from only a single genome (purple bar). This specificity has led to a clear grouping of genomes into the
three domains of life (as indicated on the left of the figure) with the exceptions of Cryptosporidium parvum (placed by itself outside the main group of
eukaryotes) and Plasmodium falciparum, which has been grouped with two strains of Tropheryma whipplei and Leifsonia xyli. Both species are members of the
Apicomplexa, a group of related protist parasites and appear to lack representative sequences from several of the 17 gene families that help define the
other eukaryotes as a single group.
Genome Biology 2007, Volume 8, Issue 11, Article R238 Peregrín-Álvarez and Parkinson R238.9
Genome Biology 2007, 8:R238
Figure 3 (see legend on previous page)
CPAR_TII_01
ECUN_XXX_01
ATHA_XXX_01
AGAM_PES_01
CBRI_XXX_01
CELE_XXX_01
CMER_10D_01
DMEL_XXX_02
HSAP_XXX_03
MMUS_XXX_02
KLAC_210_01
AGOS_XXX_01
DHAN_767_01
CGLA_138_01
SCER_S28_01
SPOM_XXX_01
NCRA_XX3_01
YLIP_B99_01
BFLO_XXX_01
PACN_202_01
BLON_NCC_01
CEFF_YS3_01
CDIP_129_01
CGLU_XXX_01
SAVE_XXX_01
CCAV_GPI_01
CPNE_AR3_01
CPNE_CWL_01
CPNE_J13_01
CTRA_MOP_01
CTRA_SVD_01
LPNE_LEN_01
LPNE_PHI_01
HINF_KW2_01
BAPH_XBP_01
CTEP_TLS_01
CBUR_RSA_01
XFAS_9A5_01
XFAS_XPD_01
XAXO_306_02
BBUR_B31_01
TPAL_NIC_01
BPER_251_01
PCHL_E25_01
PGIN_W83_01
TDEN_405_01
PPUT_KT2_01
PSYR_DC3_01
CCRE_XXX_01
XCAM_AT3_01
PA ER _ PA O_ 0 1
WGLO_BRE_01
BAPH_XSG_01
BBAC_100_01
BFRA_H46_01
BTHE_VPI_01
CVIO_472_01
NMEN_MC5_01
NMEN_Z24_01
BUCH_APS_01
MCAP_BAT_01
MSUC_55E_01
SONE_MR1_01
BBRO_252_01
BPAR_253_01
PLUM_TO1_01
LINT_130_01
LINT_566_01
BMAL_344_01
BPSE_243_01
ECOL_RIM_01
ECOL_MG1_01
ECOL_EDL_01
ECOL_CFT_01
YPES_CO9_01
YPES_KIM_01
YPSE_953_01
VPAR_RIM_01
VCHO_N16_01
SFLE_457_01
SFLE_301_01
SENT_CT1_02
SENT_LT2_01
SENT_TY2_01
VVUL_YJ0_01
ECAR_043_01
RSOL_XXX_01
PMUL_PM7_01
PIRE_ST1_01
NEUR_718_01
LJOH_533_01
BMEL_M16_01
BSUI_133_01
RPAL_009_01
ATUM_C58_01
TTEN_MB4_01
MMYC_G1T_01
CPER_X13_01
DRAD_XR1_01
BQUI_TOU_01
BLIC_580_01
BSUB_168_01
EFAE_V58_01
BHEN_HOU_01
LLAC_IL1_01
CACE_ATC_01
RCON_MAL_01
RPRO_MAD_01
RTYP_144_01
BANT_AME_01
BCER_579_01
BCER_987_01
LINN_CLI_01
LMON_365_01
LMON_854_01
LMON_858_01
LMON_EGD_01
OIHE_HET_01
BHAL_C12_01
SAUR_252_01
SAUR_476_01
SAUR_MU5_01
SAUR_MW2_01
SAUR_N13_01
DVUL_HIL_01
CJEJ_NCT_01
GSUL_PCA_01
SAGA_260_01
SAGA_NEM_01
MLEP_XTN_01
MPUL_UAB_01
SPYO_MGA_01
SPYO_394_01
SPYO_SF3_01
SPYO_SSI_01
SPYO_XM3_01
SYTH_863_01
DPSY_V54_01
AAEO_VF5_01
PMAR_MED_01
PMAR_SS1_01
LPLA_WCF_01
SMUT_UA1_01
SPNE_XR6_01
SPNE_TIG_01
MMOB_63K_01
MGEN_G37_01
MGAL_RLO_01
MPNE_M12_01
CTET_E88_01
FNUC_ATC_01
TTHE_B27_01
PAST_XOY_01
UURE_SV3_01
HPYL_266_01
HPYL_J99_01
MHYO_232_01
HHEP_449_01
WPIP_WME_01
WSUC_740_01
GVIO_421_01
NOST_PCC_01
TELO_BP1_01
BJAP_USD_01
PMAR_MIT_01
SYNE_PCC_01
SYCC_WH8_01
PFAL_3D7_01
LXYL_B07_01
TWHI_TW0_01
TWHI_TWI_01
MBOV_AF2_01
MTUB_CDC_01
MTUB_H37_01
NFAR_152_01
SCOE_A32_01
SMEL_102_01
MPEN_HF2_01
TMAR_MSB_01
HALO_NRC_01
NEQU_N4M_01
APER_XK1_01
MKAN_AV1_01
PAER_IM2_01
MJAN_DSM_01
MACE_C2A_01
MMAZ_GO1_01
MMAR_XS2_01
MTHE_DEL_01
AFUL_DSM_01
TACI_DSM_01
TVOL_GSS_01
PABY_GE5_01
PFUR_638_01
PHOR_OT3_01
SSOL_XP2_01
PTOR_790_01
STOK_XX7_01
Eukarya
Bacteria
Archaea
TR-000006 ABC Transporter
TR-000178 Phenylalanine-tRNA synthetase
TR-000000 ABC Transporter
TR-000038 Elongation factor G
TR-000155 Translation initiation factor
TR-000339 Valyyl-tRNA synthetase
TR-000213 Threonyl-tRNA synthetase
TR-000443 GTP Binding protein
TR-000352 Isoleucyl-tRNA synthetase
TR-000139 Glutamyl-tRNA synthetase
TR-000095 GTP Binding protein
TR-000100 Elongation factor TU
TR-000296 Aspartyl/asparaginyl-tRNA synthetase
TR-000266 Leucyl-tRNA synthetase
TR-000050 ABC Transporter
TR-000575 GTP Binding protein
TR-000692 Methionyl-tRNA synthetase
TR-000121 Histidyl-tRNA synthetase
TR-000150 Lysyl-tRNA Synthetase
TR-000310 Sulfate adenylate transferase
TR-000735 Methionyl-tRNA Synthetase
TR-000216 Aspartyl/asparaginyl-tRNA synthetase
TR-000170 50S Ribosomal L5
TR-000254 DNA polymerase III
TR-000017 AAA ATPase
TR-000742 Glutaminyl/Glutamyl-tRNA synthetase
TR-002174 Leucyl-tRNA synthetase
TR-001062 Replication Factor C
TR-001851 GTP Binding protein
TR-002042 Translation initiation factor
TR-000783 Adenylylsulfate kinase
TR-001798 ABC Transporter
TR-000224 30S ribosomal protein S7
TR-004486 ATP-ase
TR-001598 ABC Transporter
TR-002360 Elongation factor
TR-002248 ABC Transporter
TR-000705 ABC Transporter
TR-000043 ABC Transporter
TR-000328 Methionine aminopeptidase
TR-000077 RNA Polymerase
TR-003829 ABC Transporter
TR-000263 30S ribosomal protein S3
TR-002467 ABC Transporter
TR-000259 Tryptophanyl-tRNA synthetase
TR-000351 ABC Transporter
TR-004087 GTP Binding protein
TR-002081 Transposase
TR-003529 ABC Transporter
TR-001512 ABC Transporter
TR-000316 ABC Transporter
TR-052196 ABC Transporter
TR-030676 ABC Transporter
TR-054783 Elongation factor
TR-000223 Cysteinyl-tRNA synthetase
TR-002150 ABC Transporter
TR-018313 Translation factor
TR-018439 ABC Transporter
TR-000274 30S ribosomal protein S2
TR-000013 ATP-dependent RNA helicase
TR-062906 ABC transporter
TR-001532 30S ribosomal protein S13
TR-000118 Phosphoglycerate kinase
TR-000169 Seryl-tRNA synthetase
TR-063848 ABC transporter
TR-055521 Hypothetical
TR-023474 Serine (threonine) dehydratase
TR-000292 30S ribosomal protein S13
TR-000811 ATPase, AAA family
TR-012948 ABC transporter
TR-068577 ABC transporter
TR-000493 ATP-dependent DNA helicase
TR-002077 30S ribosomal protein S3
TR-001658 Prolyl-tRNA synthetase
Gene family member(s) present in the genome and
at least one is a ‘promiscuous’ sequence (possesses
significant sequence similarity to all 198 genomes.
Gene Families
Gene family member(s) present in the
genome but are non-promiscuous.
Numbers indicate the largest number
of genome matches for a single sequence.
<40
40-80
80-120
120-160
160+
Genomes
Gene family member is absent from the genome
Genome Biology 2007, 8:R238
Genome Biology 2007, Volume 8, Issue 11, Article R238 Peregrín-Álvarez and Parkinson R238.10
Within Archaea, a large fraction of sequences was found to be
common and specific to the various archaeal groups. For
example, 8.6% of sequences associated with Crenarchaeota
are specific and common across the Euryacheaota/Crenar-
chaeota lineage, while 24.3% of Nanoarchaeota genes share
sequence similarity only with other Archaea. This suggests a
common core of archaeal specific sequences and demon-
strates the divergence between archaea and bacteria.
Due to the lack of a robustly defined bacterial phylogeny,
rather than attempt to map the remaining sequences com-
mon across deeper taxonomic groups, we analyzed the occur-
rence of sequences with similarity to sequences from one or
more additional taxa (Figure 4b). The largest group of
sequences (145,647; 31% of the prokaryotic sequences ana-
lyzed in this study) was found to be common across all six
prokaryotic groups, representing either a core set of house-
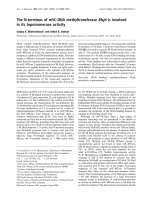
Taxonomic distribution of sequences from prokaryotesFigure 4
Taxonomic distribution of sequences from prokaryotes. (a) On the basis of its phylogenetic profile, each sequence is assigned to a single evolutionary
group within their domain. A schematic detailing the phylogenetic relationships of the defined prokaryotic groups is provided in the lower left of the figure.
For each taxonomic group the numbers represent: number of genomes analyzed (white text on black); percentage of sequences that are species-specific
(black text on white); percentage of sequences that are taxon specific - that is, share sequence similarity only with a sequence(s) from a species from the
same taxon (light gray background); and the total number of sequences. Numbers in dark gray boxes indicate the percentage of sequences with similarity
to sequence(s) from the neighboring taxon, but not to any other taxon, and may thus represent lineage specific sequences. The numbers in the blue
triangle represents the percentage of sequences from each of the three major groups of proteobacteria (alpha, beta and gamma/delta/epsilon) with
sequence similarity to each of the other proteobacterial groups). The numbers in the middle of the triangle indicate the percentage of genes from each
group (alpha, beta and gamma/delta/epsilon top to bottom) that have sequence similarity to both of the other two groups. (b) Bar chart showing the
distribution of sequences with sequence similarity to sequences from other bacterial groups, ordered by frequency. Each bar is colored by the groups
represented; for example, the first bar from the left indicates the number of sequences from spirochaetes, cyanobacteria and 'other bacterial groups' that
have significant sequence similarity to a sequence in each of the other two groups. The largest group, on the right, consists of 145,647 sequences that have
similarity to all six prokaryotic groups.
10
100
1000
10000
100000
C ommon taxonomi c groups
Number of sequences
(b)
Cyanobacteria
Spirochaetes
Other Bacterial Groups
Actinobacteria / Firmicutes
Archaea
Proteobacteria
Actinobacteria
Firmicutes
16
54315
12.1 18.8
45 8.6 18.9
108792
1.6
2.2
Deltaproteobacteria
4
13778
26.11.2
Epsilonproteobacteria
5
8619
10.7
14.1
Gammaproteobacteri a
37
132462
8.213.7
A lphaproteobacteria
13
41716
11.79.7
0.2
0.5
1.6
0.7
Cyanobacteria
8
24577
15.9 17.4
E uryarchaeota
Crenarchaeota
14
30396
15.4 15.8
4 30.8 12.3
11120
2.7
10
39249
8.27.0
B etaproteobacteria
Spirochaetes
5
13823
20.5 21.2
Other bacterial groups
17
39776
23.9 10.6
Nanoarchaeota
4.3
8.6
3.6
24.3
1 38.0 n/a
563
0.9
6.8
0.7
2.2
0.9
4.1
2.0
2.7
3.3
(a)
No. of
sequences
Taxonomic
group
% sequences common to
neighboring group
No. of
species
% sequences unique
to a speci es
% sequences specific to
taxonomic group
Other bacterial groups
Cyanobacteria
Actinobacteria
Spirochaetes
Crenarchaeota
Nanoarcheota
Alphaproteobacteria
Betaproteobacteria
Gammaproteobacteria
Euryarcheota
Firmicutes
Deltaproteobacteria
Epsilonproteobacteria
Genome Biology 2007, Volume 8, Issue 11, Article R238 Peregrín-Álvarez and Parkinson R238.11
Genome Biology 2007, 8:R238
keeping genes that have arisen through a common ancestor or
sequences that may be highly prone to LGT [18,33-35]. The
next largest category (37,700; 8%) consist of sequences that
are common to all five categories of bacteria but absent in
Archaea. These might represent common ancestral bacterial
sequences that have been lost within Archaea and are not
readily acquired by these organisms through LGT.
Eukaryotes
Due to the limited number and lack of diversity associated
with complete genomes, we chose to exploit the large number
of partial genomes to perform a similar mapping of eukaryo-
tic sequences within a phylogenetic framework. Partial
genomes were divided into 20 distinct taxa and comprehen-
sive BLAST analyses were again used to compare sequences
within a phylogenetic framework (Figure 5; see Materials and
methods for further descriptions of taxonomic groups and
their relationships). While the taxa used in this study are typ-
ical of studies of molecular evolution in eukaryotes, it should
be appreciated that there is considerable variation in the
number of species and sequences associated with each taxon.
In addition, while ideally we would like to place these analy-
Taxonomic distribution of sequences from eukaryotic partial genomesFigure 5
Taxonomic distribution of sequences from eukaryotic partial genomes. As for Figure 4a, this graphic presents the distribution of partial genome sequences
associated with 20 eukaryotic taxa. For each taxon, the three numbers in boxes represent: number of species in group (white numerals on black
background); percentage of sequences that are species-specific (that is, do not share any sequence similarity with any other species; black numerals on
white background); percentage of sequences that are group specific (that is, share sequence similarity only with one or more sequences from a species in
the same taxon (light gray background). The numbers of sequences in each group are given in blue (orange for deuterostomes). Numbers in dark gray
boxes indicate the percentage of sequences from each group that have sequence similarity to a gene from the corresponding group. Note that this figure
does not attempt to resolve the root of eukaryotes but, as for Figure 4a, has a triangular graphic to represent connections between the three major
taxonomic groups - protists, plants and fungi/metazoa. Similarly, as for Figure 4a, this graphic does not provide explicit information on relative times of
divergence and care must be taken in comparing numbers between different branches. For example, one study based on molecular clock analysis has
estimated the time of divergence of ascomycetes and basidiomycetes to range from 850 to 1,100 Mya, similar to that of protostomes and deuterostomes
(880-1,080 Mya) [37]. In this figure, the former might appear to be a relatively recent split while the latter (due to its more basal position within the tree)
might appear to be more ancient.
Ascomycota
B asi diomycota
Glomeromycota
Zygomycota
17
44358
44.3 17.9
7 40.5 4.5
2 65.9 0.9
1 53.2 n/a
14785
2432
966
3.6
6.0
0.4
3.8
0.2
8.1
Tetrapoda
10
46420
50.410.5
Teleosta
Cephalochordata
Urochordata
746.76.1
173.1n/a
261.71.3
28971
8243
5297
E chi nodermata
178.2n/a
1312
0.5
5.8
0.1
0.6
2.8
5.4
8.2
1.2
Insects
9
11600
47.03.7
Crustacea
3
4041
58.97.8
C heli cerates
4
5123
53.84.2
Tardigrades
1
1764
45.5n/a
Rhabditina
7
19690
29.911.3
T yl enchina
15
40676
29.017.5
Spirurina
7
29666
44.310.7
Dorylaimia
2
5309
49.42.1
Protists
Plants
17
43550
66.3 7.5
76 27.9 37.4
221896
L ophotrochozoa
4
10365
59.12.7
0.5
1.4
0.5
1.2
7.4
10.6
3.6
2.5
0.1
1.5
1.4
1.1
2.5
4.6
0.7
2.6
8.0
8.3
4.8
1.8
L ophotrochozoa
Deuterostomes
Fungi
Plants
Nematodes
Arthropods
3.1 4.8
7.6
2.02.1
11.6
18.2
17.9
21.1
Fungi /
Metazoa
Fungi
Protists
Metazoa
Protostomes
Deuterostomes
Genome Biology 2007, 8:R238
Genome Biology 2007, Volume 8, Issue 11, Article R238 Peregrín-Álvarez and Parkinson R238.12
ses in the context of relative times of divergence, there is a
great deal of uncertainty concerning predictions of evolution-
ary divergence events. For example, estimated divergence
times between protostomes and deuterostomes range from
570-1,100 million years (Mya) [36-39] and for chelicerates
and pancrustacea (which include insects and crustaceans)
from 540-770 Mya [36,39].
Consequently, the cladograms presented in Figures 4a and 5
do not provide explicit information on relative times of diver-
gence and caution should, therefore, be exercised in inter-
preting comparisons between the various branches.
Consistent with findings from the fully sequenced eukaryotes,
the partial genome datasets contain a larger proportion
(approximately 40-70%) of taxon- and species-specific
sequences than the prokaryotic datasets. As might be
expected, taxa with larger numbers of species contained the
highest proportion of conserved taxon-specific sequences
(that is, sequences specific to a taxon but common to > 1 spe-
cies): plants (37.4%, 76 species); ascomycetes (17.9%, 17 spe-
cies) and tylenchids (17.5%, 15 species). Comparisons
between taxa revealed several branches that contain a rela-
tively large proportion of common sequences. Within the
nematodes, for example, 10.6% of the 29,666 spirurid
sequences have similarity only to rhabditid and/or tylenchid
sequences, while reciprocally, 7.4% of the 60,366 rhabditid
and tylenchid sequences are also common only to spirurids
(the difference in percentages is likely due to the different
sizes of the respective datasets). Similarly, 6% of the 14,785
basidiomycete sequences and 3.6% of the 44,358 ascomycete
sequences are specific to basidiomycetes and ascomycetes,
while 5.4% of 46,420 tetrapod sequences and 8.2% of 28,971
teleost sequences are common and specific to tetrapods and
teleosts. These sequences potentially represent core sets of
essential nematode, fungi and vertebrate specific genes that
arose relatively early in their respective lineages.
Interestingly, despite comparable sequence and gene family
discovery rates (Table 2), the arthropod taxa displayed much
lower proportions of panarthropod core sequences than the
nematode, fungal and deuterostome lineages. For example,
only 0.5% of 11,600 insect sequences and 1.4% of 4,041 crus-
tacean sequences are specific to pancrustacea. Although this
might indicate a relatively rapid divergence of the three line-
ages after their ancestral split from the nematodes, these
findings might also be readily explained by the lower number
of available sequences associated with these taxa. Additional
sequencing within the arthropods may, therefore, increase
the number of such common sequences with a corresponding
decrease in the proportion of species and taxon-specific
sequences associated with these groups.
Many sequences are also associated with deeper taxonomic
splits within Eukarya. Of particular note, approximately 8%
of metazoan sequences are common and specific to the proto-
stomes and deuterostomes. These likely represent sequences
involved in providing basic multicellular functionality (for
example, cell-cell communication and differentiation). Addi-
tionally, 1.8% of metazoan sequences and 4.8% of fungal
sequences are common to the fungi/metazoan divide. Again,
these sequences may represent specific adaptations adopted
by the early ancestors of the opistokonts. Since the root of the
tree connecting protists, plants and fungi/metazoa has not
been well defined, we analyzed each combination separately.
Approximately 18-21% of eukaryotic sequences are common
to each of the three major eukaryotic taxonomic groups.
These sequences are expected to be involved in basic house-
keeping functions, such as DNA processing and cellular
metabolism.
Comparisons with the prokaryotic datasets revealed that
sequences furthest from the root of eukaryotes were less likely
to share similarity with a prokaryotic sequence. For example,
58.8% (60,485) of the 102,868 core eukaryotic sequences,
29.4% (1,637) of the 5,573 Fungi-Metazoa specific sequences,
and only 14.2% (2,196) of the 15,486 Metazoa specific
sequences shared similarity with a prokaryotic sequence.
Furthermore, for the majority (135 of 193) of the species-spe-
cific datasets, less than 2% of their sequences had significant
matches to a prokaryotic sequence. The incidence of a small
fraction of these sequences sharing similarity with prokaryo-
tic sequences may reflect a low incidence sequence acquisi-
tion through LGT [40].
While the use of partial genomes offers a breadth and depth
of sequence sampling unrivalled by full genomes, potential
drawbacks of these datasets have been documented
[14,17,41]. Indeed, we note that in comparing sequence length
with conservation, longer sequences tend to be more highly
conserved (Additional data file 7). However, previous reports
supporting the legitimacy of short sequences [14,41], together
with the consistency in the proportion of species-specific
sequences with the fully sequenced eukaryotic datasets, high-
lights the usefulness of sequences derived from partial
genomes as surrogates for those derived from complete
genomes.
Functional analysis of highly conserved eukaryotic
sequences
The sequence datasets reported here are provided as a com-
munity resource through interactive images available online
[27]. To demonstrate the utility of these datasets, we under-
took a functional analysis of the more highly conserved
sequences from the eukaryotic partial genome datasets
(Figure 6). Comparing the frequency of sequences with
similarity to sequences from other genomes (Figure 6a)
reveals that sequences from partial genomes display an atyp-
ical abundance ('hump') of sequences with similarities to
between 110 and 140 other partial genomes, compared with
sequences derived from the full genome datasets. Analysis of
BLAST annotations derived with reference to the non-redun-
Genome Biology 2007, Volume 8, Issue 11, Article R238 Peregrín-Álvarez and Parkinson R238.13
Genome Biology 2007, 8:R238
dant protein database revealed that this hump is associated
with an abundance of 'ribosomal' proteins (Figure 6b), indic-
ative of both their conserved nature and the large number of
such sequences produced in EST sequencing projects. The
peak at 182 genomes was associated with sequences associ-
ated with the term 'ubiquitin' while other annotations for
abundant conserved sequences in these datasets include 'his-
tone', 'cyclophilin', 'elongation factor', 'actin' and 'tubulin'
(Figure 6c). These all represent classes of genes commonly
associated with EST sequencing projects due to their high
expression levels.
Discussion
Recently there has been considerable interest in exploring the
generation and extent of genetic diversity [4,5,20]. Due to the
lack of fully sequenced genomes available for eukaryotes,
such studies have tended to focus on prokaryotes. Here we
have supplemented 198 fully sequenced genomes (19 from
eukaryotes) with 193 EST derived datasets (partial genomes)
to undertake a comprehensive global analysis of sequence
diversity. Our results indicate that eukaryotic (partial
genome) datasets tend to possess a higher proportion of
taxon- and species-specific sequences in addition to demon-
strating a higher rate of novel sequence discovery than
prokaryotes. While this reduction in diversity may be associ-
ated with biases in the choice of bacterial genomes for
sequencing (for example, due to medical and/or economical
interests), such biases could only partially account for the
observed differences. It is also interesting to note that a recent
metagenomics project, focusing on the collation of global
ocean samples and hence not subject to the same sampling
biases, reported that 14% of sequence reads obtained from a
single site were unique to that site [9,42]. Despite methodo-
logical differences, the consistency in these rates provides an
additional level of support that biases in genome sampling
have not adversely influenced our results.
A major driving force of sequence diversity is thought to
involve the duplication of genes followed by their subsequent
divergence [2,12]. The observed differences between the
bacterial and partial genome datasets may, therefore, be
driven by factors such as generation times and metabolic
rates [43]. However, another potentially important factor is
the role played by LGT and its ability to transfer new genes
(for example, created through duplication and divergence)
across species [18,33-35,44]. Recent interest in LGT events
has led to the concept of a microbial pan-genome consisting
of a global pool of genes that are continuously being
exchanged within and between prokaryotic species [45,46].
This constant exchange would obviously decrease the number
of species-specific genes relative to those species that mainly
rely on vertical transmission of genetic information (that is,
eukaryotes). Intriguingly, if LGT is a major source of gene
acquisition, the identification of 'core' sequences limited to
specific prokaryotic taxa (for example, Proteobacteria) may
indicate sets of sequences not readily transferred through
LGT. The provision of these sequence datasets will, therefore,
facilitate future studies exploring the relationship between
their sequence and/or functional properties and their restric-
tion to specific lineages.
Distribution of conservation of sequences from full and partial genomes and functional characterizationFigure 6
Distribution of conservation of sequences from full and partial genomes
and functional characterization. (a) The frequency of sequences from full
and partial genomes with significant sequence similarity to other full or
partial genomes. Most sequences are associated with only a limited
number of genomes; however, two peaks on the respective graphs
indicate that there is a large proportion of sequences from full and partial
genomes that have similarity to sequences from 198 and 185 genomes and
partial genomes, respectively. (b, c) The number of partial genome
sequences with specific BLAST annotations that are conserved across
either 50-191 (b) or 100-191 (c) other partial genomes (see Materials and
methods for more details).
0.00001
0.0001
0.001
0.01
0.1
1
10
100
0 25 50 75 100 125 150 175 200
(a)
(b)
(c)
0
200
400
600
800
1,000
1,200
1,400
50 70 90 110 130 150 170 190
'Ribosomal'
'Ubiquitin'
'Histone'
Number of Partial
Genomes
0
10
20
30
40
50
60
70
80
90
100
100 110 120 130 140 150 160 170 180 190 200
'Actin'
'Tubulin'
'E lo n ga tio n Fac tor'
'GTPase / GTP binding protein'
'Ribosylation'
'Calmod ulin / Calcium bind ing prote in'
'Kinase'
Complete Genomes
Partial Genomes
Sequence source
Number of Complete / Partial Genomes
Number of Sequences
All sequences
Sequence annotation
Frequency - % of all
sequences (log scale)
Number of Partial
Genomes
Number of Sequences
Sequence annotation
Genome Biology 2007, 8:R238
Genome Biology 2007, Volume 8, Issue 11, Article R238 Peregrín-Álvarez and Parkinson R238.14
Focusing on eukaryotes, by mapping their sequences onto a
phylogenetic framework, we identified a widely populated
spectrum of sequence specificity. At one extreme approxi-
mately 20% of eukaryotic sequences are highly conserved and
may represent ancestral eukaryotic genes under significant
selective constraints. At the other extreme, from 40-60% of
sequences are specific to individual or closely related species.
Such sequences represent genes that are either under reduced
selective constraints, provide newly acquired functionality
(that is, neo- or sub-functionalization [47]) or are simply
redundant and in the process of being lost. Between these two
extremes several regions ('landmarks') within the
phylogenetic landscape were identified as demonstrating
high levels of sequence conservation (for example, the 8% of
metazoan sequences that are specific and conserved across
protostomes and deuterostomes). In addition to ancestral
genes that may have been lost in other lineages, these
sequences represent newly evolved genes subject, as they
arise, to selective constraints restricting further diversifica-
tion. An intriguing question concerns whether these land-
marks represent 'bursts' of concerted gene innovations. For
example, sequences mediating cell adhesion or cell-cell com-
munication would promote a multi-cellular lifestyle that may
have resulted in the rapid generation of metazoan specific
sequences) [48]. As for the highly conserved sequences, sub-
sequent diversification of these sequences may be limited by
these altered constraints. Alternatively, depending upon the
relative times of divergence, these landmarks may simply
reflect extended periods of evolution allowing the continued
accumulation of sequences prior to a divergence event. For
example, the relatively high proportion of metazoan specific
sequences (8%) may simply reflect an extended period, from
the divergence of fungi from metazoan to the divergence of
protostomes and deuterostomes (which one estimate puts at
500 Mya [37]). Relative divergence times might also account
for the relatively low numbers of sequences shared across the
three major groups of arthropods. Molecular clocks estimate
the time of divergence of insects and crustacea to be approxi-
mately 650 Mya and that of panarthropods from chelicerates
as approximately 720 Mya [39]. Hence, it may not be surpris-
ing that during the 70 Mya between these two splits, only
0.5% of insect sequences and 1.4% of crustacean sequences
were generated and remain common and specific to these two
taxa (compare with the 300 Mya between the time of diver-
gence of the tetrapods and teleosts and their earlier diver-
gence from the cephalochordates [49]). On the other hand, as
noted earlier, factors such as generation time and metabolic
rates in addition to significant changes in population size
could also play a role in the observed increases in rates of
sequence innovation [43,50,51].
With current ambiguities in the timing of divergence events
[52], interpretation of these data would greatly benefit from
the availability of a fully resolved and robustly timed phylog-
eny. Conversely, these data may be usefully combined with
additional experimental and theoretical studies to unravel the
relative influence of these various factors on the generation of
sequence diversity within the Eukarya [53,54].
Conclusion
The collation and comparison of EST based datasets from 193
species provides the first detailed analysis of sequence con-
servation across Eukarya and highlights significant differ-
ences from prokaryotes. In particular, we find that eukaryotes
have a much higher incidence of novel sequences than
prokaryotes, which may be related to the lower incidence of
LGT events. Placing these sequences within a phylogenetic
framework provides a detailed map of the origins and extent
of sequence diversity. It further allows the identification of
sequences specific and conserved to distinct taxonomic
groups that are likely to be associated with novel taxon spe-
cific innovations. The provision of taxon specific sequences
should thus prove valuable for additional computational and
biochemical analyses aimed at understanding evolutionary
and functional relationships.
Materials and methods
Sequence data
The predicted protein sequences of 198 complete genomes
used in this study were obtained from the COGENT database
[31]. Sequences associated with 193 partial genomes were
obtained from the PartigeneDB database [26]. A list of all spe-
cies datasets is given in Additional data files 2 and 3. A sum-
mary of the taxonomic groups represented in this study is
shown in Table 1. Detailed taxonomic relationships of the
organisms are presented in Additional data file 1. Species
were assigned to each group on the basis of taxonomic infor-
mation derived from the NCBI TaxBrowser resource [55].
Due to ambiguity concerning the phylogenetic relationships
of bacteria [56], no attempt is made to provide an evolution-
ary perspective beyond the major bacterial groups (proteo-
bacteria, actinobacteria/firmicutes, cyanobacteria,
spirochaetes and 'other bacteria' - encompassing species that
do not fall in one of the aforementioned groups). Archaeal
relationships were inferred with reference to [57]. Eukaryotic
relationships were inferred from a number of previously pub-
lished studies as follows: while the relationships between
Fungi, Metazoa and Viridiplantae have been well established,
protests are thought to derive from several paraphyletic
groups arising at (or close to) the root of the three other major
eukaryotic groups [29]. Due to the limited number of partial
genomes from this group and to simplify analyses, the 17 pro-
tist partial genomes were collated into a single group. For
fungi (four taxonomic groups - Ascomycota, Basidiomycota,
Glomeromycota and Zygomycota), nematodes (four taxa -
Rhabditina, Tylenchina, Spirurina and Dorylaimia) and
arthropods/tardigrades (four taxa - Hexapoda, Crustacea,
Chelicerata and Tardigrada) the taxonomic divisions and
phylogenetic relationships were defined according to previ-
ous, established studies [58-60]. Deuterostomes may be
Genome Biology 2007, Volume 8, Issue 11, Article R238 Peregrín-Álvarez and Parkinson R238.15
Genome Biology 2007, 8:R238
readily categorised into five well-defined taxa - Tetrapoda,
Teleosta, Cephalochordata, Urochordata and Echinoder-
mata. However, the phylogenetic relationships of the cepha-
lochordates and urochordates with respect to the other three
groups remain unclear. For the purposes of our analyses, we
assumed relationships based on previously published studies
of ribosomal RNA analyses [61,62]. Finally, there has been
much debate concerning the grouping of the major metazoan
clades [63-65]. We have chosen to follow the scheme pro-
posed by a recent study performed by Philippe and co-work-
ers [64]. In their analysis of a large dataset of 146 genes
derived from a diverse set of 35 animals, they provide strong
support for arthropods and nematodes belonging to the pro-
tostome group Ecdysozoa. The protostomes (which also
include Lophotrochozoans such as mollusks and platy-
helminths) then form a group distinct from the deuteros-
tomes, which include the chordates and hemichordates (the
so-called Lophotrochozoa-Ecdysozoa-Deuterostomia (L-E-
D) hypothesis [66]).
BLAST analyses
Given the scale of sequence similarity searches, BLAST [67]
provides the most practical tool for performing these types of
analyses. Unlike more sensitive algorithms such as PSI-
BLAST, it is both fast and easily automated, allowing the com-
parison of the hundreds of datasets considered here. For each
sequence from each complete and partial genome, a series of
BLASTs were performed. The predicted proteomes from each
complete genome were compared to each other using
BLASTP, while sequences from partial genomes were com-
pared using TBLASTX. Raw bit scores were extracted and
stored within an in-house PostgreSQL based database [68].
This results in the creation of a phylogenetic profile [69] for
each sequence from which its relationship to various taxo-
nomic groups can be derived. Significant matches were
defined as those having a raw BLAST score of greater or equal
to 50 (equivalent to a typical E-score of about 10
-5
). Previous
studies have concluded that the choice of threshold does not
significantly affect qualitative findings in these types of anal-
yses [15,17]. We therefore chose an intermediate threshold
that minimizes erroneous matches while maximizing the pos-
sibility of identifying related sequences. A full list of species,
their taxonomic group, numbers of sequences, fraction of
species-specific sequences and fraction of sequences specific
to a limited number of taxonomic groups are provided in
Additional data files 2 and 3. For the analyses of sequence dis-
covery rates, as genomes are included in a cumulative
sequence ensemble (that is, sampled), we identify 'distinct'
sequences as those that do not possess significant sequence
similarity to sequences from genomes that have already been
sampled. A sliding window of 30 genomes was then used to
obtain the gradient of the number of distinct sequences com-
pared against the number of sequences that have been sam-
pled. Due to the use of this sliding window, for each dataset,
values were not obtained for the first 15 or last 15 genome
additions. Four hundred random orderings of genome addi-
tions were generated to derive the average and standard devi-
ation of sequence discovery rates for each dataset.
Gene family analyses
Gene family predictions for the 198 complete genome data-
sets obtained from COGENT have previously been calculated
through the use of the TribeMCL algorithm [70]. In order to
obtain the predictions for the partial genome datasets, which
consist of DNA as opposed to protein sequences, it was first
necessary to calibrate the parameters (inflation values and E-
value cutoffs) used by the TribeMCL algorithm to maintain
consistency with the COGENT analyses. We therefore
obtained the cDNA and associated peptide sequences for C.
elegans from Wormbase [71] (Wormpep version 160). After
clustering these peptide sequences by TribeMCL using simi-
lar parameters used to construct the COGENT gene family
predictions (E-value cutoff = 0.001; inflation value = 1.86), a
comprehensive scan of parameters was performed for clus-
tering the cDNA sequences. An E-value cutoff of 0.001 and an
inflation value of 1.635 were found to provide the most similar
number of gene families in the cDNA based families com-
pared with the peptide based families (11,020 versus 11,018,
respectively). These parameters were used to cluster the
546,451 partial genome sequences and derive a single set of
gene family predictions that encompass all of the partial
genomes. Gene family discovery rates were obtained as for
the sequence discovery rates - as genomes are sampled, we
identify new gene families (including singletons) as those that
do not include sequence members from genomes that have
already been sampled. Again, we used a sliding window of 30
genomes to obtain the gradient of the number of gene families
compared against the total number of sampled sequences.
Furthermore, four hundred random orderings of genome
additions were generated to derive the average and standard
deviation of gene family discovery rates for each dataset.
Functional characterization
Two sets of functional annotations were used in this study. In
the first set, broad functional characterizations were obtained
for sequences in both the complete and partial genome data-
sets with reference to the Kyoto Encyclopedia of Genes and
Genomes (KEGG) database (release 32.0; 748,177 protein
sequences from 206 genomes) [72]. All sequences were
assigned to a functional category according to the sequence in
KEGG with the highest sequence similarity (BLAST raw score
cut-off of ≥ 50). Sequences that did not have significant
sequence similarity to a protein in KEGG with a previously
assigned functional category were characterized as
'Unknown'. The second set of annotations used in this study,
providing more detail on specific gene functions, was applied
only to sequences from the partial genome datasets. In brief,
each sequence was subjected to a BLAST search against the
protein non-redundant database (2.5 million sequences). Up
to five matches with E-values < 10
-5
were extracted. Meaning-
ful annotations were then extracted from the descriptions of
Genome Biology 2007, 8:R238
Genome Biology 2007, Volume 8, Issue 11, Article R238 Peregrín-Álvarez and Parkinson R238.16
the first 'hit' that did not contain 'hypothetical', 'unknown' or
'unnamed'.
Abbreviations
CGDR, current gene family discovery rate; CSDR, current
sequence discovery rate; EST, expressed sequence tag;
KEGG, Kyoto Encyclopedia of Genes and Genomes; LGT, lat-
eral gene transfer; MCL, Markov clustering; Mya, millions of
years; NCBI, National Center for Biotechnology Information;
OGDR, overall gene family discovery rate; OSDR, overall
sequence discovery rate.
Authors' contributions
JP and JMP-A conceived and designed the experiments.
JMP-A collated sequence datasets, designed and performed
the cross-species and gene family analyses and helped draft
the manuscript. JP undertook the functional characterization
analyses, wrote the manuscript and supervised the project.
Both authors read and approved the final manuscript.
Additional data files
The following additional data are available with the online
version of this paper. Additional data file 1 is a figure showing
the phylogenetic relationships of the taxonomic groups dis-
cussed in the main text. Additional data files 2 and 3 are
tables listing the species used in the study together with a
detailed breakdown of the taxonomic relationships of their
sequences. Additional data file 4 is a figure comparing
sequence similarity relationships between members of 16
highly conserved gene families for eukaryotes and bacteria.
Additional data file 5 is a figure showing rates of sequence and
gene family discovery in different sets of complete and partial
genomes. Additional data file 6 is a figure showing the rela-
tionship between genome size and number of species-specific
sequences. Additional data file 7 is a figure showing the rela-
tionship between the sequence conservation and length.
Additional data file 1Phylogenetic relationships of the taxonomic groups discussed in the main textPhylogenetic relationships of the taxonomic groups discussed in the main text.Click here for fileAdditional data file 2Species used in the study together with a detailed breakdown of the taxonomic relationships of their sequencesSpecies used in the study together with a detailed breakdown of the taxonomic relationships of their sequences.Click here for fileAdditional data file 3Species used in the study together with a detailed breakdown of the taxonomic relationships of their sequencesSpecies used in the study together with a detailed breakdown of the taxonomic relationships of their sequences.Click here for fileAdditional data file 4Comparison of sequence similarity relationships between members of 16 highly conserved gene families for eukaryotes and bacteriaComparison of sequence similarity relationships between members of 16 highly conserved gene families for eukaryotes and bacteria.Click here for fileAdditional data file 5Rates of sequence and gene family discovery in different sets of complete and partial genomesRates of sequence and gene family discovery in different sets of complete and partial genomes.Click here for fileAdditional data file 6Relationship between genome size and number of species-specific sequencesRelationship between genome size and number of species-specific sequences.Click here for fileAdditional data file 7Relationship between sequence conservation and lengthRelationship between sequence conservation and length.Click here for file
Acknowledgements
Computational analyses were performed using facilities at the Center for
Computational Biology, Hospital for Sick Children, Toronto. This work was
funded by a grant from the Canadian Institute for Health Research (CIHR).
JMP-A is supported by the Hospital for Sick Children (Toronto, Ontario,
Canada) Research Training Centre. JP is supported by a CIHR New Inves-
tigators award. We would like to thank our colleagues, especially Mark
Blaxter, Alan Davidson, Gabriel Moreno-Hagelsieb and James Wasmuth in
addition to the two anonymous reviewers for providing many insightful
comments during the drafting of the manuscript.
References
1. Arnold FH: Fancy footwork in the sequence space shuffle. Nat
Biotechnol 2006, 24:328-330.
2. Chothia C, Gough J, Vogel C, Teichmann SA: Evolution of the pro-
tein repertoire. Science 2003, 300:1701-1703.
3. Bernal A, Ear U, Kyrpides N: Genomes OnLine Database
(GOLD): a monitor of genome projects world-wide. Nucleic
Acids Res 2001, 29:126-127.
4. Gill SR, Pop M, Deboy RT, Eckburg PB, Turnbaugh PJ, Samuel BS, Gor-
don JI, Relman DA, Fraser-Liggett CM, Nelson KE: Metagenomic
analysis of the human distal gut microbiome. Science 2006,
312:1355-1359.
5. Venter JC, Remington K, Heidelberg JF, Halpern AL, Rusch D, Eisen
JA, Wu D, Paulsen I, Nelson KE, Nelson W, et al.: Environmental
genome shotgun sequencing of the Sargasso Sea. Science
2004, 304:66-74.
6. Enright AJ, Kunin V, Ouzounis CA: Protein families and TRIBES
in genome sequence space. Nucleic Acids Res 2003, 31:4632-4638.
7. Gophna U, Doolittle WF, Charlebois RL: Weighted genome
trees: refinements and applications. J Bacteriol 2005,
187:1305-1316.
8. Zdobnov EM, von Mering C, Letunic I, Bork P: Consistency of
genome-based methods in measuring Metazoan evolution.
FEBS Lett 2005, 579:3355-3361.
9. Yooseph S, Sutton G, Rusch DB, Halpern AL, Williamson SJ, Reming-
ton K, Eisen JA, Heidelberg KB, Manning G, Li W, et al.: The Sor-
cerer II global ocean sampling expedition: expanding the
universe of protein families. PLoS Biol 2007, 5:e16.
10. Luger K, Mader AW, Richmond RK, Sargent DF, Richmond TJ: Crys-
tal structure of the nucleosome core particle at 2.8 A
resolution. Nature 1997, 389:251-260.
11. Woese C: The universal ancestor. Proc Natl Acad Sci USA 1998,
95:6854-6859.
12. Chothia C, Gerstein M: Protein evolution. How far can
sequences diverge? Nature
1997, 385:579-581.
13. Fischer D, Eisenberg D: Finding families for genomic ORFans.
Bioinformatics 1999, 15:759-762.
14. Daubin V, Ochman H: Bacterial genomes as new gene homes:
the genealogy of ORFans in E. coli. Genome Res 2004,
14:1036-1042.
15. Charlebois RL, Doolittle WF: Computing prokaryotic gene ubiq-
uity: rescuing the core from extinction. Genome Res 2004,
14:2469-2477.
16. Harris JK, Kelley ST, Spiegelman GB, Pace NR: The genetic core of
the universal ancestor. Genome Res 2003, 13:407-412.
17. Siew N, Fischer D: Analysis of singleton ORFans in fully
sequenced microbial genomes. Proteins 2003, 53:241-251.
18. Ochman H, Lerat E, Daubin V: Examining bacterial species
under the specter of gene transfer and exchange. Proc Natl
Acad Sci USA 2005, 102(Suppl 1):6595-6599.
19. Blaxter M: Opinion piece. Genome sequencing: time to widen
our horizons. Brief Funct Genomic Proteomic 2002, 1:7-9.
20. Daffonchio D, Borin S, Brusa T, Brusetti L, van der Wielen PW, Bol-
huis H, Yakimov MM, D'Auria G, Giuliano L, Marty D, et al.: Strati-
fied prokaryote network in the oxic-anoxic transition of a
deep-sea halocline. Nature 2006, 440:203-207.
21. Hughes J, Longhorn SJ, Papadopoulou A, Theodorides K, de Riva A,
Mejia-Chang M, Foster PG, Vogler AP: Dense taxonomic EST
sampling and its applications for molecular systematics of
the Coleoptera (beetles). Mol Biol Evol 2006, 23:268-278.
22. Kenyon F, Welsh M, Parkinson J, Whitton C, Blaxter ML, Knox DP:
Expressed sequence tag survey of gene expression in the
scab mite Psoroptes ovis - allergens, proteases and free-radi-
cal scavengers. Parasitology 2003, 126:451-460.
23. Mineta K, Nakazawa M, Cebria F, Ikeo K, Agata K, Gojobori T: Ori-
gin and evolutionary process of the CNS elucidated by com-
parative genomics analysis of planarian ESTs. Proc Natl Acad
Sci USA 2003, 100:7666-7671.
24. Parkinson J, Mitreva M, Whitton C, Thomson M, Daub J, Martin J,
Schmid R, Hall N, Barrell B, Waterston RH, et al.: A transcriptomic
analysis of the phylum Nematoda. Nat Genet 2004,
36:1259-1267.
25. Parkinson J, Anthony A, Wasmuth J, Schmid R, Hedley A, Blaxter M:
PartiGene - constructing partial genomes. Bioinformatics 2004,
20:1398-1404.
26. Peregrin-Alvarez JM, Yam A, Sivakumar G, Parkinson J: Parti-
GeneDB - collating partial genomes. Nucleic Acids Res
2005:D303-307.
27. Global Analysis of Sequence Diversity [psys
bio.org/GASD]
28. Kunin V, Cases I, Enright AJ, de Lorenzo V, Ouzounis CA: Myriads
of protein families, and still counting. Genome Biol 2003, 4:401.
29. Simpson AG, Roger AJ: The real 'kingdoms' of eukaryotes. Curr
Biol 2004, 14:R693-696.
30. Koonin EV: Comparative genomics, minimal gene-sets and
Genome Biology 2007, Volume 8, Issue 11, Article R238 Peregrín-Álvarez and Parkinson R238.17
Genome Biology 2007, 8:R238
the last universal common ancestor. Nat Rev Microbiol 2003,
1:127-136.
31. Janssen P, Enright AJ, Audit B, Cases I, Goldovsky L, Harte N, Kunin
V, Ouzounis CA: COmplete GENome Tracking (COGENT): a
flexible data environment for computational genomics. Bio-
informatics 2003, 19:1451-1452.
32. The NCBI Taxonomy Homepage [ />Taxonomy/taxonomyhome.html/]
33. Comas I, Moya A, Azad RK, Lawrence JG, Gonzalez-Candelas F: The
evolutionary origin of Xanthomonadales genomes and the
nature of the horizontal gene transfer process. Mol Biol Evol
2006, 23:2049-2057.
34. Ochman H, Lawrence JG, Groisman EA: Lateral gene transfer and
the nature of bacterial innovation. Nature 2000, 405:299-304.
35. Zhaxybayeva O, Gogarten JP, Charlebois RL, Doolittle WF, Papke RT:
Phylogenetic analyses of cyanobacterial genomes: quantifi-
cation of horizontal gene transfer events. Genome Res 2006,
16:1099-1108.
36. Douzery EJ, Snell EA, Bapteste E, Delsuc F, Philippe H: The timing
of eukaryotic evolution: does a relaxed molecular clock
reconcile proteins and fossils? Proc Natl Acad Sci USA 2004,
101:15386-15391.
37. Hedges SB, Blair JE, Venturi ML, Shoe JL: A molecular timescale of
eukaryote evolution and the rise of complex multicellular
life. BMC Evol Biol 2004, 4:2.
38. Peterson KJ, Lyons JB, Nowak KS, Takacs CM, Wargo MJ, McPeek
MA: Estimating metazoan divergence times with a molecular
clock. Proc Natl Acad Sci USA 2004, 101:6536-6541.
39. Pisani D, Poling LL, Lyons-Weiler M, Hedges SB: The colonization
of land by animals: molecular phylogeny and divergence
times among arthropods. BMC Biol 2004, 2:1.
40. Andersson JO: Lateral gene transfer in eukaryotes. Cell Mol Life
Sci 2005, 62:1182-1197.
41. Brocchieri L, Karlin S: Protein length in eukaryotic and prokary-
otic proteomes. Nucleic Acids Res 2005, 33:3390-3400.
42. Rusch DB, Halpern AL, Sutton G, Heidelberg KB, Williamson S,
Yooseph S, Wu D, Eisen JA, Hoffman JM, Remington K, et al.: The
Sorcerer II global ocean sampling expedition: Northwest
Atlantic through eastern tropical Pacific. PLoS Biol 2007, 5:e77.
43. Martin AP, Palumbi SR: Body size, metabolic rate, generation
time, and the molecular clock. Proc Natl Acad Sci USA 1993,
90:4087-4091.
44. Marri PR, Hao W, Golding GB: The role of laterally transferred
genes in adaptive evolution. BMC Evol Biol 2007, 7(Suppl 1):S8.
45. Medini D, Donati C, Tettelin H, Masignani V, Rappuoli R: The micro-
bial pan-genome. Curr Opin Genet Dev 2005, 15:589-594.
46. Tettelin H, Masignani V, Cieslewicz MJ, Donati C, Medini D, Ward
NL, Angiuoli SV, Crabtree J, Jones AL, Durkin AS, et al.: Genome
analysis of multiple pathogenic isolates of Streptococcus aga-
lactiae : implications for the microbial "pan-genome". Proc
Natl Acad Sci USA 2005, 102:13950-13955.
47. He X, Zhang J: Rapid subfunctionalization accompanied by
prolonged and substantial neofunctionalization in duplicate
gene evolution. Genetics 2005, 169:1157-1164.
48. Moran NA, Plague GR: Genomic changes following host restric-
tion in bacteria. Curr Opin Genet Dev 2004, 14:627-633.
49. Blair Hedges S, Kumar S: Genomic clocks and evolutionary
timescales. Trends Genet 2003, 19:200-206.
50. Chao L, Carr D: The molecular clock and the relationship
between population size and generation time.
Evolution 1993,
47:688-690.
51. Laird CD, McConaughy BL, McCarthy BJ: Rate of fixation of
nucleotide substitutions in evolution. Nature 1969,
224:149-154.
52. Jermiin LS, Poladian L, Charleston MA: Evolution. Is the "Big
Bang" in animal evolution real? Science 2005, 310:1910-1911.
53. Fraser C, Hanage WP, Spratt BG: Recombination and the nature
of bacterial speciation. Science 2007, 315:476-480.
54. Gillooly JF, Allen AP, West GB, Brown JH: The rate of DNA evo-
lution: Effects of body size and temperature on the molecu-
lar clock. Proc Natl Acad Sci USA 2005, 102:140-145.
55. Wheeler DL, Church DM, Federhen S, Lash AE, Madden TL, Pontius
JU, Schuler GD, Schriml LM, Sequeira E, Tatusova TA, et al.: Data-
base resources of the National Center for Biotechnology.
Nucleic Acids Res 2003, 31:28-33.
56. Bapteste E, Boucher Y, Leigh J, Doolittle WF: Phylogenetic recon-
struction and lateral gene transfer. Trends Microbiol 2004,
12:406-411.
57. Allers T, Mevarech M: Archaeal genetics - the third way. Nat Rev
Genet 2005, 6:58-73.
58. Blaxter ML, De Ley P, Garey JR, Liu LX, Scheldeman P, Vierstraete A,
Vanfleteren JR, Mackey LY, Dorris M, Frisse LM, et al.: A molecular
evolutionary framework for the phylum Nematoda. Nature
1998, 392:71-75.
59. James TY, Kauff F, Schoch CL, Matheny PB, Hofstetter V, Cox CJ,
Celio G, Gueidan C, Fraker E, Miadlikowska J, et al.: Reconstructing
the early evolution of fungi using a six-gene phylogeny.
Nature 2006, 443:818-822.
60. Regier JC, Shultz JW, Kambic RE: Pancrustacean phylogeny:
hexapods are terrestrial crustaceans and maxillopods are
not monophyletic. Proc Biol Sci 2005, 272:395-401.
61. Cameron CB, Garey JR, Swalla BJ: Evolution of the chordate body
plan: new insights from phylogenetic analyses of deuteros-
tome phyla. Proc Natl Acad Sci USA 2000, 97:4469-4474.
62. Winchell CJ, Sullivan J, Cameron CB, Swalla BJ, Mallatt J: Evaluating
hypotheses of deuterostome phylogeny and chordate evolu-
tion with new LSU and SSU ribosomal DNA data. Mol Biol Evol
2002, 19:762-776.
63. Aguinaldo AM, Turbeville JM, Linford LS, Rivera MC, Garey JR, Raff
RA, Lake JA: Evidence for a clade of nematodes, arthropods
and other moulting animals. Nature 1997, 387:489-493.
64. Philippe H, Lartillot N, Brinkmann H: Multigene analyses of bilat-
erian animals corroborate the monophyly of Ecdysozoa,
Lophotrochozoa, and Protostomia. Mol Biol Evol 2005,
22:1246-1253.
65. Wolf YI, Rogozin IB, Koonin EV: Coelomata and not Ecdysozoa:
evidence from genome-wide phylogenetic analysis. Genome
Res 2004, 14:29-36.
66. Jones M, Blaxter M: Evolutionary biology: animal roots and
shoots. Nature 2005, 434:1076-1077.
67. Altschul SF, Madden TL, Schaffer AA, Zhang J, Zhang Z, Miller W, Lip-
man DJ: Gapped BLAST and PSI-BLAST: a new generation of
protein database search programs. Nucleic Acids Res 1997,
25:3389-3402.
68. PostgreSQL []
69. Pellegrini M, Marcotte EM, Thompson MJ, Eisenberg D, Yeates TO:
Assigning protein functions by comparative genome analy-
sis: protein phylogenetic profiles. Proc Natl Acad Sci USA 1999,
96:4285-4288.
70. Enright AJ, Van Dongen S, Ouzounis CA: An efficient algorithm
for large-scale detection of protein families. Nucleic Acids Res
2002, 30:1575-1584.
71. Chen N, Harris TW, Antoshechkin I, Bastiani C, Bieri T, Blasiar D,
Bradnam K, Canaran P, Chan J, Chen CK, et al.: WormBase: a
comprehensive data resource for Caenorhabditis biology and
genomics. Nucleic Acids Res 2005:D383-389.
72. Kanehisa M, Goto S:
KEGG: kyoto encyclopedia of genes and
genomes. Nucleic Acids Res 2000, 28:27-30.