Báo cáo y học: "Genome-wide expression profiling and bioinformatics analysis of diurnally regulated genes in the mouse prefrontal cortex" pps
Bạn đang xem bản rút gọn của tài liệu. Xem và tải ngay bản đầy đủ của tài liệu tại đây (2.05 MB, 15 trang )
Genome Biology 2007, 8:R247
Open Access
2007Yanget al.Volume 8, Issue 11, Article R247
Research
Genome-wide expression profiling and bioinformatics analysis of
diurnally regulated genes in the mouse prefrontal cortex
Shuzhang Yang
¤
, Kai Wang
¤
, Otto Valladares, Sridhar Hannenhalli and
Maja Bucan
Address: Department of Genetics and Penn Center for Bioinformatics, University of Pennsylvania, Philadelphia, PA 19104, USA.
¤ These authors contributed equally to this work.
Correspondence: Maja Bucan. Email:
© 2007 Yang et al.; licensee BioMed Central Ltd.
This is an open access article distributed under the terms of the Creative Commons Attribution License ( which
permits unrestricted use, distribution, and reproduction in any medium, provided the original work is properly cited.
Diurnally regulated gene expression<p>Microarray analysis shows that approximately 10% of transcripts in the mouse prefrontal cortex have diurnally regulated expression patterns.</p>
Abstract
Background: The prefrontal cortex is important in regulating sleep and mood. Diurnally regulated
genes in the prefrontal cortex may be controlled by the circadian system, by sleep:wake states, or
by cellular metabolism or environmental responses. Bioinformatics analysis of these genes will
provide insights into a wide-range of pathways that are involved in the pathophysiology of sleep
disorders and psychiatric disorders with sleep disturbances.
Results: We examined gene expression in the mouse prefrontal cortex at four time points during
a 24 hour (12 hour light:12 hour dark) cycle using microarrays, and identified 3,890 transcripts
corresponding to 2,927 genes with diurnally regulated expression patterns. We show that 16% of
the genes identified in our study are orthologs of identified clock, clock controlled or sleep/
wakefulness induced genes in the mouse liver and suprachiasmatic nucleus, rat cortex and
cerebellum, or Drosophila head. The diurnal expression patterns were confirmed for 16 out of 18
genes in an independent set of RNA samples. The diurnal genes fall into eight temporal categories
with distinct functional attributes, as assessed by Gene Ontology classification and analysis of
enriched transcription factor binding sites.
Conclusion: Our analysis demonstrates that approximately 10% of transcripts have diurnally
regulated expression patterns in the mouse prefrontal cortex. Functional annotation of these genes
will be important for the selection of candidate genes for behavioral mutants in the mouse and for
genetic studies of disorders associated with anomalies in the sleep:wake cycle and circadian rhythm.
Background
The prefrontal cortex is a brain region important for executive
functions, including self-observation, planning, prioritizing
and decision-making, which are, in turn, based upon more
basic cognitive functions, such as attention, working memory,
temporal memory and behavioral inhibition [1,2]. The pre-
frontal cortex is involved in emotional regulation [3] and it
also mediates normal sleep physiology, dreaming and sleep-
deprivation phenomena. Previous studies show that the pre-
frontal cortex is particularly sensitive to the negative effects of
Published: 20 November 2007
Genome Biology 2007, 8:R247 (doi:10.1186/gb-2007-8-11-r247)
Received: 6 July 2007
Revised: 5 October 2007
Accepted: 20 November 2007
The electronic version of this article is the complete one and can be
found online at />Genome Biology 2007, 8:R247
Genome Biology 2007, Volume 8, Issue 11, Article R247 Yang et al. R247.2
sleep deprivation, and it benefits the most from sleep [4,5]. In
addition, alterations in prefrontal cortex and its connections
to other brain regions have been associated with psychiatric
disorders (reviewed in [6-8]), including schizophrenia [9],
bipolar disorder [10], and attention-deficit/hyperactivity dis-
order [11].
The pathophysiology of psychiatric and neurodevelopmental
disorders, including depression, bipolar disorder, schizo-
phrenia and autism, has been reported to involve distur-
bances in the sleep:wake cycle and circadian rhythm [12-15].
Both the sleep:wake cycle and circadian rhythms are accom-
panied by diurnally regulated gene expression - the gene
expression levels change daily according to the time of a day.
Genome-wide microarray analysis has been used to identify
genes with cyclic expression patterns at different circadian
time points in the mouse suprachiasmatic nucleus (SCN) and
liver using Affymetrix U74A arrays that contain about 10,000
known genes and expressed sequence tags [16] as well as in
other mouse tissues, including heart [17] and aorta [18], or in
fly heads [19-24]. In addition, sleep/wakefulness regulated
genes were studied in the whole cortex, cerebellum, basal
forebrain, and hypothalamus in the rat [25,26] and the mouse
[27], and in fly heads [24,28,29]. However, these studies
assayed only limited numbers of genes, and were focused on
either circadian genes (under constant darkness) or tissues
other than the prefrontal cortex. Therefore, genome-wide
analysis of genes with diurnally regulated expression patterns
in the prefrontal cortex will shed light on the function of pre-
frontal cortex and provide candidate genes for genetic studies
of sleep and psychiatric disorders.
In this study, we performed a genome-wide survey of genes
with diurnally regulated expression patterns in the mouse
prefrontal cortex, a brain region that has not been extensively
studied before. In contrast to previous genome-wide studies,
which focused on either circadian or homeostatic sleep regu-
lation, our aim was to identify, on a large scale, genes with
diurnal rhythms regardless of the controlling mechanisms.
We profiled the gene expression levels at four Zeitgeber time
(ZT) points during a single day under regular sleep/wakeful-
ness and light:dark cycles, which will capture most diurnally
regulated genes that may have different phases. (Thus, in our
study, the term 'diurnal' refers to the presence of a day:night
cycle rather than being an antonym of 'nocturnal'). We used
Affymetrix Mouse430_v2 microarrays, which represent the
most extensive mouse gene expression array to date. A total of
2,927 genes were identified as diurnally regulated in the
mouse prefrontal cortex, and 2,458 (84%) of them have not
been reported before as circadian genes or sleep/wakefulness
regulated genes in other tissues and other organisms. Bioin-
formatics analysis on the diurnal genes revealed eight tempo-
ral clusters, each with distinct patterns of expression
variation. Each cluster of the genes was associated with spe-
cific biological function and was under similar transcriptional
regulation.
Results
Identification of diurnally regulated genes in the mouse
prefrontal cortex
C57BL/6J mice were entrained to a 12 hour light and 12 hour
dark cycle (LD 12:12) for two weeks. We collected tissue sam-
ples at four time points, 3 and 9 hours after lights on (ZT3 and
ZT9) and 3 and 9 hours after lights off (ZT15 and ZT21), to
gain higher resolution temporal patterns of expression and to
capture genes whose expression phases would result in simi-
lar levels at two time points. To identify genes with diurnally
regulated expression levels, RNA samples from the prefrontal
cortex of three mice at each ZT point were used for the prep-
aration of cDNA for microarray expression profiling. We
expected that examination of gene expression at four time
points during the 24 hour light:dark cycle would permit iden-
tification of genes regulated by the circadian clock, those con-
trolled by the sleep:wake states, and those induced or
suppressed by a wide range of metabolic and environmental
conditions. By probing the Affymetrix high-density chip (the
Mouse430_v2 array) with approximately 45,000 probe sets,
we identified 3,890 probe sets representing 2,927 unique
Ensembl genes with diurnally regulated expression levels in
the prefrontal cortex at a false discovery rate (FDR) threshold
of 20%. We used a relatively liberal FDR threshold because
we aimed at identifying a highly comprehensive list of diurnal
genes at the cost of decreased specificity. These genes are dis-
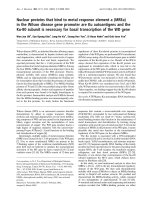
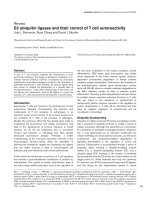
tributed throughout the mouse genome (Figure 1), and sev-
eral regions in chromosomes 7, 17 and 19 are especially
enriched with diurnally regulated genes.
Validation of diurnally regulated genes by real-time
PCR
To experimentally validate the diurnal expression patterns,
we examined the mRNA levels of 18 genes identified in our
microarray experiment in independent sets of prefrontal cor-
tex samples (mice) at 4 ZT points by real-time quantitative
PCR (Q-PCR). With a motivation to identify candidate genes
for neuropsychiatric disorders with sleep anomalies, we
selected 12 genes based on the proximity of their human
orthologs to previously reported linkage peaks for neuropsy-
chiatric disorders [30,31]. These genes, including Cacng2,
Dnajc3, Dusp4, Gpc6, Mbp, Nov, Phf21b, Atxn10, Xbp1,
Zfyve28, Rasd2, and Sult4a1, have not been reported to have
cycling expression patterns. Several other genes, including
Camk1g, Ier5, Sbk1, Pdia6, Bmal1 (Arntl) and Per2, were
added for additional validation, with Bmal1 and Per2 serving
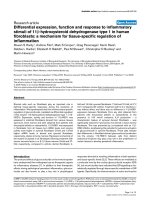
as positive controls. Of these 18 genes in validation experi-
ments, 16 showed similar or identical patterns to those
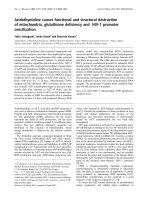
detected with the microarray experiments (Figure 2), while
Rasd2 and Sult4a1 did not show cycling expression in the Q-
PCR experiment (data not shown). Therefore, despite the lib-
eral FDR threshold of 20% in our analysis, we still validated
89% of the diurnal genes that were identified by the micro-
array experiments. Subtle discrepancies in the expression
patterns of several genes between the microarray and Q-PCR
results could be due to differences in the oligonucleotide
Genome Biology 2007, Volume 8, Issue 11, Article R247 Yang et al. R247.3
Genome Biology 2007, 8:R247
probes on the microarray and the probes used in the Q-PCR
experiments.
Comparison with previously identified cycling genes
and sleep/wakefulness related genes
To further validate our data, we compared our list of diurnal
genes with a large number of previously described circadian
regulated genes and sleep/wakefulness related genes. We
queried the Ensembl-Compara database with genes identified
in our experiment and genome-wide surveys of cycling genes
in the mouse, rat and Drosophila. The Ensembl-Compara
multi-species database stores the results of genome-wide spe-
cies comparisons, including ortholog prediction, paralog pre-
diction, whole genome alignments and synteny regions [32].
Although in many cases clear orthologous relationships can
not be confidently established, for the 2,927 diurnal genes in
the mouse prefrontal cortex, we identified 2,694 human
orthologs, 2,810 rat orthologs, and 1,834 Drosophila
orthologs. Several known core clock genes, such as aryl
hydrocarbon receptor nuclear translocator-like (Arntl or
Bmal1), period homolog 1 (Per1), period homolog 2 (Per2),
cryptochrome 1 (Cry1), cryptochrome 2 (Cry2), basic helix-
loop-helix domain containing, class B2 (Bhlhb2 or Dec1), and
genes under circadian control, such as D site albumin pro-
moter binding protein (Dbp) and homer homolog 1
(Homer1), show diurnal expression in our dataset (Additional
data file 1). When we sorted the 2,927 diurnal genes by their
FDR q-values (these values represent the significance of
expression fluctuation), all of the above genes, except Arntl
and Per1, ranked among the top 522 transcripts, indicating
that they encode the most diurnally variable transcripts in the
prefrontal cortex. The top 10 genes in this ranking list are heat
shock 70 kDa protein 5 (Hspa5), myelin basic protein (Mbp),
calcium/calmodulin-dependent protein kinase IG (Camk1g),
Per2, Dbp, splicing factor proline/glutamine rich (Sfpq),
oxysterol binding protein-like 3 (Osbpl3), RanBP-type and
C3HC4-type zinc finger containing 1 (Rbck1), myeloid/lym-
phoid or mixed-lineage leukemia 1 (Mll1) and Rho family
GTPase 2 (Rnd2). Among the top ten genes, two (Per2 and
Dbp) are well known circadian genes, four (Hspa5, Rbck1,
Mll, and Rnd2) have been shown to cycle in mouse SCN and/
or other mouse tissues, such as liver, aorta, and kidney [16]
(also see their circadian expression patterns in GNF Database
of Circadian Gene Expression [33]), Hspa5 has been reported
as sleep-regulated in rat [25], Sfpq has been reported as
sleep-regulated in fly [29], and two genes (Camk1g, Mbp)
were validated in our Q-PCR experiments above.
A karyotype map showing the chromosome positions and frequencies of diurnally regulated genes in the mouse genomeFigure 1
A karyotype map showing the chromosome positions and frequencies of diurnally regulated genes in the mouse genome. Although these genes are
scattered around the genome, several regions in chromosomes 7, 17 and 19 show especially high density of diurnally regulated genes.
Genome Biology 2007, 8:R247
Genome Biology 2007, Volume 8, Issue 11, Article R247 Yang et al. R247.4
Figure 2 (see legend on next page)
Arntl
0.4
0.6
0.8
1.0
1.2
1.4
1425099_a_at
0.4
0.5
0.6
0.7
0.8
0.9
1.0
1.1
ZT3 ZT9 ZT15 ZT21
0.4
0.6
0.8
1.0
1.2
1.4
ZT3 ZT9 ZT15 ZT21
Camk1g
0.4
0.6
0.8
1.0
1.2
1.4
1.6
1.8
2.0
1424633_at
0.4
0.6
0.8
1.0
1.2
1.4
1.6
1.8
2.0
ZT3 ZT9 ZT15 ZT21
Per2
1417602_at
1417603_at
0.0
0.5
1.0
1.5
2.0
2.5
3.0
Microarray
Q-PCR
mRNA level
Normalized intensity
ZT3 ZT9 ZT15 ZT21
Cacng2
0.4
0.6
0.8
1.0
1.2
1.4
1420596_at
0.4
0.6
0.8
1.0
1.2
1.4
Arntl
0.4
0.6
0.8
1.0
1.2
1.4
1425099_a_at
0.4
0.5
0.6
0.7
0.8
0.9
1.0
1.1
ZT3 ZT9 ZT15 ZT21
Arntl
0.4
0.6
0.8
1.0
1.2
1.4
1425099_a_at1425099_a_at1425099_a_at
0.4
0.5
0.6
0.7
0.8
0.9
1.0
1.1
ZT3 ZT9 ZT15 ZT21
0.4
0.6
0.8
1.0
1.2
1.4
ZT3 ZT9 ZT15 ZT21
Camk1g
0.4
0.6
0.8
1.0
1.2
1.4
1.6
1.8
2.0
1424633_at
0.4
0.6
0.8
1.0
1.2
1.4
ZT3 ZT9 ZT15 ZT21
Camk1g
0.4
0.6
0.8
1.0
1.2
1.4
1.6
1.8
2.0
1424633_at1424633_at1424633_at
0.4
0.6
0.8
1.0
1.2
1.4
1.6
1.8
2.0
ZT3 ZT9 ZT15 ZT21
Per2
1417602_at
1417603_at
0.0
0.5
1.0
1.5
2.0
2.5
3.0
0.4
0.6
0.8
1.0
1.2
1.4
1.6
1.8
2.0
ZT3 ZT9 ZT15 ZT21
Per2
1417602_at
1417603_at
1417602_at
1417603_at
0.0
0.5
1.0
1.5
2.0
2.5
3.0
Microarray
Q-PCR
mRNA level
Normalized intensity
ZT3 ZT9 ZT15 ZT21
Cacng2
0.4
0.6
0.8
1.0
1.2
1.4
1420596_at
0.4
0.6
0.8
1.0
1.2
1.4
ZT3 ZT9 ZT15 ZT21
Cacng2
0.4
0.6
0.8
1.0
1.2
1.4
1420596_at1420596_at
0.4
0.6
0.8
1.0
1.2
1.4
0.4
0.6
0.8
1.0
1.2
ZT3 ZT9 ZT15 ZT21
Dnajc3
0.4
0.6
0.8
1.0
1.2
1.4
1.6
1.8
1449372_at
1419163_s_at
1449373_at
0.4
0.6
0.8
1.0
1.2
1.4
1.6
1.8
ZT3 ZT9 ZT15 ZT21
Dusp4
0.4
1.4
2.4
3.4
1428834_at
0.4
0.6
0.8
1.0
1.2
1.4
ZT3 ZT9 ZT15 ZT21
Gpc6
0.4
0.6
0.8
1.0
1.2
1.4
1.6
1437417_s_at
1428774_at
0.4
0.6
0.8
1.0
1.2
1.4
1.6
1.8
ZT3 ZT9 ZT15 ZT21
Ier5
0.4
0.8
1.2
1.6
2.0
1417613_at
1417612_at
1460009_at
Microarray
Q-PCR
mRNA level
Normalized intensity
0.4
0.6
0.8
1.0
1.2
ZT3 ZT9 ZT15 ZT21
Dnajc3
0.4
0.6
0.8
1.0
1.2
1.4
1.6
1.8
1449372_at
1419163_s_at
1449373_at
0.4
0.6
0.8
1.0
1.2
ZT3 ZT9 ZT15 ZT21
Dnajc3
0.4
0.6
0.8
1.0
1.2
1.4
1.6
1.8
1449372_at
1419163_s_at
1449373_at
1449372_at
1419163_s_at
1449373_at
0.4
0.6
0.8
1.0
1.2
1.4
1.6
1.8
ZT3 ZT9 ZT15 ZT21
Dusp4
0.4
1.4
2.4
3.4
1428834_at
0.4
0.6
0.8
1.0
1.2
1.4
1.6
1.8
ZT3 ZT9 ZT15 ZT21
Dusp4
0.4
1.4
2.4
3.4
1428834_at1428834_at
0.4
0.6
0.8
1.0
1.2
1.4
ZT3 ZT9 ZT15 ZT21
Gpc6
0.4
0.6
0.8
1.0
1.2
1.4
1.6
1437417_s_at
1428774_at
0.4
0.6
0.8
1.0
1.2
1.4
ZT3 ZT9 ZT15 ZT21
Gpc6
0.4
0.6
0.8
1.0
1.2
1.4
1.6
1437417_s_at
1428774_at
1437417_s_at
1428774_at
0.4
0.6
0.8
1.0
1.2
1.4
1.6
1.8
ZT3 ZT9 ZT15 ZT21
Ier5
0.4
0.8
1.2
1.6
2.0
1417613_at
1417612_at
1460009_at
0.4
0.6
0.8
1.0
1.2
1.4
1.6
1.8
ZT3 ZT9 ZT15 ZT21
Ier5
0.4
0.8
1.2
1.6
2.0
1417613_at
1417612_at
1460009_at
1417613_at
1417612_at
1460009_at
Microarray
Q-PCR
mRNA level
Normalized intensity
Microarray
Q-PCR
mRNA level
Normalized intensity
0.4
0.6
0.8
1.0
1.2
1.4
ZT3 ZT9 ZT15 ZT21
Sbk1
0.4
0.6
0.8
1.0
1.2
1.4
1.6
1.8
1451190_a_at
1423978_at
0.4
0.6
0.8
1.0
1.2
1.4
ZT3 ZT9 ZT15 ZT21
Mbp
0.4
0.6
0.8
1.0
1.2
1.4
1.6
1425264_s_at
1425263_a_at
0.4
0.8
1.2
1.6
2.0
ZT3 ZT9 ZT15 ZT21
Nov
0.4
0.8
1.2
1.6
2.0
1426851_a_at
0.4
0.6
0.8
1.0
1.2
ZT3 ZT9 ZT15 ZT21
Phf21b
0.4
0.8
1.2
1.6
2.0
1454999_at
Microarray
Q-PCR
mRNA level
Normalized intensity
0.4
0.6
0.8
1.0
1.2
1.4
ZT3 ZT9 ZT15 ZT21
Sbk1
0.4
0.6
0.8
1.0
1.2
1.4
1.6
1.8
1451190_a_at
1423978_at
0.4
0.6
0.8
1.0
1.2
1.4
ZT3 ZT9 ZT15 ZT21
Sbk1
0.4
0.6
0.8
1.0
1.2
1.4
1.6
1.8
1451190_a_at
1423978_at
1451190_a_at
1423978_at
0.4
0.6
0.8
1.0
1.2
1.4
ZT3 ZT9 ZT15 ZT21
Mbp
0.4
0.6
0.8
1.0
1.2
1.4
1.6
1425264_s_at
1425263_a_at
0.4
0.6
0.8
1.0
1.2
1.4
ZT3 ZT9 ZT15 ZT21
Mbp
0.4
0.6
0.8
1.0
1.2
1.4
1.6
1425264_s_at
1425263_a_at
1425264_s_at
1425263_a_at
0.4
0.8
1.2
1.6
2.0
ZT3 ZT9 ZT15 ZT21
Nov
0.4
0.8
1.2
1.6
2.0
1426851_a_at
0.4
0.8
1.2
1.6
2.0
ZT3 ZT9 ZT15 ZT21
Nov
0.4
0.8
1.2
1.6
2.0
1426851_a_at1426851_a_at
0.4
0.6
0.8
1.0
1.2
ZT3 ZT9 ZT15 ZT21
Phf21b
0.4
0.8
1.2
1.6
2.0
1454999_at
0.4
0.6
0.8
1.0
1.2
ZT3 ZT9 ZT15 ZT21
Phf21b
0.4
0.8
1.2
1.6
2.0
1454999_at1454999_at
0.4
0.6
0.8
1.0
1.2
1.4
ZT3 ZT9 ZT15 ZT21
Atxn10
0.4
0.6
0.8
1.0
1.2
1.4
1422576_at
0.4
0.6
0.8
1.0
1.2
1.4
ZT3 ZT9 ZT15 ZT21
Pdia6
0.4
0.6
0.8
1.0
1.2
1.4
1.6
1.8
1423648_at
0.4
0.6
0.8
1.0
1.2
1.4
1.6
ZT3 ZT9 ZT15 ZT21
Xbp1
0.4
0.6
0.8
1.0
1.2
1.4
1.6
1.8
1420011_s_at
1420886_a_at
1437223_s_at
0.4
0.6
0.8
1.0
1.2
1.4
1.6
1.8
ZT3 ZT9 ZT15 ZT21
Zfyve28
0.4
0.6
0.8
1.0
1.2
1434504_at
MicroarrayQ-PCR
mRNA level
Normalized intensity
0.4
0.6
0.8
1.0
1.2
1.4
ZT3 ZT9 ZT15 ZT21
Atxn10
0.4
0.6
0.8
1.0
1.2
1.4
1422576_at
0.4
0.6
0.8
1.0
1.2
1.4
ZT3 ZT9 ZT15 ZT21
Atxn10
0.4
0.6
0.8
1.0
1.2
1.4
1422576_at1422576_at
0.4
0.6
0.8
1.0
1.2
1.4
ZT3 ZT9 ZT15 ZT21
Pdia6
0.4
0.6
0.8
1.0
1.2
1.4
1.6
1.8
1423648_at
0.4
0.6
0.8
1.0
1.2
1.4
ZT3 ZT9 ZT15 ZT21
Pdia6
0.4
0.6
0.8
1.0
1.2
1.4
1.6
1.8
1423648_at1423648_at
0.4
0.6
0.8
1.0
1.2
1.4
1.6
ZT3 ZT9 ZT15 ZT21
Xbp1
0.4
0.6
0.8
1.0
1.2
1.4
1.6
1.8
1420011_s_at
1420886_a_at
1437223_s_at
0.4
0.6
0.8
1.0
1.2
1.4
1.6
ZT3 ZT9 ZT15 ZT21
Xbp1
0.4
0.6
0.8
1.0
1.2
1.4
1.6
1.8
1420011_s_at
1420886_a_at
1437223_s_at
1420011_s_at
1420886_a_at
1437223_s_at
0.4
0.6
0.8
1.0
1.2
1.4
1.6
1.8
ZT3 ZT9 ZT15 ZT21
Zfyve28
0.4
0.6
0.8
1.0
1.2
1434504_at
0.4
0.6
0.8
1.0
1.2
1.4
1.6
1.8
ZT3 ZT9 ZT15 ZT21
Zfyve28
0.4
0.6
0.8
1.0
1.2
1434504_at1434504_at
MicroarrayQ-PCR
mRNA level
Normalized intensity
Genome Biology 2007, Volume 8, Issue 11, Article R247 Yang et al. R247.5
Genome Biology 2007, 8:R247
A published survey of 7,000 known genes and 3,000
expressed sequence tags identified approximately 650 cycling
transcripts in the mouse liver and SCN [16]. By querying the
probe set identifiers against the Ensembl database, we were
able to retrieve 759 mouse genes, as well as 608 human, 696
rat and 447 Drosophila orthologs, respectively (Table 1). We
found 94 common genes in the mouse prefrontal cortex and
liver, and 90 common genes in the mouse prefrontal cortex
and SCN.
To examine the representation of sleep- and wakefulness-
induced genes among 2,927 diurnal genes in the prefrontal
cortex, we integrated previously published data by assigning
Ensembl identifiers to genes from these studies. For example,
by probing 24,000 rat genes and expressed sequence tags
(the rat RGU34A arrays), 752 (4.9%) of the transcripts in the
whole cortex and 223 (4.8%) of the transcripts in the cerebel-
lum were identified as regulated by sleep/wakefulness inde-
pendent of time of day by Cirelli et al. [25]. We searched their
probe set identifiers against the Ensembl database, and iden-
tified 1,053 rat genes as well as 920 human, 962 mouse and
689 Drosophila orthologs (Table 1). By comparing our list of
mouse diurnal genes with the mouse orthologs of the genes
reported by Cirelli et al. [25], we found 75 common genes in
the sleep-related cortex, 124 in the wakefulness-related cor-
tex, 32 in the sleep-related cerebellum and 67 in the wakeful-
ness-related cerebellum. This significant overlap provides
validation for the enrichment of sleep and wakefulness
induced genes in the set of diurnal genes over the 24 hour
cycle (P = 9.2E-49 by one-sided Fisher's exact test). In addi-
tion, another similar study examined a small set of 1,200 rat
transcripts to identify up- and down-regulated genes in the
basal forebrain, cerebral cortex and hypothalamus from rat
with sleep deprivation (SD) or recovery sleep (RS) [26]. For
this study, we identified 105 human orthologs, 106 mouse
orthologs, 108 rat genes and 52 Drosophila orthologs from
the Ensembl database that are related to sleep/wakefulness
(Table 1). We compared our list of diurnal genes in mouse
prefrontal cortex with the mouse orthologs of their rat genes,
and found 16 (out of 55) common genes that are up-regulated
in SD rats, 3 (out of 25) down-regulated in SD rats, 8 (out of
23) up-regulated in RS rats and 5 (out of 26) down-regulated
in RS rats. Our list of diurnal genes is enriched for SD and RS
related genes (P = 0.001 by one-sided Fisher's exact test).
In addition, rest/wakefulness induced genes have also been
identified in Drosophila [24,29]. From Cirelli et al., we
retrieved 135 wakefulness related and 14 sleep related Dro-
sophila genes with an over 1.5-fold change in expression lev-
els, as well as 136 differentially expressed genes at 4 am, a
time when flies are mostly asleep, and 4 pm, a time when flies
are mostly awake. We examined mouse orthologs for these
genes in our list of diurnal genes in the mouse, and found 19
wakefulness-related genes, 1 sleep-related gene and 16 differ-
entially expressed genes at 4 am and 4 pm in our list. A recent
study investigated gene expression changes in the Drosophila
brain during sleep and during a prolonged period of wakeful-
ness [29]. We retrieved 288 genes from the 252 probe set
identifiers in this study that differ in their expression in sleep-
deprived Drosophila and the control group. We identified 318
mouse orthologs for these genes and found that 63 genes
overlap with our diurnal genes list, indicating that our list is
enriched for SD related genes (P
= 6.9e-7 by one-sided
Fisher's exact test).
Real-time Q-PCR validation of diurnal genesFigure 2 (see previous page)
Real-time Q-PCR validation of diurnal genes. For each gene, the expression pattern detected by Q-PCR (lower panel) was compared with that detected by
microarray (upper panel). Data shown are mean ± standard error for three biological replicates in the microarrays, and for five biological replicates in Q-
PCR experiments. The Q-PCR results gave similar patterns to those detected by the microarray for 16/18 diurnally regulated genes.
Table 1
Orthologous Ensembl genes identified as diurnally regulated in our study or as circadian/sleep:wake controlled in five different studies
Number of unique genes
Study Human Mouse Rat Drosophila
This study 2,694 2,927 2,810 1,834
Panda et al. [16] 608 759 696 447
Cirelli et al. [25] 1,011 1,040 1,134 772
Terao et al. [26] 105 106 108 52
Cirelli et al. [24] 228 235 217 246
Zimmerman et al. [29] 288 318 332 288
Total unique genes 4,240 4,628 4,521 2,888
A more detailed list is available in Additional data file 1. For each study, the count of genes in the experimental organism is labeled in bold font.
Genome Biology 2007, 8:R247
Genome Biology 2007, Volume 8, Issue 11, Article R247 Yang et al. R247.6
In summary, the above comparative analysis with previous
publications revealed 469 diurnal genes that have been
reported to be circadian clock related or sleep/wakefulness
related. This indicates that a list of 2,458 mouse diurnal genes
in our study represent novel findings, mainly due to our
unique use of high-density arrays containing approximately
45,000 probe sets and the unique tissue (prefrontal cortex)
examined. Despite the liberal FDR threshold used in our
study, some of these genes may serve as candidates for stud-
ying the role of prefrontal cortex in the regulation of circadian
rhythm, diurnal activity and sleep:wake cycles. By assigning
Ensembl identifiers for mouse genes with diurnal expression
in the prefrontal cortex (this study), mouse genes with cycling
expression in the liver and SCN, and four sets of sleep or
wakefulness induced genes in the rat and fly, we permit a
large-scale comparison of findings performed on different
model organisms (Additional data file 1).
Functional analysis of eight temporal categories of
gene expression patterns
The expression levels at four ZT points over a 24 hour cycle
allowed us to investigate groups of genes with similar expres-
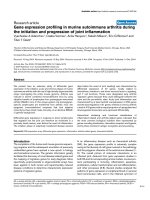
sion patterns, so-called temporal categories. We clustered
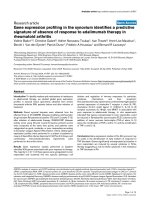
3,890 diurnal transcripts in the mouse prefrontal cortex into
eight clusters using the K-means clustering algorithm (Figure
3). The clusters each contain from 316 to 698 transcripts, with
a distinct pattern of expression and with clearly defined peaks
and troughs.
Examination of the eight temporal categories permits several
preliminary observations. For example, to identify which
clusters are most related to sleep/wakefulness regulation, we
examined the overlap of genes in each cluster and the entire
set of 1,536 sleep-related genes (combined list of mouse
orthologs of genes reported in [24-26,29]) and found that
cluster 3 (18.8%) and cluster 5 (21.4%) contain the highest
fraction of sleep-related genes.
To investigate whether or not the clustering of diurnal genes
correlates with functional groupings, we performed Gene
Ontology (GO) functional enrichment analysis on all of the
diurnal genes as a whole, and on each cluster of temporally
co-expressed genes separately. The GO annotation system
uses a controlled and hierarchical vocabulary to assign func-
tion to genes or gene products in any organism [34]. Among
the three independent GO categories (Biological process
(BP), Molecular function (MF) and Cellular component), we
focused on the annotation of BP and MF.
Initially, we examined the enrichment of the GO level 3 func-
tional annotations for all of the diurnal genes, using all the
genes on the microarray as the background distribution
(Table 2). The GO level 3 annotations assign general and
broad annotations to genes and gene products, so focusing on
this level of annotation reduces multiple testing issues while
achieving detailed insights and hints on gene function. Not
surprisingly, almost all of the enriched BP categories relate to
metabolism, cellular transport/localization and response to
stimuli. The enriched MF categories are more heterogeneous,
but many of them are related to nucleotide binding, RNA
binding or protein binding.
We next examined enriched GO level 4 annotations for each
of the eight clusters of diurnal genes, using all diurnal genes
as the background distribution (Table 3). Compared to the
analysis using all diurnal genes together, this analysis allowed
us to correlate the clusters of temporal categories to more
specific functional and biological roles. We found that the
eight clusters have a distinct distribution of BP functional cat-
egories, suggesting that the clustering results are biologically
meaningful. Many of the enriched BP functional categories
correspond to specialized aspects of metabolism and cellular
responses or the regulation of these processes. For example,
genes involved in protein transport and localization are
enriched in cluster 1, in which the genes are highly expressed
during the rest phase (light phase). Genes responsible for
vitamin metabolism are enriched in cluster 6, in which the
genes are highly expressed during the active phase (dark
phase), when the mice consume most of their food. In cluster
7, where genes have peak expression levels around ZT9 (late
in the rest phase), the enriched genes are responsible for the
generation of precursor metabolites and energy, which is in
preparation for the onset of the active phase. While in cluster
8, genes have higher expression early in the rest phase (ZT3)
and are enriched for cellular and macromolecular biosynthe-
sis, consistent with the notion that the sleep phase is impor-
tant for protein synthesis [25]. Most of the eight clusters do
not show clear enrichment of MF functional categories, indi-
cating that each cluster tends to contain genes with different
functional roles, but coordinated together in the same biolog-
ical process. However, it is worth noting that cluster 5, a clus-
ter with higher expression levels early in the active phase
(ZT15), is enriched for genes involved in regulating ion chan-
nel activity and response to protein stimulus. This may indi-
cate that higher levels of neuronal activities occur during the
active phase.
To investigate the associations of diurnally regulated genes
with cellular pathways, we queried the KEGG pathway data-
base using the list of all mouse diurnal genes. We found that
these genes are significantly enriched in several pathways,
including the MAPK signaling pathway (P = 8.2e-4, FDR =
0.01), the gap junction (P = 1.2e-3, FDR = 0.015) and focal
adhesion (P = 7.9e-3, FDR = 0.095). Consistent with our
results, it has been previously reported that the components
of the MAPK pathway tend to have cycling expression levels
[35]. Similarly, it has been demonstrated that cell-cell adhe-
sions also play an important role in maintaining and synchro-
nizing circadian rhythms [36].
Genome Biology 2007, Volume 8, Issue 11, Article R247 Yang et al. R247.7
Genome Biology 2007, 8:R247
Tissue specific expression analysis for diurnally
regulated genes
To gain insights into the tissue specificity of expression levels
of diurnally regulated genes, we next examined their expres-
sion levels in the GNF GeneAtlas dataset, which contains
expression patterns for 36,182 GNF probe sets in 61 mouse
tissues [37]. Since these mouse tissues are sampled at one
time point, we caution that this analysis reflects only a
snapshot of the transcriptome for diurnal genes. We plotted
the expression levels of diurnal transcripts in 61 tissues as a
heat map, and performed a two-way hierarchical clustering
for both the genes and the tissues (Additional data file 2). An
estimated 25% of the diurnally regulated transcripts are
highly expressed in brain-related tissues, such as cerebral
cortex, frontal cortex, hippocampus and cerebellum; another
estimated 20% are highly expressed in immune-related tis-
Plots of expression level in log scale versus four time points for the 3,890 diurnally regulated transcripts arranged in eight clustersFigure 3
Plots of expression level in log scale versus four time points for the 3,890 diurnally regulated transcripts arranged in eight clusters. These clusters have
very distinct temporal patterns of expression variation, suggesting that the clustering procedure is effective in picking out signals specific to each cluster.
03 09 15 21
1
0.2
0.3
0.4
0.6
2
3
4
03 09 15 21
ZT
Normalized Intensity
(Log Scale)
03 09 15 21
0.2
0.3
0.4
0.6
2
3
4
03 09 15 21
1
ZT
Normalized Intensity
(Log Scale)
03 09 15 21
1
0.2
0.3
0.4
0.6
2
3
4
03 09 15 21
ZT
Normalized Intensity
(Log Scale)
03 09 15 21
1
0.2
0.3
0.4
0.6
2
3
4
03 09 15 21
ZT
Normalized Intensity
(Log Scale)
03 09 15 21
1
0.2
0.3
0.4
0.6
2
3
4
03 09 15 21
ZT
Normalized Intensity
(Log Scale)
03 09 15 21
1
0.2
0.3
0.4
0.6
2
3
4
03 09 15 21
ZT
Normalized Intensity
(Log Scale)
03 09 15 21
1
0.2
0.3
0.4
0.6
2
3
4
03 09 15 21
ZT
Normalized Intensity
(Log Scale)
03 09 15 21
1
0.2
0.3
0.4
0.6
2
3
4
03 09 15 21
ZT
Normalized Intensity
(Log Scale)
Cluster 1
Cluster 2
Cluster 3
Cluster 4
Cluster 5
Cluster 6
Cluster 7
Cluster 8
Genome Biology 2007, 8:R247
Genome Biology 2007, Volume 8, Issue 11, Article R247 Yang et al. R247.8
sue, such as T cells, B cells and thymus; and the rest of the
diurnal genes are highly expressed in various other tissues.
Consistent with previous papers on circadian gene expression
[16], our results demonstrate that the diurnal gene expression
is usually tissue-specific. In addition, we did not observe obvi-
ous differences in patterns of tissue-specific expression
among genes across the eight temporal categories (data not
shown). This indicates that the transcriptional regulatory
mechanisms that separated these eight temporal categories
are not tissue-specific. It is important, therefore, to examine
whether there are specific transcriptional regulatory mecha-
nisms for each temporal category.
Transcription factor binding site enrichment in the
promoters of diurnally regulated genes
It has been shown that the expression of functionally related
genes is regulated by groups of transcription factors (TFs),
both spatially and temporally [38-40]. Since similar gene
expression patterns within a cluster may be attributed to the
presence of similar TF binding sites (TFBSs), we next per-
formed TFBS enrichment analysis on the eight temporal cat-
egories. The TFBSs were identified using the phylogenetic
footprinting approach, which utilizes the known profile or
positional weight matrix (PWM) for each TF and the human-
mouse evolutionary conservation [41]. For each cluster, we
assessed the enrichment statistics of sites identified for each
PWM in the 1 kb upstream regions of the genes within the
cluster and identified the most enriched TFBSs (Table 4).
Because a single TF often has multiple reported PWMs and
also different related TFs have similar PWMs, to remove
redundancy, we filtered the enriched PWMs that were similar
to a more enriched PWM. For instance, if PWM for TF ATF
was more enriched than the PWM for CREB, only ATF was
retained because the two PWMs are highly similar to each
other. Thus, each enriched TF in our analysis should be inter-
preted as the representative of a family of TFs with similar
binding sites. Except for cluster 7, each cluster contains
highly enriched TFBSs for several TF families, and these clus-
ters all have a distinct distribution of enriched TFBSs. Alto-
gether, our analysis indicates that transcriptional
mechanisms may underlie the different temporal expression
patterns for the eight clusters of diurnal genes.
We next examined whether some of the diurnal genes are
themselves TFs, and how their corresponding TFBSs are dis-
tributed and enriched in the upstream regions of genes in
each of the eight clusters. Among the eight clusters, cluster 5
- a cluster enriched with genes involved in response to stimu-
lus - is the most TF-rich cluster, with 19 TFs (with positional
weight matrix information in the TRANSFAC database),
while cluster 7 - a cluster enriched with metabolism-related
genes - is the most TF-poor cluster, with 2 TFs. We generated
Table 2
The most over-represented level 3 GO annotations in the Biological process and Molecular function categories for diurnally regulated
genes, using all genes on the Mouse430_2 array as the background distribution
Level 3 GO annotation Count P value FDR (%)
Biological process
Macromolecule metabolism 776 1.6e-9 0
Primary metabolism 1,190 4.4e-8 0
Cellular metabolism 1,217 4.6e-6 0
Response to unfolded protein 24 9.4e-5 0.1
Protein localization 155 2.6e-4 0.3
Cell organization and biogenesis 343 5.6e-4 0.7
Cellular localization 140 5.0e-3 6.5
Response to heat 10 1.3e-2 15.8
Molecular function
Purine nucleotide binding 343 9.3e-7 0
Transferase activity, transferring
phosphorus-containing groups
232 2.9e-6 0
RNA binding 120 8.7e-6 0
Ligase activity, forming carbon-
nitrogen bonds
74 4.4e-5 0.1
Unfolded protein binding 39 1.1e-3 1.5
GTPase activator activity 34 1.2e-2 15.2
Protein kinase regulator activity 20 1.4e-2 17.2
Heat shock protein binding 16 1.5e-2 18.1
Genome Biology 2007, Volume 8, Issue 11, Article R247 Yang et al. R247.9
Genome Biology 2007, 8:R247
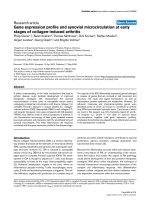
a heat map to demonstrate the TF-TFBS relationships (Figure
4), and provid detailed statistics on these TFs and TFBSs for
each cluster in Additional data file 3. We found that clusters
2, 7 and 8 contain very few TFs whose TFBSs are enriched in
other clusters (in Figure 4, cells in the columns for TF1, TF7
and TF8 are mostly green), but cluster 2 and 7 contain many
enriched TFBSs that are regulated by TFs in other clusters (in
Figure 4, many cells in the rows for TFBS2 and TFBS7 are
red). Therefore, the diurnal expression of many genes in these
three clusters may be due to the transcriptional control of
other clusters. In contrast, clusters 4, 5 and 6 contain TFs
whose TFBSs are enriched in many other clusters (in Figure
4, many cells in columns of TF4, TF5 and TF6 are red), indi-
cating that these clusters tend to contain factors that regulate
temporal expression of genes in other clusters.
Discussion
In this study we performed a genome-wide expression profil-
ing analysis on the mouse prefrontal cortex and identified
3,890 transcripts representing 2,927 genes with diurnally
regulated expression levels during a 24 hour day:night cycle,
among which are 2,458 genes that have not been reported as
circadian or sleep:wake related genes in previous studies.
Using a clustering analysis, we grouped these diurnal tran-
scripts into categories with similar temporal patterns of
expression and showed that these groups differ based on GO
functional annotation and distribution of TFBSs in their
immediate upstream regions. Annotation of these 2,927
genes will provide a valuable source of candidate genes for
behavioral mutations in model organisms such as mouse and
for human psychiatric disorders, especially those associated
Table 3
The most over-represented level 4 GO annotations in the Biological process and Molecular function categories for each of the eight
clusters of diurnal genes, using all diurnal genes as background distribution
Cluster GO level 4 annotation Count P value FDR (%)
Biological process
1 Protein transport 49 1.6e-4 0.2
Establishment of protein localization 49 2.7e-4 0.4
Intracellular transport 44 1.3e-3 1.8
Establishment of cellular localization 44 1.8e-3 2.4
Cellular localization 44 1.8e-3 2.4
Vesicle-mediated transport 25 1.2e-2 15
2 M phase 12 3.0e-3 4.1
3 Phosphorus metabolism 44 3.4e-4 0.5
Biopolymer metabolism 97 1.9e-3 2.5
4None
5 Response to protein stimulus 8 5.3e-3 7.2
6 Vitamin metabolism 7 1.5e-2 18.6
7 Generation of precursor metabolites and energy 20 1.3e-2 16.6
8 Cellular biosynthesis 25 7.0e-3 9.3
Antigen processing 4 9.2e-3 12.0
Macromolecule biosynthesis 17 1.7e-2 21.4
Molecular function
1 Guanyl nucleotide binding 22 1.4e-2 17.0
2None
3None
4None
5 Voltage-gated ion channel activity 11 5.7e-4 0.8
Alkali metal ion binding 8 5.4e-3 6.9
Calcium ion binding 19 1.0e-2 12.7
Ion channel activity 12 2.1e-2 24.9
6None
7None
8None
Genome Biology 2007, 8:R247
Genome Biology 2007, Volume 8, Issue 11, Article R247 Yang et al. R247.10
with sleep and circadian disturbances. In addition, annota-
tion of the eight temporal categories can also provide a rich
resource for pathway-based functional interpretation of
microarray and genome-wide association studies examining
cohorts of genes sharing similar functions or co-regulated
genes [42].
There are several distinct differences between our study and
previous studies on the identification and characterization of
oscillating/cycling genes. First, we used the mouse prefrontal
cortex as our target for expression profiling, due to its impor-
tance in executive functions and in mediating sleep [4,5].
Given the association of psychiatric disorders with malfunc-
tions in prefrontal cortex [9-11], we suggest that diurnal genes
in the prefrontal cortex are more likely to be associated with
human mental behaviors and psychiatric disorders, particu-
larly those associated with sleep disturbances. As demon-
strated in previous experiments, the expression of oscillating
genes is highly tissue specific, explaining a small percentage
(8.3%) of genes with overlap between SCN and liver in the
mouse for circadian genes [16], though the overlap was higher
(40-51%) between whole cortex and cerebellum in the rat for
wakefulness- and sleep-related genes [25]. It is encouraging
that a comparative analysis of our data on mouse prefrontal
cortex demonstrated significant (16%) overlap with reports
on circadian and sleep/wakefulness related genes. This
overlap serves as another means of validation of our findings
and further supports previous reports on a subset of genes
with cycling expression across tissues.
Second, our goal was to cast a broad net and identify a large
number of diurnally regulated genes in a specific tissue, that
is, prefrontal cortex. This study does not attempt to distin-
guish between genes controlled by the circadian system from
those regulated by the sleep:wake states. We are aware that a
subset of genes identified as diurnally regulated in our study
will include genes expressed in response to other external
stimuli, including light. This, together with the fact that we
used the most extensive arrays and profiled gene expression
in a distinct tissue (prefrontal cortex), could explain why most
(84%) of the diurnal genes we identified have not been
reported in previous circadian and sleep:wake studies in
other brain regions from various organisms.
Third, other studies on oscillating gene expression used
arrays with relatively few probe sets (less than 10,000 for
most publications), but we examined the mouse transcrip-
tome using an array set containing 45,000 probe sets. This
large scale analysis enabled us to identify a comprehensive
list of genes with diurnal expression levels. Therefore, even
though the estimated frequency (approximately 10%) of diur-
nally regulated genes is similar to previous estimates, the
number of genes that we identified is an order of magnitude
higher than previous studies. By identifying a large number of
diurnally regulated genes in a defined brain region, a cluster-
ing analysis resulted in sufficiently large number of genes in
each temporal category. There are several main advantages to
performing clustering analysis. First, the entire list of diurnal
genes may contain genes with many different functions in
various cellular pathways. By clustering their patterns of
expression variation, we can isolate a specific group of genes
with similar expression patterns for more refined functional
analysis. For example, analysis of periodically expressed
genes in budding yeast showed that genes that encode pro-
teins with a common function often show similar temporal
expression patterns, whereas different classes of genes are
upregulated at different temporal windows of the respiratory
cycles [43]. Second, clustering also allowed us to perform
analysis of common sequence motifs and TFBSs on each clus-
ter, which may identify key sequences responsible for com-
mon transcriptional regulation. We note that clustering of
temporal categories has been performed in several other
studies [44,45]. For example, Tavazoie et al. [44] used K-
means clustering algorithm to cluster 3,000 yeast open read-
ing frames into 30 clusters, based on expression profiles at 15
time points, and subsequently performed functional enrich-
ment analysis and cis-regulatory elements analysis. We used
the same clustering algorithm to generate eight temporal cat-
egories, but used different strategies to analyze the biological
Heat map of enriched TFBSs and their corresponding TFs for each of the eight clusters, when both TFBSs and TFs are present in the diurnal genesFigure 4
Heat map of enriched TFBSs and their corresponding TFs for each of the
eight clusters, when both TFBSs and TFs are present in the diurnal genes.
The columns indicate the TFs in each of the eight clusters, where the rows
represent the enriched (P < 0.05) TFBSs in the 1 kb upstream region of
genes in each of the eight clusters. The color of the cell represents the
degree of matching: green cells indicate that there is no matching TF and
TFBS, while increasing intensity of red colors indicate one or more
matches. We found that clusters 2, 7 and 8 contain few TFs that may
regulate genes in other clusters, but clusters 4-6 tend to have TFs that
may regulate genes in most of the other clusters.
09
TFBS1
TFBS2
TFBS3
TFBS4
TFBS5
TFBS6
TFBS7
TFBS8
TF1
TF2
TF3
TF4
TF5
TF6
TF7
TF8
Genome Biology 2007, Volume 8, Issue 11, Article R247 Yang et al. R247.11
Genome Biology 2007, 8:R247
meaning of each cluster. We used GO, which is composed of a
controlled vocabulary, for the functional enrichment analysis.
We also used positional weight matrices from the TRANSFAC
database for the TFBS enrichment analysis. Unlike regulatory
elements in yeast, the known TFBS profiles in vertebrates are
based on experimentally determined binding sites. This, cou-
pled with our use of phylogenetic footprinting to identify
putative binding sites, is likely to yield fewer false positives.
We are aware of potential problems and limitations with the
current study. We compare gene expression profiles at four
time points in a single day rather than sampling tissues over
several days. In several similar studies, either a 48 hour
period or a 72 hour period was used to study the cycling pat-
terns of expression levels. We acknowledge that sampling
more time points over several days would provide more data
and higher statistical power for fitting circadian curves; how-
ever, our goal in the current study was to identify genes with
variable expression levels during the day, rather than genes
under circadian control, which requires measurements over a
period of several days.
An important aspect of our study is our attempt to establish
orthologous relationships between diurnally regulated/
cycling genes in different model organisms. This led to the
finding that a significant number of brain genes are periodi-
cally expressed across species, supporting our prediction that
at least a subset of orthologous genes in human will have diur-
nally regulated expression. We assume that alternations in
these genes and even changes in the amplitude of expression
due to genetic variation among individuals may contribute to
polygenic factors in neurological and psychiatric diseases.
Therefore, our study provides a rich source of novel candidate
genes and groups of co-regulated genes for human genetic
studies. For example, 10 genes among the 16 confirmed genes
(Cacng2, Dnajc3, Dusp4, Gpc6, Mbp, Nov, Phf21b, Atxn10,
Xbp1, and Zfyve28) have their human orthologs located
within a 10 Mb region flanking the linkage markers for bipo-
lar disorder [30], and thus merit further study. Prioritization
of the list of diurnal genes in mammalian prefrontal cortex by
virtue of their chromosomal location in the vicinity of defined
susceptibility loci for human neurological and psychiatric dis-
orders and identification of single nucleotide polymorphisms
in these genes will represent a first step in this analysis.
Table 4
TFBS enrichment in each of the eight clusters of diurnal genes
Cluster PWM ID for TFBS Fold enrichment P value for enrichment TF family name
1 M00036 1.345 0 v-Jun
M00248 1.631 0 Oct1
M00920 1.119 0 E2F
M00137 1.439 0.001 Oct1
M00494 1.614 0.003 STAT6
M01011 1.579 0.003 HNF1
2 M00411 1.383 0 HNF-4alpha1
M00712 1.457 0.001 Myogenin
M00331 1.505 0.003 Lentiviral_TATA
M00261 1.294 0.004 Olf-1
M00658 1.392 0.005 PU.1
3 M01066 1.577 0 BLIMP1
M00731 1.915 0.001 Osf2
M00655 1.3 0.003 PEA3
4 M00116 1.711 0.005 C/EBPalpha
M00123 1.39 0.005 c-Myc:Max
5 M00641 1.473 0 HSF
M00736 1.3 0.002 E2F-1:DP-1
6 M00634 1.355 0 GCM
M00083 1.284 0.002 MZF1
M01036 1.223 0.004 COUPTF
M00069 1.265 0.005 YY1
M00119 1.282 0.005 Max
7None
8 M00762 1.446 0.004 PPAR,_HNF-
4,_COUP,_RAR
A more detailed list is available in Additional data file 3.
Genome Biology 2007, 8:R247
Genome Biology 2007, Volume 8, Issue 11, Article R247 Yang et al. R247.12
Conclusion
Our analysis demonstrates that about 10% of transcripts have
diurnally regulated expression patterns in the mouse prefron-
tal cortex. These genes can be clustered into eight temporal
categories with distinct functional attributes, as assessed by
the GO classification and the analysis of enriched TFBSs.
Functional annotation of these genes with respect to diurnal
expression will be important for the selection of candidate
genes for behavioral mutants in model organisms and for
human psychiatric disorders, especially those associated with
sleep and circadian disturbances.
Materials and methods
Animals
All animal experiments were carried out according to the
National Institutes of Health guidelines for the use of animals
and were approved by the University of Pennsylvania Institu-
tional Animal Care and Use Committee. C57BL/6J mice at
ten weeks old were obtained from the Jackson Laboratory
(Bar Harbor, ME, USA) and maintained on a LD (12:12) cycle
with lights on at 7:00 am. Food and water were available ad
libitum using standard mouse husbandry procedures. The
mice were acclimatized to the lab environment for one week
and then entrained for another week under the LD (12:12)
cycles with lights on at 7:00 am and 7:00 pm, respectively. We
conformed to Zeitgeber time for our experiment, which is
used to describe the projected time based on the previous
light cycle, with lights on defined as ZT0. At ZT3, ZT9, ZT15,
and ZT21, three mice were sacrificed and brains were quickly
removed (under red light at ZT15 and ZT21). The prefrontal
cortex was defined as described [46] and dissected using the
atlas of Franklin and Paxinos as a reference [47]. After remov-
ing the olfactory bulb, the most anterior 2 mm cortical area
was cut as part of the prefrontal cortex. Then the coronal
brain section anterior to the optic chiasm was cut and subcor-
tical structures were removed, which resulted in a tissue
about 2 mm ventral from the dorsal surface of the cortex. The
prefrontal cortex tissue was put on dry ice immediately after
dissection and stored at -80°C until RNA extraction. For val-
idation of the gene expression patterns, we performed the
same experiments using another set of mice with five individ-
ual animals per ZT.
Expression profiling experiment
The Affymetrix Mouse430_v2 oligonucleotide microarray
(Affymetrix, Santa Clara, CA, USA), which contains 45,037
probe sets, was used for expression profiling experiments.
The RNA isolation and the microarray experiment were car-
ried out as described previously [48]. Briefly, total RNA from
the mouse prefrontal cortex was isolated using TRIzol reagent
(Invitrogen, Carlsbad, CA, USA) followed by cleanup using
RNeasy mini kit (Qiagen, Valencia, CA, USA). Total RNA (5
μg) from the prefrontal cortex of each mouse was subjected to
cDNA synthesis and each biological replicate was hybridized
to one chip, which totals in 12 chips. Microarray data can be
accessed through the National Center for Biotechnology
Information Gene Expression Omnibus (GEO Series
GSE9471).
Identification and clustering of diurnal genes
Affymetrix Microarray Suite 5.0 was used to quantify expres-
sion levels for targeted genes using default parameter values.
Probe pairs were scored as positive or negative for detection
of the targeted sequence by comparing signals from the per-
fect match and mismatch probe features. The number of
probe pairs meeting the default discrimination threshold (tau
= 0.015) was used to assign a call (or flag) of absent, present
or marginal for each assayed gene, and a P value was
calculated to reflect confidence in the detection call. A
weighted mean of probe fluorescence (corrected for nonspe-
cific signal by subtracting the mismatch probe value) was cal-
culated using the one-step Tukey's biweight estimate. This
signal value, a relative measure of the expression level, was
computed for each assayed gene. Global scaling was applied
to allow comparison of gene signals across multiple microar-
rays: after exclusion of the highest and lowest 2%, the average
feature signal was calculated and used to determine what
scaling factor was required to adjust the chip average to an
arbitrary target of 150. All signal values from one microarray
were then multiplied by the appropriate scaling factor. The
data files were imported to GeneSpring 7 (Silicon Genetics,
Redwood City, CA, USA), and to minimize multiple testing
problems, the probe list was filtered to include only those that
scored as 'present' or 'marginal' in the array software in at
least two of the three replicate samples. This resulted in
24,546 probe sets, for which the GCRMA normalized expres-
sion values were extracted from the CEL files in GeneSpring
7. The GCRMA normalized data for the 24,546 probe sets
were subjected to significance analysis of microarray (SAM)
[49] for multiclass analysis of the four ZTs, each with three
replicates. Significant genes were selected by adjusting the
delta value for a FDR of 20%, and the resulting 3,944 tran-
scripts were further filtered by eliminating genes whose nor-
malized expression levels were lower than 0.9 at all 4 ZTs. The
resulting 3,890 probe sets were clustered into 8 groups by
their patterns of expression variation, using the K-means
unsupervised clustering algorithm implemented in the Gene-
Spring software. The FDR threshold of 20% is a relatively lib-
eral threshold, because we emphasized the generation of a
highly comprehensive gene list over specificity; if the FDR
threshold is adjusted to 10%, the number of significant genes
drops to 388 and some of the known cycling genes, including
Arntl and Per1, are excluded.
Validation of diurnally regulated gene expression by
real-time Q-PCR
Real-time PCR was carried out on ABI Prism 7900HT
sequence detection system (Applied Biosystems, Foster City,
CA, USA) by relative quantification (ΔΔCt method) as
described previously [48]. Briefly, the total RNA samples iso-
lated from the prefrontal cortex were reverse-transcribed into
Genome Biology 2007, Volume 8, Issue 11, Article R247 Yang et al. R247.13
Genome Biology 2007, 8:R247
cDNA using a High Capacity cDNA Archive Kit (Applied Bio-
systems). The cDNA were then subjected to real-time PCR for
18 target genes (Arntl, Per2, Cacng2, Camk1g, Dnajc3,
Dusp4, Gpc6, Ier5, Mbp, Nov, Phf21b, Rasd2, Sbk1, Atxn10,
Sult4a1, Pdia6, Xbp1, and Zfyve28) using rodent GAPDH as
endogenous control. All the TaqMan assays and reagents
were from Applied Biosystems. Three replicates were per-
formed for each of the five mice at ZT3, ZT9, ZT15, and ZT21.
Statistical analysis was performed using one-way ANOVA
and t-test to evaluate expression fluctuations across the four
ZTs.
Comparison of our diurnal genes to genes previously
reported
Several other publications reported genes in rats or mice
under different environments, such as under regulation of the
circadian system or under sleep/wakefulness control. For the
previously published experiments, the probe set identifiers
were retrieved from the supplementary materials of the pub-
lications and translated to Ensembl gene identifiers by query-
ing the Ensembl database (version 42, December 2006).
Several previously published data sets were collected on rats
or flies, so we queried our mouse diurnal genes against the
Ensembl-Compara database [32], and collected the corre-
sponding orthologous genes for comparative analysis. This
procedure ensures the most comprehensive and up-to-date
translations between the probe set identifiers and gene
identifiers.
Functional analysis of genes with diurnally regulated
expression
The DAVID 2007 web server [50] was used for functional
analysis of the diurnally regulated genes. When analyzing the
common enriched functional categories among the diurnal
genes, all genes in the genome were used as the 'background
population'; when analyzing each of the eight clusters of diur-
nal genes, all the diurnal genes were used as the 'background
population'. The GO scheme was adopted for functional
annotation of diurnal genes, and GO levels of 3 for broader
annotations and 4 for specific annotations were used. The P
values are calculated from one-sided Fisher's exact test. Due
to the lack of independence between genes and between GO
categories, there has not been a golden-standard way to per-
form P value adjustment for gene enrichment analysis. There-
fore, we also provide the FDR measure and caution that the
table could contain some false positive GO categories.
Tissue-specific expression analysis of diurnal genes
We collected the GNF GeneAtlas mouse expression data sets
[37] from GNF Genome Informatics Applications and Data-
sets [51]. This data set contains expression measures for
36,182 GNF probe sets in 61 mouse tissues, and the raw data
were processed by the GC-RMA normalization procedure. We
used GNF's annotation file to translate these probe set identi-
fiers to Ensembl transcript identifiers, to establish the corre-
spondence with our diurnal transcripts. We were able to
retrieve expression measures for 2,097 diurnal transcripts in
the GNF data set. We then used the two-way hierarchical clus-
tering algorithm implemented in the Hierarchical Clustering
Explorer software [52] to cluster both the genes and the
tissues.
Transcription factor binding site analysis
A phylogenetic-footprinting approach to predict TFBSs in
human and mouse was previously reported [41]. Using this
approach, a comprehensive mouse TFBS database was built.
Briefly, for each gene in the mouse genome, the 1 kb genomic
sequence immediately upstream of the transcription start site
was searched using the 546 vertebrate PWMs obtained from
the TRANFAC database v8.4 [53]. A PWM is a 4 × k matrix for
a k bases long binding site and provides, for each of the k posi-
tions, the preferences for the four nucleotide bases at that
position. Matches between TRANFAC PWMs and promoter
regions of the mouse genes were selected using the tool PWM-
SCAN [41]. The criterion for a match was a P value cutoff of 2
× 10
-4
, corresponding to a chance occurrence of one match
per 5 kb on average. These matches were filtered further using
human-mouse genome sequence alignments to focus our
analyses on promoter regions that showed evolutionary con-
servation. For each TRANSFAC match the fraction c of bind-
ing site bases that were identical between human and mouse
was computed, and the matches for which either P value =
0.00002 (expected frequency of 1 in 50 kb) or c = 0.8 were
retained.
The over-representation of TFBSs in each gene cluster was
calculated by dividing the frequency with which a given TFBS
was present in promoters of genes in the cluster by its fre-
quency in the promoters of all diurnal genes. Statistical signif-
icance was then assessed by permutation tests. More
specifically, let P denote the set of 1 kb promoter sequences of
genes in a given cluster, and let C represent the promoter
sequences for the entire set of diurnal genes. For each of the
546 transcription factor PWMs, define over-representation of
the PWM x
i
as:
where |P| and |C| are the number of sequences in P and C,
respectively. Let P' be a set of |P| sequences, randomly
selected from C. Analogous to s
i
, we calculate over-represen-
tation s
i
' in P' relative to C. Assume that s
i
= 1. In 1,000 such
random samplings, the fraction of times in which the over-
representation s
i
' = s
i
estimates the significance of s
i
.
Abbreviations
BP, Biological process; FDR, false discovery rate; GO, Gene
Ontology; MF, Molecular function; PWM, positional weight
matrix; Q-PCR, quantitative PCR; RS, recovery sleep; SD,
s
C
P
i
=∗
number of x
i
in P
number of x
i
in C
||
||
,
Genome Biology 2007, 8:R247
Genome Biology 2007, Volume 8, Issue 11, Article R247 Yang et al. R247.14
sleep deprivation; TF, transcription factor; TFBS, transcrip-
tion factor binding site; ZT, Zeitgeber time.
Authors' contributions
SY performed microarray experiments, real-time PCR valida-
tion, raw data processing and clustering analysis. KW and OV
conducted bioinformatics analysis on the diurnal genes and
comparative analysis with other publications. SH performed
transcription factor binding site enrichment analysis. MB
conceived the study, guided the interpretation of data and
provided intellectual mentorship and guidance. All authors
contributed to the writing and approved the final version of
the manuscript.
Additional data files
The following additional data are available with the online
version of this paper. Additional data file 1 provides 62 addi-
tional tables listing expression values at four time points for
diurnally regulated genes, the clustering results from the
GeneSpring software, and the gene identifiers used in our
comparative analysis with five other publications. Additional
data file 2 is a figure illustrating the heat map of expression
levels for diurnal genes in 61 mouse tissues, with two-way
hierarchical clustering for both the tissues and the genes.
Additional data file provides three additional tables listing
detailed statistics values as well as TFBS names and identifi-
ers for TFBS enrichment analysis in the eight clusters of
genes.
Additional data file 1Expression values at four time points for diurnally regulated genes, the clustering results from the GeneSpring software, and the gene identifiers used in our comparative analysis with five other publicationsExpression values at four time points for diurnally regulated genes, the clustering results from the GeneSpring software, and the gene identifiers used in our comparative analysis with five other publications.Click here for fileAdditional data file 2Heat map of expression levels for diurnal genes in 61 mouse tissues, with two-way hierarchical clustering for both the tissues and the genesHeat map of expression levels for diurnal genes in 61 mouse tissues, with two-way hierarchical clustering for both the tissues and the genes. The red rectangular box around tissue names indicates brain-related tissues.Click here for fileAdditional data file 3Detailed statistics values as well as TFBS names and identifiers for TFBS enrichment analysis in the eight clusters of genesDetailed statistics values as well as TFBS names and identifiers for TFBS enrichment analysis in the eight clusters of genes.Click here for file
Acknowledgements
We thank David Raizen, Namni Goel and Amita Sehgal for critical reading
of the manuscript; Michael Farias and Adetoun Adeniji-Adele for technical
assistance. This work was supported by NIH grant R01 MH604687 and
NARSAD distinguished Investigator Award to MB, and by NIH grant
1R21AI073422-01 to SH.
References
1. Fuster JM: The Prefrontal Cortex: Anatomy, and Neuropsychology of the
Frontal Lobe Lippincott Williams and Wilkins, Philadelphia; 1997.
2. Hallonquist JD, Goldberg MA, Brandes JS: Affective disorders and
circadian rhythms. Can J Psychiatry 1986, 31:259-272.
3. Quirk GJ, Beer JS: Prefrontal involvement in the regulation of
emotion: convergence of rat and human studies. Curr Opin
Neurobiol 2006, 16:723-727.
4. Durmer JS, Dinges DF: Neurocognitive consequences of sleep
deprivation. Semin Neurol 2005, 25:117-129.
5. Muzur A, Pace-Schott EF, Hobson JA: The prefrontal cortex in
sleep. Trends Cogn Sci 2002, 6:475-481.
6. Davidson RJ: Anxiety and affective style: role of prefrontal cor-
tex and amygdala. Biol Psychiatry 2002, 51:68-80.
7. Marvel CL, Paradiso S: Cognitive and neurological impairment
in mood disorders. Psychiatr Clin North Am 2004, 27:19-36. vii-viii
8. Price AL, Patterson NJ, Plenge RM, Weinblatt ME, Shadick NA, Reich
D: Principal components analysis corrects for stratification
in genome-wide association studies. Nat Genet 2006,
38:904-909.
9. Pennacchio LA, Ahituv N, Moses AM, Prabhakar S, Nobrega MA,
Shoukry M, Minovitsky S, Dubchak I, Holt A, Lewis KD, et al.: In vivo
enhancer analysis of human conserved non-coding
sequences. Nature 2006, 444:499-502.
10. Strakowski SM, Delbello MP, Adler CM: The functional neuro-
anatomy of bipolar disorder: a review of neuroimaging
findings. Mol Psychiatry 2005, 10:105-116.
11. Arnsten AF: Fundamentals of attention-deficit/hyperactivity
disorder: circuits and pathways. J Clin Psychiatry 2006, 67(Suppl
8):
7-12.
12. Boivin DB: Influence of sleep-wake and circadian rhythm dis-
turbances in psychiatric disorders. J Psychiatry Neurosci 2000,
25:446-458.
13. Berger M, van Calker D, Riemann D: Sleep and manipulations of
the sleep-wake rhythm in depression. Acta Psychiatr Scand Suppl
2003, 418:83-91.
14. Riemann D, Voderholzer U, Berger M: Sleep and sleep-wake
manipulations in bipolar depression. Neuropsychobiology 2002,
45(Suppl 1):7-12.
15. Nicholas B, Rudrasingham V, Nash S, Kirov G, Owen MJ, Wimpory
DC: Association of Per1 and Npas2 with autistic disorder:
support for the clock genes/social timing hypothesis. Mol
Psychiatry 2007, 12:581-592.
16. Panda S, Antoch MP, Miller BH, Su AI, Schook AB, Straume M, Schultz
PG, Kay SA, Takahashi JS, Hogenesch JB: Coordinated transcrip-
tion of key pathways in the mouse by the circadian clock. Cell
2002, 109:307-320.
17. Storch KF, Lipan O, Leykin I, Viswanathan N, Davis FC, Wong WH,
Weitz CJ: Extensive and divergent circadian gene expression
in liver and heart. Nature 2002, 417:78-83.
18. Rudic RD, McNamara P, Reilly D, Grosser T, Curtis AM, Price TS,
Panda S, Hogenesch JB, FitzGerald GA: Bioinformatic analysis of
circadian gene oscillation in mouse aorta. Circulation 2005,
112:2716-2724.
19. Ceriani MF, Hogenesch JB, Yanovsky M, Panda S, Straume M, Kay SA:
Genome-wide expression analysis in Drosophila reveals
genes controlling circadian behavior. J Neurosci 2002,
22:9305-9319.
20. Claridge-Chang A, Wijnen H, Naef F, Boothroyd C, Rajewsky N,
Young MW: Circadian regulation of gene expression systems
in the Drosophila head. Neuron 2001, 32:657-671.
21. Lin Y, Han M, Shimada B, Wang L, Gibler TM, Amarakone A, Awad
TA, Stormo GD, Van Gelder RN, Taghert PH: Influence of the
period-dependent circadian clock on diurnal, circadian, and
aperiodic gene expression in Drosophila melanogaster. Proc
Natl Acad Sci USA
2002, 99:9562-9567.
22. McDonald MJ, Rosbash M: Microarray analysis and organization
of circadian gene expression in Drosophila. Cell 2001,
107:567-578.
23. Ueda HR, Matsumoto A, Kawamura M, Iino M, Tanimura T, Hashim-
oto S: Genome-wide transcriptional orchestration of circa-
dian rhythms in Drosophila. J Biol Chem 2002, 277:14048-14052.
24. Cirelli C, LaVaute TM, Tononi G: Sleep and wakefulness modu-
late gene expression in Drosophila. J Neurochem 2005,
94:1411-1419.
25. Cirelli C, Gutierrez CM, Tononi G: Extensive and divergent
effects of sleep and wakefulness on brain gene expression.
Neuron 2004, 41:35-43.
26. Terao A, Wisor JP, Peyron C, Apte-Deshpande A, Wurts SW, Edgar
DM, Kilduff TS: Gene expression in the rat brain during sleep
deprivation and recovery sleep: an Affymetrix GeneChip
study. Neuroscience 2006, 137:593-605.
27. Terao A, Steininger TL, Hyder K, Apte-Deshpande A, Ding J, Riship-
athak D, Davis RW, Heller HC, Kilduff TS: Differential increase in
the expression of heat shock protein family members during
sleep deprivation and during sleep. Neuroscience 2003,
116:187-200.
28. Akhtar RA, Reddy AB, Maywood ES, Clayton JD, King VM, Smith AG,
Gant TW, Hastings MH, Kyriacou CP: Circadian cycling of the
mouse liver transcriptome, as revealed by cDNA micro-
array, is driven by the suprachiasmatic nucleus. Curr Biol 2002,
12:540-550.
29. Zimmerman JE, Rizzo W, Shockley KR, Raizen DM, Naidoo N, Mack-
iewicz M, Churchill GA, Pack AI: Multiple mechanisms limit the
duration of wakefulness in Drosophila brain. Physiol Genomics
2006, 27:337-350.
30. Craddock N, O'Donovan MC, Owen MJ: The genetics of schizo-
phrenia and bipolar disorder: dissecting psychosis. J Med
Genet 2005, 42:193-204.
31. Gupta AR, State MW: Recent advances in the genetics of
autism. Biol Psychiatry
2007, 61:429-437.
32. Birney E, Andrews TD, Bevan P, Caccamo M, Chen Y, Clarke L,
Genome Biology 2007, Volume 8, Issue 11, Article R247 Yang et al. R247.15
Genome Biology 2007, 8:R247
Coates G, Cuff J, Curwen V, Cutts T, et al.: An overview of
Ensembl. Genome Res 2004, 14:925-928.
33. GNF Database of Circadian Gene Expression [http://expres
sion.gnf.org/cgi-bin/circadian/index.cgi]
34. Ashburner M, Ball CA, Blake JA, Botstein D, Butler H, Cherry JM,
Davis AP, Dolinski K, Dwight SS, Eppig JT, et al.: Gene ontology:
tool for the unification of biology. The Gene Ontology
Consortium. Nat Genet 2000, 25:25-29.
35. Akashi M, Nishida E: Involvement of the MAP kinase cascade in
resetting of the mammalian circadian clock. Genes Dev 2000,
14:645-649.
36. Long MA, Jutras MJ, Connors BW, Burwell RD: Electrical synapses
coordinate activity in the suprachiasmatic nucleus. Nat
Neurosci 2005, 8:61-66.
37. Su AI, Wiltshire T, Batalov S, Lapp H, Ching KA, Block D, Zhang J,
Soden R, Hayakawa M, Kreiman G, et al.: A gene atlas of the
mouse and human protein-encoding transcriptomes. Proc
Natl Acad Sci USA 2004, 101:6062-6067.
38. Stathopoulos A, Levine M: Genomic regulatory networks and
animal development. Dev Cell 2005, 9:449-462.
39. Bahler J: Cell-cycle control of gene expression in budding and
fission yeast. Annu Rev Genet 2005, 39:69-94.
40. Olson EN: Gene regulatory networks in the evolution and
development of the heart. Science 2006, 313:1922-1927.
41. Levy S, Hannenhalli S: Identification of transcription factor bind-
ing sites in the human genome sequence. Mamm Genome 2002,
13:510-514.
42. Curtis RK, Oresic M, Vidal-Puig A: Pathways to the analysis of
microarray data. Trends Biotechnol 2005, 23:429-435.
43. Tu BP, Kudlicki A, Rowicka M, McKnight SL: Logic of the yeast
metabolic cycle: temporal compartmentalization of cellular
processes. Science 2005, 310:1152-1158.
44. Tavazoie S, Hughes JD, Campbell MJ, Cho RJ, Church GM: System-
atic determination of genetic network architecture. Nat
Genet 1999, 22:281-285.
45. Arbeitman MN, Furlong EE, Imam F, Johnson E, Null BH, Baker BS,
Krasnow MA, Scott MP, Davis RW, White KP: Gene expression
during the life cycle of Drosophila melanogaster. Science 2002,
297:2270-2275.
46. Guldin WO, Pritzel M, Markowitsch HJ: Prefrontal cortex of the
mouse defined as cortical projection area of the thalamic
mediodorsal nucleus. Brain Behav Evol 1981, 19:93-107.
47. Paxinos GF, KBJ : The Mouse Brain in Stereotaxic Coordinates 2nd edi-
tion. New York: Academic Press; 2001.
48. Yang S, Farias M, Kapfhamer D, Tobias J, Grant G, Abel T, Bucan M:
Biochemical, molecular and behavioral phenotypes of
Rab3A mutations in the mouse. Genes Brain Behav 2007, 6:77-96.
49. Tusher VG, Tibshirani R, Chu G: Significance analysis of micro-
arrays applied to the ionizing radiation response. Proc Natl
Acad Sci USA 2001, 98:5116-5121.
50. Dennis G Jr, Sherman BT, Hosack DA, Yang J, Gao W, Lane HC, Lem-
picki RA: DAVID: Database for Annotation, Visualization, and
Integrated Discovery. Genome Biol 2003, 4:P3.
51. GNF Genome Informatics Applications and Datasets [http:/
/wombat.gnf.org]
52. Seo J, Shneiderman B: Interactively exploring hierarchical clus-
tering results. IEEE Computer 2002, 35:80-86.
53. Wingender E, Dietze P, Karas H, Knuppel R: TRANSFAC: a data-
base on transcription factors and their DNA binding sites.
Nucleic Acids Res 1996, 24:
238-241.