Báo cáo y học: " The SeqFEATURE library of 3D functional site models: comparison to existing methods and applications to protein function annotation" pot
Bạn đang xem bản rút gọn của tài liệu. Xem và tải ngay bản đầy đủ của tài liệu tại đây (1.46 MB, 19 trang )
Genome Biology 2008, 9:R8
Open Access
2008Wuet al.Volume 9, Issue 1, Article R8
Method
The SeqFEATURE library of 3D functional site models: comparison
to existing methods and applications to protein function annotation
Shirley Wu
*
, Mike P Liang
†
and Russ B Altman
*‡§
Addresses:
*
Program in Biomedical Informatics, Stanford University, Stanford, CA, 94305 USA.
†
Google, Inc., Amphitheatre Pkwy, Mountain
View, CA, 94043 USA.
‡
Department of Genetics, Stanford University, Stanford, CA, 94305 USA.
§
Department of Bioengineering, Stanford
University, Stanford, CA, 94305 USA.
Correspondence: Russ B Altman. Email:
© 2008 Wu et al.; licensee BioMed Central Ltd.
This is an open access article distributed under the terms of the Creative Commons Attribution License ( which
permits unrestricted use, distribution, and reproduction in any medium, provided the original work is properly cited.
SeqFEATURE: protein function annotation tool<p>SeqFEATURE, a tool for protein function annotation, models protein functions described by sequence motifs using a structural repre-sentation. The tool shows significantly improved performance over other methods when sequence and structural similarity are low. </p>
Abstract
Structural genomics efforts have led to increasing numbers of novel, uncharacterized protein
structures with low sequence identity to known proteins, resulting in a growing need for structure-
based function recognition tools. Our method, SeqFEATURE, robustly models protein functions
described by sequence motifs using a structural representation. We built a library of models that
shows good performance compared to other methods. In particular, SeqFEATURE demonstrates
significant improvement over other methods when sequence and structural similarity are low.
Background
With the complete genomes sequenced for an increasing
number of organisms, emphasis is shifting from identifying
genes and gene products to understanding protein function
and the interactions between biological entities on a systems
level. Molecular-level descriptions of cellular physiology are
critical for elucidating biological processes and manipulating
them for medical or industrial purposes, such as bioremedia-
tion or drug design. In particular, the three-dimensional
structures of proteinsprovide clues about their functions and
how function may be manipulated by mutation or with small
molecule chemicals. With protein structure determination
becoming more efficient, the number of available structures is
growing rapidly. The emergence of structural genomics [1],
which aims to solve a representative set of proteins covering
the entire space of naturally occurring structural folds, has
spurred this growth, and depositions in the Protein Data
Bank (PDB) [2] from structural genomics projects accounted
for 16% of new structures in 2006, almost double the percent-
age in 2003 [3]. Structural genomics data and targets from
almost all structural genomics centers are stored centrally in
TargetDB [4], a database accessible from the PDB.
Because a major goal of structural genomics is to sample the
entire protein structure space, many of the structural genom-
ics centers target proteins with novel folds and low sequence
identity to known proteins. The number of structures
released per year by structural genomics has grown to almost
1,400 in 2007, with about 50% of these having less than 30%
sequence identity to the rest of the PDB [3]. The consequence
of this growth is that many of the new structures being depos-
ited into the PDB lack functional annotation. Learning the
functions of these new proteins will enable us to take best
advantage of structural genomics efforts, but using conven-
tional experimental methods can be tremendously time-con-
suming and expensive without testable hypotheses. As the
field of structural genomics matures, the bottleneck from
structure determination to functional annotation will become
more pronounced. Automated function prediction programs
would greatly alleviate this problem by providing clues and
focusing investigation.
Published: 16 January 2008
Genome Biology 2008, 9:R8 (doi:10.1186/gb-2008-9-1-r8)
Received: 1 August 2007
Revised: 21 November 2007
Accepted: 16 January 2008
The electronic version of this article is the complete one and can be
found online at />Genome Biology 2008, 9:R8
Genome Biology 2008, Volume 9, Issue 1, Article R8 Wu et al. R8.2
Many function prediction programs exist, ranging from those
that describe general physicochemical properties of proteins
to those that characterize functional domains or predict spe-
cific enzymatic activity. The majority of predictors use pri-
mary sequence, and the simplest method is to use a sequence
alignment algorithm such as BLAST [5], since high sequence
similarity is almost always indicative of evolutionary - and,
often times, functional - conservation. Wilson et al. [6]
showed that precise function can be transferred reliably
above 40% and broad functional class above 25% sequence
identity. In addition, many tools take advantage of curated
databases, such as the manually inspected profile-Hidden
Markov Models (HMMs) contained in the Pfam database of
protein families [7], and PROSITE, which consists of manu-
ally built sequence patterns and profiles [8].
Both Pfam and PROSITE are contained within InterPro
[9,10], a comprehensive, integrated resource for protein
sequence information that provides many databases and
tools for protein function and domain recognition. Among the
tools offered are other HMM-based methods [11] such as
HMMTigr, built on the TIGRFAMs database [12], and
HMMPanther, built on the PANTHER database [13], both of
which focus on function-based classification. Superfamily
[14], another HMM-based tool hosted on InterPro, classifies
sequences using manually curated models built from the
Structural Classification of Proteins (SCOP) [15]. As a com-
plement to Superfamily, Gene3D [16] is a semi-manually
curated set of models built using the CATH protein structure
classification [17].
Sequence-based tools often provide useful information about
function, but they may be less well suited to cases where
sequence identity is low. Under these circumstances, struc-
ture-based tools may detect functional signals that sequence-
based methods are unable to capture due to sequence diver-
gence. Since a protein's structure and function are inexorably
linked, structure-based tools can abstract out those elements
that are necessary for defining a particular function inde-
pendent of the linear sequence, lending a degree of sensitivity
and specificity that may improve over sequence-based tools.
The abstractions can range in scale from entire secondary
structure elements to residue or atom-based features. Func-
tion annotation based on structure is usually limited to recog-
nition of either general folds or low-level molecular functions
such as binding sites and active sites; it is unlikely routinely
to predict the overall biological pathways and processes in
which a protein participates. However, a complete under-
standing of structural environments and binding and active
site properties provides a pyramid of evidence for the func-
tional roles of a protein.
A number of structure-based function prediction methods
have been developed to take advantage of the surge of new
protein structures. Some of these rely on expert knowledge
for defining the features useful for classifying a particular
functional site, while others learn the important features
through supervised machine learning approaches. An exam-
ple of the former is Fuzzy Functional Forms [18], which are
three-dimensional descriptions of functional sites based on
conserved geometry, protein conformation, and residue iden-
tity. The descriptions are built by hand using information
from solved crystal structures and published literature, and
were able to help identify functional sites in structures whose
sequence similarity to known proteins was low enough to
render sequence-based tools ineffective [19].
Constructing models manually is time-consuming, however,
and several more tractable methods have since been devel-
oped. ProKnow [20] uses features extracted from sequence or
structure via established tools such PSI-BLAST [21], DALI
[22], PROSITE, and the Database of Interacting Proteins
(DIP) [23] to map proteins to functional terms in the Gene
Ontology (GO) [24]. An alternative method by Polacco and
Babbitt [25], called Genetic Algorithm Search for Patterns in
Structures, or GASPS, constructs short three-dimensional
motifs of functional sites consisting of conserved residues
through an iterative mutation and selection process. Second-
ary Structure Matching (SSM) uses a graph-based represen-
tation of secondary structure to find similar structural
matches to a query structure from the PDB [26]. Laskwoski et
al. [27] presented the idea of 3D templates, which are spatial
arrangements of three residues representative of functional
sites or ligand-binding sites. These can be built from known
examples and matched to the query, or the query structure
itself can be broken into 'reverse' templates and matched
against the PDB.
Perhaps the most ambitious solution to the problem of auto-
mated function prediction is ProFunc [28]. Combining about
a dozen different sequence and structure-based methods,
including database pattern searches, SSM, and 3D templates,
ProFunc offers an impressively complete arsenal of methods
for function prediction in one convenient, web-based tool. A
recent study tested ProFunc's usefulness in predicting func-
tion for structural genomics targets and found that SSM and
3D templates were most effective [29]. To determine correct-
ness of their predictions, they compared GO terms between
the query and potential hit.
One difficulty with evaluating the performance of function
prediction methods is the complex way in which protein func-
tion is defined. Function commonly describes specific enzy-
matic activities such as isomerization or phosphorylation, but
it also encompasses binding to macromolecules or cofactors,
modification sites for the attachment of lipids or other mole-
cules, and general association in a biological pathway or com-
plex. Although there are many classification schemes that
cover one or more types of function, there is no functional
classification describing all types of function that allows com-
parisons between different levels of the classification. The
Enzyme Commission (EC) system [30] is widely accepted for
Genome Biology 2008, Volume 9, Issue 1, Article R8 Wu et al. R8.3
Genome Biology 2008, 9:R8
enzyme classification, but it does not describe non-enzymatic
functions or take into account sequence conservation or
mechanism, which can indicate an evolutionary relationship
[31]. The GO database is comprehensive and its terms are
extremely popular for biological annotation, but it is difficult
to compare terms when function predictions are made at dif-
ferent levels of the GO hierarchy.
The outputs of function prediction methods are also difficult
to compare; for example, SSM returns an entire structure or
portion of a structure that matched the query, while 3D tem-
plates returns either a precise prediction of function at a
three-dimensional location in the query, or a protein contain-
ing similar residue geometry to the query, depending on the
type of template chosen. The ambiguity behind the concept of
'function' and even its location in a structure with the con-
comitant diversity of frameworks and outputs make it very
challenging to compare the performance of different meth-
ods. By restricting a comparison to a subset of functions that
is relatively well defined, however, such as enzymatic func-
tions, one can gain an impression of how each method
performs.
Here, we present and apply SeqFEATURE, an automated
method for protein function annotation from structure that is
an extension of FEATURE, a more general framework pub-
lished previously [32]. FEATURE models the local three-
dimensional microenvironment surrounding functional sites
and is, therefore, mostly independent of sequence or struc-
ture homology. Although FEATURE performs well [33], the
need for manually curated sets of positive training examples
may limit its utility. SeqFEATURE addresses this limitation
by automatically extracting training sets from the PDB using
sequence motifs as seeds [34]. The FEATURE framework
models three-dimensional motifs using physical and chemi-
cal properties, and thus attempts to generalize the one-
dimensional motif by recognizing similar three-dimensional
environments that do not share significant one-dimensional
similarity. We have used SeqFEATURE to build a library of
functional site models from PROSITE motifs and evaluated
its performance through cross-validation. Importantly, we
also compared SeqFEATURE to PROSITE, Pfam, HMMPan-
ther, Gene3D, SSM and 3D templates, and further examined
each method's performance in low sequence identity and low
structural similarity situations.
As a first step in aiding structural genomics and function pre-
diction efforts, we have applied SeqFEATURE in a compre-
hensive scan of the entire PDB and focused our analysis on
structures from the TargetDB repository of structural genom-
ics targets. We report several interesting case studies from
this analysis and compare SeqFEATURE's predictions to
those of other methods. All data from the scan and all of the
functional site models created to date are available for down-
load [35]. Additionally, one can scan any structure in PDB
format with the full library of SeqFEATURE models.
Results
We built a library of 3D functional site models using the FEA-
TURE algorithm applied to training sets extracted automati-
cally through sequence motifs found in the PDB. The library
was evaluated using cross-validation and compared to exist-
ing sequence and structure-based function prediction meth-
ods. We also investigated potential functions for structures
with unknown function.
SeqFEATURE model library
The SeqFEATURE library consists of 136 models derived
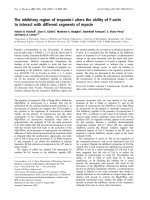
from 53 PROSITE patterns (Table 1). Of these models, 105
(77%) have an AUC greater than 0.8, and 64 (47%) have an
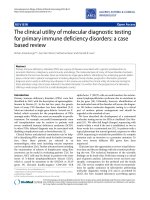
area under the curve (AUC) greater than 0.95 (Figure 1a).
Sensitivity at the default 99% specificity cutoff is slightly
more variable, but 82% of the models have sensitivity greater
than 0.5 and 59% have sensitivity greater than 0.75 (Figure
1b).
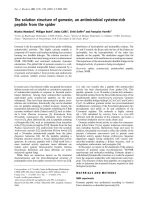
Receiver operating characteristic (ROC) curves from cross-
validation and Z-score distributions of the final models can be
used together to evaluate the ability of the model to distin-
guish true sites from the background. We evaluate the sepa-
ration between the positive and negative sites by plotting the
distributions of Z-scores for the positive and negative training
examples. Plots of positive predictive value (PPV) versus sen-
sitivity give the proportion of total hits to the models that are
true positives as a function of sensitivity. Representative
examples of ROC curves, PPV versus sensitivity curves, and
Z-score distributions for a range of model performances are
shown in Figure 2.
Table 2 lists the top 25 performing SeqFEATURE models
ranked by AUC. The sensitivity of these models is, in general,
very high, especially at the default 99% specificity Z-score cut-
offs. Even at 100% specificity over half of the models have
greater than 0.75 sensitivity. This list also contains a wide
range of PROSITE patterns, indicating that the method per-
forms very well for many different types of functional sites.
Methods comparison
Cross-validation is not necessarily representative of how a
model will perform on independent test data. In order to get
a more realistic estimate of the library's performance, we con-
structed a specialized test set from the PROSITE records for
each pattern, which contain manually curated annotations of
true positives, false positives, and false negatives. The test
sets consisted, therefore, of structures that the associated
PROSITE pattern is known to detect correctly, falsely predict,
and altogether miss.
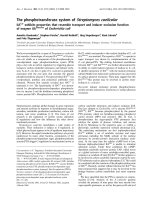
Importantly, we could directly compare if and where SeqFEA-
TURE outperforms the originating PROSITE pattern. Figure
3a-c show the numbers of true positives, false negatives, and
false positives predicted by SeqFEATURE at varying specifi-
city-based score cutoffs compared to the corresponding
Genome Biology 2008, 9:R8
Genome Biology 2008, Volume 9, Issue 1, Article R8 Wu et al. R8.4
Table 1
SeqFEATURE models built from PROSITE motifs
PROSITE pattern Position(s) Residue Atom(s)
2FE2S_FERREDOXIN 1, 6, 9 Cys SG
4FE4S_FERREDOXIN 1, 3, 5, 7 Cys SG
AA_TRANSFER_CLASS_1 4 Lys NZ
AA_TRANSFER_CLASS_2 4 Lys NZ
AA_TRANSFER_CLASS_3 19 Lys NZ
ADH_SHORT 3 Tyr OH
ADH_ZINC 2 His ND1, NE2
ADX 6, 9 Cys SG
ALDEHYDE_DEHYDR_CYS 6 Cys SG
ALDEHYDE_DEHYDR_GLU 2 Glu OE1, OE2
ASP_PROTEASE 4 Asp OD1, OD2
ASX_HYDROXYL 3 Asn ND2, OD1
BETA_LACTAMASE_A 5 Ser OG
BETA_LACTAMASE_B_1 4, 6 His ND1, NE2
8 Asp OD1, OD2
BPTI_KUNITZ_1 4, 8 Cys SG
C_TYPE_LECTIN_1 1 Cys SG
CARBOXYLESTERASE_B_1 11 Ser OG
CARBOXYLESTERASE_B_2 3 Cys SG
CHITINASE_18 9 Glu OE1, OE2
COPPER_BLUE 11 His ND1, NE2
7CysSG
CYTOCHROME_P450 8 Cys SG
EF_HAND 1, 3, 5, 9 Asp OD1, OD2
7, 12 Tyr OH
3, 5, 9 Asn ND2, OD1
5, 9 Ser OG
7, 9 Thr OG1
7 Glu OE1, OE2
7LysNZ
EGF_1 1, 3, 7 Cys SG
EGF_2 1, 3, 8 Cys SG
GLYCOSYL_HYDROL_F10 7 Glu OE1, OE2
Genome Biology 2008, Volume 9, Issue 1, Article R8 Wu et al. R8.5
Genome Biology 2008, 9:R8
GLYCOSYL_HYDROL_F5 7 Glu OE1, OE2
HIPIP 1, 7 Cys SG
HMA_1 5, 8 Cys SG
IG_MHC 3 Cys SG
IMP_1 4 Asp OD1, OD2
KAZAL 1, 3, 7, 9 Cys SG
LIPASE_SER 7 Ser OG
LIPOYL 9 Lys NZ
PA2_HIS 4 His ND1, NE2
PEROXIDASE_1 8 His ND1, NE2
PEROXIDASE_2 8 His ND1, NE2
PHOSPHOPANTETHEINE 6 Ser OG
PROTEIN_KINASE_ST 5 Asp OD1, OD2
PTS_HPR_SER 5 Ser OG
RNASE_T2_1 4 His ND1, NE2
SHIGA_RICIN 5 Glu OE1, OE2
8 Arg NE, NH1, NH2
SMALL_CYTOKINES_CC 1, 2, 11, 17 Cys SG
SNAKE_TOXIN 2, 4, 7, 8 Cys SG
SUBTILASE_ASP 5 Asp OD1, OD2
THIOL_PROTEASE_ASN 6 Asn ND2, OD1
THIOL_PROTEASE_HIS 3 His ND1, NE2
THIOREDOXIN 8, 11 Cys SG
TRYPSIN_HIS 5 His ND1, NE2
TRYPSIN_SER 6 Ser OG
TYR_PHOSPHATASE_1 3 Cys SG
UBIQUITIN_CONJUGAT_1 10 Cys SG
ZINC_FINGER_C2H2_1 1, 3 Cys SG
7, 9 His ND1, NE2
ZINC_PROTEASE 3, 7 His ND1, NE2
4 Glu OE1, OE2
Some PROSITE patterns have multiple functional residues, and so more than one model was built for these patterns (for example, multiple
EF_HAND models are built). Many hits will score high on all models, but distantly related sites may hit only a subset. SeqFEATURE models are
named by concatenating the PROSITE-PATTERN, POSITION, RESIDUE and ATOM for unambiguous identification.
Table 1 (Continued)
SeqFEATURE models built from PROSITE motifs
Genome Biology 2008, 9:R8
Genome Biology 2008, Volume 9, Issue 1, Article R8 Wu et al. R8.6
PROSITE pattern. Figure 4 shows overall numbers of predic-
tions in each category. Since the test sets were derived from
PROSITE, the PROSITE values represent the maximum that
could possibly be obtained for each type of prediction. While
SeqFEATURE does not predict all true positives correctly, it
predicts 82% of true positives correctly at the default 99%
specificity cutoff. At the same cutoff, SeqFEATURE also
predicts about 78% fewer false negatives than PROSITE, and
about 60% fewer false positives.
When we compared performance between SeqFEATURE,
Pfam, HMMPanther, and Gene3D (restricting the compari-
son to the high confidence assigned patterns for each
sequence-based method as described in Materials and meth-
ods), we found Gene3D to be the best performing method by
far, with sensitivity just over 98%, specificity at 85.4%, and
PPV at 99% (Table 3). Pfam was the second most sensitive
method at 93.7%; since it predicted all negative examples
(PROSITE false positives) correctly, Pfam had a PPV of 100%.
HMMPanther scored slightly below Pfam on its limited test
set with a sensitivity of 91.9%; there were not enough exam-
ples to evaluate specificity. SeqFEATURE had a sensitivity of
86.2% at our most lenient cutoff, and specificity and PPV
comparable to Pfam and Gene3D at our more stringent cut-
offs. Interestingly, all of the sequence-based methods show a
marked decrease in sensitivity when evaluated only on posi-
tive examples that did not contain the PROSITE motif (that is,
PROSITE false negatives). SeqFEATURE, on the other hand,
is not as significantly affected by whether the test proteins
contain the canonical sequence motifs.
On the randomized sample test set (see Materials and meth-
ods), we were able to compare SeqFEATURE to 3D templates
and SSM (Table 4). Here, SeqFEATURE's best sensitivity
increased to 93%, though its best specificity dropped to 93%.
PPV decreased slightly to 94% at the most stringent cutoff. 3D
templates performed most well out of the structure-based
methods, with 90% sensitivity, 100% specificity, and a PPV of
100%. SSM performed similarly to SeqFEATURE.
Importantly, however, since the goal of many function predic-
tion methods, including SeqFEATURE, is to aid in annotation
of solved structural genomics targets, we also compared
SeqFEATURE to the sequence-based methods using low
sequence identity test sets to mimic the situation in which a
newly solved structure has low sequence identity to proteins
of known function. Table 3 shows the sensitivities of
PROSITE, Gene3D, Pfam, HMMPanther and SeqFEATURE
at 95% and 99% specificity cutoffs for test sets filtered at 25%,
30%, and 35% sequence identity to the training set. The
sequence-based methods perform less well, particularly on
sequences filtered at 30% and 25% identity. In contrast,
SeqFEATURE achieves a sensitivity of 92.3% at the most
lenient cutoff and 84.6% at the moderate cutoff for sequences
with <25% sequence identity to the training sets. As shown in
Figure 5, the sensitivity of sequence-based methods decreases
directly in proportion to sequence identity, whereas the sen-
sitivity of SeqFEATURE at all three cutoffs shows no down-
ward trend. The observation that SeqFEATURE's
performance remains robust reflects the fact that SeqFEA-
TURE's true positive predictions are concentrated at lower
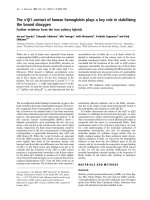
Distribution of AUC and sensitivity for all SeqFEATURE models listed in Table 2Figure 1
Distribution of AUC and sensitivity for all SeqFEATURE models listed in Table 2. (a) Distribution of model AUC. Most models have AUC greater than 0.8,
with 47% having AUC >0.95 and a few poor performers less than 0.5. (b) Distribution of model sensitivity. We plot the sensitivity of each model at the
default score cutoff of 99% specificity based on training data. Most models have a sensitivity greater than 0.6-0.7 at this cutoff, and many have a sensitivity
greater than 0.8.
# of models
30
25
20
15
10
5
0
< 0.5 0.5-
0.6
0.6-
0.7
0.7-
0.8
0.8-
0.9
0.95-
0.99
0.99-
1.00
1.000.9-
0.95
AUC range
(a)
# of models
30
25
20
15
10
5
0
0.0-
0.1
0.1-
0.2
0.2-
0.3
0.3-
0.4
0.4-
0.5
0.6-
0.7
0.7-
0.8
0.8-
0.9
0.5-
0.6
Sensitivity range
(b)
35
40
0.9-
1.0
1.0
Genome Biology 2008, Volume 9, Issue 1, Article R8 Wu et al. R8.7
Genome Biology 2008, 9:R8
sequence identities, suggesting that SeqFEATURE may be
especially valuable in this scenario.
To determine whether the degree of structural similarity
affects how well different methods predict function, we also
constructed a low structural similarity test set using Dali
pairwise matching between members of the low sequence
identity test set and the corresponding positive training sets.
Although relatively small (15 examples), the low structural
similarity test set allows us to approximate the situation of
function prediction on novel folds. As illustrated in Table 4,
SeqFEATURE performs better at the 95% and 99% specificity
cutoffs than the other structure-based methods; its low struc-
tural similarity (LS)-sensitivity is 53% and 47%, respectively,
while the LS-sensitivity values for SSM and 3D templates are
both less than 30%.
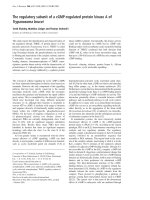
Example ROC curves, precision-recall curves, and Z-score distributions for SeqFEATURE modelsFigure 2
Example ROC curves, precision-recall curves, and Z-score distributions for SeqFEATURE models. A sample of performance plots for
ADH_ZINC.2.HIS.ND1 (top), ASP_PROTEASE.4.ASP.OD1 (middle), and ZINC_FINGER_C2H2_1.9.HIS.ND1 (bottom) are shown, representing a model
with excellent performance, good performance, and somewhat satisfactory performance, respectively. The leftmost plot in each row gives the ROC curve
in red and random performance in blue, the middle plot shows the precision versus recall (sensitivity) curve, and the rightmost plot shows the distribution
of scores for positive sites (red) and negative sites (blue) from training. Because there are many more negative sites than positive sites, the score
distributions on the right are normalized to Z-scores.
0
0.2
0.4
0.6
0.8
1
0 0.2 0.4 0.6 0.8 1
Precision
Recall
ADH_ZINC.2.HIS.ND1
model
0
0.2
0.4
0.6
0.8
1
0 0.2 0.4 0.6 0.8 1
True positive rate
False positive rate
ADH_ZINC.2.HIS.ND1
model avg
x
-0.8
-0.6
-0.4
-0.2
0
0.2
0.4
0.6
0.8
1
-3 -2 -1 0 1 2 3 4 5
Proportion of sites
Z-score
ADH_ZINC.2.HIS.ND1
pos
neg
0
0.2
0.4
0.6
0.8
1
0 0.2 0.4 0.6 0.8 1
True positive rate
False positive rate
ASP_PROTEASE.4.ASP.OD1
model avg
x
0
0.2
0.4
0.6
0.8
1
0 0.2 0.4 0.6 0.8 1
Precision
Recall
ASP_PROTEASE.4.ASP.OD1
model
-0.8
-0.6
-0.4
-0.2
0
0.2
0.4
0.6
0.8
1
-3 -2 -1 0 1 2 3 4 5
Proportion of sites
Z-score
ASP_PROTEASE.4.ASP.OD1
pos
neg
0
0.2
0.4
0.6
0.8
1
0 0.2 0.4 0.6 0.8 1
Precision
Recall
ZINC_FINGER_C2H2_1.9.HIS.ND1
model
0
0.2
0.4
0.6
0.8
1
0 0.2 0.4 0.6 0.8 1
True positive rate
False positive rate
ZINC_FINGER_C2H2_1.9.HIS.ND1
model avg
x
-0.8
-0.6
-0.4
-0.2
0
0.2
0.4
0.6
0.8
1
-4 -3 -2 -1 0 1 2 3 4
Proportion of sites
Z-score
ZINC_FINGER_C2H2_1.9.HIS.ND1
pos
neg
Genome Biology 2008, 9:R8
Genome Biology 2008, Volume 9, Issue 1, Article R8 Wu et al. R8.8
Predictions of function for structural genomics targets
As of November 2007, TargetDB contained about 5,250 tar-
gets with structures released in the PDB; of these, about 1,500
were labeled only with 'structural genomics', 'unknown func-
tion', or 'hypothetical protein' in the PDB file header. Using
the criteria of model AUC > 0.8, maximum score of that
model's negative training set, and minimum score of that
model's positive training set, we found 35 potential functional
sites. We added one more predicted functional site that did
not quite satisfy the criteria but had several such hits for mul-
tiple models for the same function, resulting in a total of 36
high-confidence predictions. We compare our predictions to
those of PROSITE, Pfam, Gene3D, HMMPanther, SSM and
3D templates for the same structures.
In examining these structures, we found that some of them,
though labeled as 'unknown function', actually had some
functional annotation and, thus, we could determine the
plausibility of our prediction. For example, PDB structure
1XRI is described as a putative phosphatase, and had a high
scoring hit for the TYR_PHOSPHATASE_1.3.CYS.SG model.
All of the other methods also detected phosphatase activity.
Another example is 2E72, described as a zinc-finger contain-
ing protein, which hit our ZINC_FINGER_C2H2_1.1.CYS.SG
model and for which Pfam, Gene3D, HMMPanther, SSM, and
3D templates all predicted zinc finger motifs.
More interesting, however, are predictions for structures that
fail to garner any predictions from PROSITE, Pfam, Gene3D,
or HMMPanther. Table 5 presents three of our most intrigu-
ing cases. In all of these cases, only SeqFEATURE gives a
high-confidence prediction, though 3D templates and SSM
sometimes offer matches to putative functions or have low-
confidence predictions. In contrast, the SeqFEATURE pre-
dictions have relatively high Z-scores compared to the train-
ing set distributions.
The local environment surrounding high-confidence pre-
dicted sites in three TargetDB structures are shown in Figure
6 alongside positive training set examples of the correspond-
Table 2
Top 25 performing SeqFEATURE models
Model name AUC Z-cutoff-100 Sens-100 Z-cutoff-99 Sens-99 Z-cutoff-95 Sens-95 No. of examples
ADH_ZINC.2.HIS.ND1 1.0000 3.4172 1.0000 2.4184 1.0000 1.7128 1.0000 6
CARBOXYLESTERASE_B_1.11.SER.O
G
1.0000 5.2823 1.0000 2.5415 1.0000 1.7047 1.0000 6
GLYCOSYL_HYDROL_F5.7.GLU.OE1 1.0000 3.8385 1.0000 2.7188 1.0000 1.8787 1.0000 6
HIPIP.7.CYS.SG 1.0000 4.8473 1.0000 2.7401 1.0000 1.7795 1.0000 5
RNASE_T2_1.4.HIS.NE2 1.0000 4.0910 1.0000 2.6209 1.0000 1.6521 1.0000 5
THIOL_PROTEASE_ASN.6.ASN.ND2 1.0000 3.8379 1.0000 2.5982 1.0000 1.8237 1.0000 5
THIOL_PROTEASE_ASN.6.ASN.OD1 1.0000 4.1252 1.0000 2.6255 1.0000 1.7985 1.0000 5
TYR_PHOSPHATASE_1.3.CYS.SG 1.0000 5.4246 1.0000 2.7473 1.0000 1.7596 1.0000 8
CYTOCHROME_P450.8.CYS.SG 1.0000 4.1254 0.8333 2.4019 1.0000 1.7526 1.0000 12
PEROXIDASE_2.8.HIS.ND1 0.9999 3.6628 0.8000 2.6225 1.0000 1.7515 1.0000 5
BPTI_KUNITZ_1.8.CYS.SG 0.9999 3.5059 0.8333 2.2843 1.0000 1.7820 1.0000 6
4FE4S_FERREDOXIN.5.CYS.SG 0.9999 2.7500 0.4000 1.5623 1.0000 1.2660 1.0000 17
ADH_SHORT.3.TYR.OH 0.9999 5.0745 0.1176 2.2891 1.0000 1.6249 1.0000 20
TRYPSIN_SER.6.SER.OG 0.9998 5.4646 0.0000 2.1696 1.0000 1.6085 1.0000 17
GLYCOSYL_HYDROL_F5.7.GLU.OE2 0.9998 3.9203 0.8333 2.6280 1.0000 1.8757 1.0000 6
4FE4S_FERREDOXIN.1.CYS.SG 0.9998 3.1084 0.1000 2.0501 1.0000 1.5589 1.0000 20
PEROXIDASE_2.8.HIS.NE2 0.9997 3.9233 0.6000 2.5753 1.0000 1.8144 1.0000 5
BETA_LACTAMASE_B_1.6.HIS.ND1 0.9997 5.3466 0.8000 2.7205 1.0000 1.7821 1.0000 5
ADH_ZINC.2.HIS.NE2 0.9996 3.8970 0.6667 2.4840 1.0000 1.7499 1.0000 6
LIPASE_SER.7.SER.OG 0.9995 4.7293 0.6250 2.5387 1.0000 1.7350 1.0000 8
ASP_PROTEASE.4.ASP.OD2 0.9994 3.7837 0.4706 2.2973 1.0000 1.7238 1.0000 17
IMP_1.4.ASP.OD2 0.9994 3.9608 0.6000 2.5508 1.0000 1.8129 1.0000 5
BETA_LACTAMASE_B_1.4.HIS.ND1 0.9993 3.8683 0.8000 2.6032 1.0000 1.8239 1.0000 5
BETA_LACTAMASE_B_1.8.ASP.OD1 0.9991 4.6363 0.6000 2.9202 1.0000 1.8558 1.0000 5
4FE4S_FERREDOXIN.3.CYS.SG 0.9991 3.4191 0.0000 2.0044 0.9500 1.4919 1.0000 20
For each model, we report (from left to right) the AUC, the Z-score for which all negatives are correctly predicted, the sensitivity (Sens) at this Z-
score, the Z-score for which 99% of negatives are correctly predicted, the associated sensitivity, and the Z-score and associated sensitivity for 95%.
The final column reports the number of positive examples of the one-dimensional motif found in the ASTRAL40 compendium of the PDB.
Genome Biology 2008, Volume 9, Issue 1, Article R8 Wu et al. R8.9
Genome Biology 2008, 9:R8
ing SeqFEATURE model. Figure 6a shows 2EJQ, a conserved
hypothetical protein from Thermo thermophilus to the right
of 1KAP, a zinc metalloprotease from Pseudomonas aerugi-
nosa. SeqFEATURE predicts an environment similar to that
of a zinc protease, and, indeed, the two environments share
the presence of two histidine residues and a number of nega-
tive charges in the vicinity of the site, as well as some common
secondary structures. The other two cases are both predic-
tions of calcium binding. 2OGF, an uncharacterized structure
from Methanococcus janaschii, is compared to 1FI6, the cal-
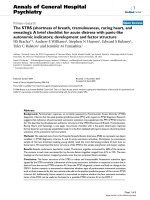
Performance on PROSITE true positives, false positives, and false negative test sitesFigure 3
Performance on PROSITE true positives, false positives, and false negative test sites. We show the (a) true positive (TP), (b) false negative (FN), and (c)
false positive (FP) prediction rates for SeqFEATURE (at 95%, 99%, and 100% specificity) and PROSITE on test sites derived from the corresponding
PROSITE patterns. The PROSITE values represent the maximum possible for each category. Not all patterns had a false negative or false positive test set.
Most of SeqFEATURE's incorrect predictions at 95% and 99% specificity cutoffs arise from poor performance on a small subset of the patterns.
SeqF_100
SeqF_99
SeqF_95
0
10
20
30
40
50
60
70
80
PROSITE
2FE2S_FERREDOXIN
4FE4S_FERREDOXIN
AA_TRANSFER_CLASS_1
AA_TRANSFER_CLASS_3
ADH_SHORT
ADH_ZINC
ADX
ASP_PROTEASE
ASX_HYDROXYL
BETA_LACTAMASE_A
BETA_LACTAMASE_B_1
BPTI_KUNITZ
CARBOXYLESTERASE_B_1
CARBOXYLESTERASE_B_2
CHITINASE_18
COPPER_BLUE
CYTOCHROME_P450
C_TYPE_LECTIN
EF_HAND
EGF_1
EGF_2
GLYCOSYL_HYDROL_F5
GLYCOSYL_HYDROL_F10
HIPIP
HMA_1
IG_MHC
IMP_1
KAZAL
LIPASE_SER
PEROXIDASE_2
PROTEIN_KINASE_ST
SHIGA_RICIN
SMALL_CYTOKINES_CC
SNAKE_TOXIN
SUBTILASE_ASP
THIOL_PROTEASE_ASN
THIOREDOXIN
TRYPSIN_SER
TYR_PHOSPHATASE_1
UBIQUITIN_CONJUGAT
ZINC_FINGER_C2H2_1
ZINC_PROTEASE
# of TP predictions
0
2
4
6
8
10
12
# of FN predictions
0
2
4
6
8
10
12
# of FP predictions
(a)
(b)
(c)
2FE2S_FERREDOXIN
4FE4S_FERREDOXIN
AA_TRANSFER_CLASS_1
AA_TRANSFER_CLASS_3
ADH_SHORT
ADH_ZINC
ASP_PROTEASE
ASX_HYDROXYL
BETA_LACTAMASE_A
BETA_LACTAMASE_B_1
BPTI_KUNITZ
CARBOXYLESTERASE_B_1
CARBOXYLESTERASE_B_2
CHITINASE_18
COPPER_BLUE
CYTOCHROME_P450
C_TYPE_LECTIN
EF_HAND
EGF_1
EGF_2
GLYCOSYL_HYDROL_F5
GLYCOSYL_HYDROL_F10
HMA_1
IG_MHC
IMP_1
KAZAL
LIPASE_SER
PEROXIDASE_2
PROTEIN_KINASE_ST
SHIGA_RICIN
SMALL_CYTOKINES_CC
SNAKE_TOXIN
SUBTILASE_ASP
THIOL_PROTEASE_ASN
THIOREDOXIN
TRYPSIN_SER
TYR_PHOSPHATASE_1
UBIQUITIN_CONJUGAT
ZINC_FINGER_C2H2_1
ZINC_PROTEASE
ADX
HIPIP
Genome Biology 2008, 9:R8
Genome Biology 2008, Volume 9, Issue 1, Article R8 Wu et al. R8.10
cium-binding domain of a protein involved in Ras signal
transduction; 2OX6, an uncharacterized gene product from
Shewanella oneidensis, is compared to 1K8U, a calcium reg-
ulatory protein. Both positive examples show an abundance
of negative charges about five to seven angstroms from the
motif residue. The predicted sites show comparable distribu-
tions of negative charges and contain loop structures similar
to the positive examples. These three, in addition to
SeqFEATURE's significant predictions for other TargetDB
structures with unknown function, are especially interesting
and warrant further study. All significant predictions for Tar-
getDB structures are publicly available [36].
Protein Data Bank scan
We additionally scanned every structure in the PDB - about
100 million potential sites - with every SeqFEATURE model.
When we consider only those scores that came from models
with an AUC of at least 0.95, and were greater than the 99%
specificity cutoff defined for that model, 440,460 scores fit
these criteria, or about 0.5% of the total number of scores
generated. Filtering out redundant scores from proteins with
multiple chains results in 298,870 predictions in 29,668
structures. The raw data from the scan are available for down-
load [36]; further analysis of these predictions is beyond the
scope of this paper. To access the full library scan for one
structure, the user may query by PDB ID; alternatively, one
can access all results by querying for a specific SeqFEATURE
model.
Discussion
SeqFEATURE extends earlier work on characterizing func-
tional sites in protein structures by automating training set
selection. We have used it to build a library of three-dimen-
sional functional site models, 77% of which have an AUC
greater than 0.8. When tested on untrained but known true
positives, false positives, and false negatives from their corre-
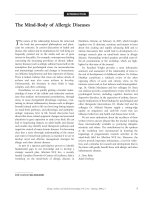
Summary performance on PROSITE true positives (TP), false positives (FP), and false negative (FN) test sitesFigure 4
Summary performance on PROSITE true positives (TP), false positives
(FP), and false negative (FN) test sites. We summarize total numbers of
predicted true positives, false negatives, and false positives for PROSITE
and SeqFEATURE at 100%, 99%, and 95% specificity cutoffs. SeqFEATURE
(at the default 99% specificity cutoff) misses about 18% of the PROSITE
true positives on average, but it also predicts 60% fewer false positives and
78% fewer false negatives than PROSITE. The three different specificity
cutoffs also show tradeoffs in the numbers of true positives and false
predictions made by SeqFEATURE, demonstrating that one can adjust the
cutoff to fit desired performance. For example, one can attain a very high
positive predictive value by using SeqFEATURE's 100% specificity cutoffs -
although sensitivity decreases to about 50%, almost no false positive
predictions are made.
0
100
200
300
400
500
600
700
800
SeqF_100
SeqF_99
SeqF_95
PROSITE
FPFNTP
# of predictions
Table 3
Comparison of SeqFEATURE (at three specificity-based score cutoffs) to Gene3D, Pfam, and HMMPanther (Panther)
Gene3D Pfam Panther SeqF_95 SeqF_99 SeqF_100
True positive sensitivity 0.998 0.937 0.919 0.862 0.821 0.492
False negative sensitivity 0.907 0.704 0.532 0.831 0.775 0.282
Overall (TP + FN) sensitivity 0.983 0.898 0.831 0.857 0.814 0.457
(False positive) specificity 0.854 1.000 - 0.452 0.603 0.973
Positive predictive value 0.990 1.000 - 0.948 0.960 0.995
Sensitivity at <35% seq-ID 0.925 0.761 0.639 0.769 0.699 0.316
Sensitivity at <30% seq-ID 0.869 0.738 0.618 0.869 0.783 0.400
Sensitivity at <25% seq-ID 0.600 0.467 0.250 0.933 0.786 0.429
We calculated the sensitivity (on PROSITE true positives (TP), PROSITE false negatives (FN), and overall), specificity, PPV, and sensitivity at varying
levels of sequence identity for each method using the portion of the test set corresponding to the coherent patterns for that method. Bold values
indicate the top three performing methods for that row. The sequence-based methods are expected to do very well since they have the advantage of
abundant sequence data for modeling functional families. SeqFEATURE performs relatively less well in sensitivity and specificity, but is still very
competitive, especially with regards to positive predictive value and false negative sensitivity. At lower sequence identities, Gene3D outperforms all
other methods at sequence identities greater than 30%, but SeqFEATURE remains robust throughout and, in particular, shows better performance
than Gene3D and Pfam when sequence identity is less than 30%. SeqFEATURE is the best performing method by far when the proteins have less than
25% sequence identity to the training set.
Genome Biology 2008, Volume 9, Issue 1, Article R8 Wu et al. R8.11
Genome Biology 2008, 9:R8
sponding PROSITE patterns, many models correctly classi-
fied all of the true positives and some of the false negatives,
and had fewer false positive predictions than the pattern.
Even when a model failed to recapitulate every PROSITE true
positive, it often correctly predicted proteins that the
PROSITE pattern missed.
Furthermore, we show that although SeqFEATURE demon-
strates slightly lesser performance than the sequence-based
methods overall, it exhibits useful performance trends as
sequence identity to proteins of known function decreases.
SeqFEATURE, and perhaps structure-based methods in gen-
eral, should be most valuable in these scenarios, since they
sense three-dimensional atomic environments rather than
the sequences that fold to create those environments. We
observe that this advantage is strongest when the sequence
identity is less than 30%, which is well-documented as the
'twilight zone' of sequence analysis [37].
When we further investigate this region of low identity, we see
that SSM and 3D templates do not perform as well as
SeqFEATURE on the low structural similarity test set. SSM is
essentially a fold-matching algorithm, and at low structural
similarities the folds of the test structures likely differed sig-
nificantly from those folds most representative of proteins
with the function in question. Theoretically, the 3D template
method is more similar to SeqFEATURE, but in reality it per-
formed similarly to SSM. It is possible that the residue triads
that 3D templates detect were dependent on exact conserva-
tion of sequence features. In contrast, SeqFEATURE was less
affected by the reduction in structural similarity because it
depends less on specific sequences or arrangements of resi-
dues, and instead incorporates abstract physical and chemi-
cal properties in a locally defined region.
Determining how different methods compare in predicting
function is a challenging task, and so neither our procedure
for comparing methods nor the interpretation of the compar-
ison's results is straightforward. Function itself is broadly
defined and does not lend itself easily to straightforward or
computable classification schemes. Many classifications are
applicable only to specific types of functions and can differ in
the scope of their descriptions, ranging from whole domain
labels on sequence (for example, Pfam) to exact locations in
structures (for example, SeqFEATURE or 3D templates).
Responding to this diversity in description and classification,
we made several choices in our comparison of sequence and
structure-based methods, each of which carries a certain
amount of bias.
In comparing Pfam, HMMPanther, and Gene3D to other
methods, for example, we restricted the evaluation to those
functions (PROSITE patterns, specifically) whose SeqFEA-
TURE positive training sets mapped unambiguously to the
corresponding database assignment. This may have artifi-
cially boosted performance of the sequence-based methods,
Table 4
Comparison of SeqFEATURE (at three specificity-based score cutoffs) to 3D templates and SSM
3D templates SSM SeqF_95 SeqF_99 SeqF_100
Sensitivity 0.897 0.724 0.931 0.862 0.552
Specificity 1.000 0.933 0.600 0.667 0.933
PPV 1.000 0.955 0.818 0.833 0.941
LSS-sensitivity 0.200 0.267 0.533 0.467 0.133
We calculated the sensitivity, specificity, and PPV for SeqFEATURE, 3D templates, and SSM using a random subset of 29 positive and 15 negative
structures. Additionally, we calculated sensitivity for each method on a low structural similarity subset ('LSS-sensitivity') of the positive test set. Bold
values indicate the top two performing methods for that row. SeqFEATURE performs relatively less well overall, but when structural similarity is
reduced, SeqFEATURE again is the best performing method.
Table 5
Predicted function for three structures from TargetDB
PDB ID SeqFEATURE model AUC Site Z-score Cutoff Other predictions
2EJQ ZINC_PROTEASE.4.GLU.OE1 0.892 GLU96:A 4.574 -0.074 3D templates: probable anthrax toxin lethal factor
2OGF EF_HAND.9.THR.OG1 0.920 THR17:D 4.675 3.370 SSM: aminopeptidase (Z-score = 2.7)
2OX6 EF_HAND.9.ASN.OD1 0.863 ASN8:B 4.102 2.498 3D templates: probable Zn enzyme
For each target, we provide the PDB identifier, the SeqFEATURE models that best hit the target, the locations hit by those models, the Z-scores, the
corresponding 100% specificity Z-score cutoff for the model, and the predictions made by PROSITE, Pfram, 3D templates, and SSM. TargetDB
structure 2EJQ has a high scoring zinc protease site. 2OGF and 2OX6 both had high scoring hits for calcium binding. Out of the other function
prediction methods, only 3D templates and SSM had any predictions; these, however, were lower confidence.
Genome Biology 2008, 9:R8
Genome Biology 2008, Volume 9, Issue 1, Article R8 Wu et al. R8.12
since we, in effect, considered only patterns with very high
'sensitivity' for each method to begin with based on our train-
ing sets. Interestingly, we also investigated HMMTIGR and
Superfamily as other methods to include in the comparison,
but these tools made very few predictions over the entire set
of training and test structures, so we excluded them from the
study.
Our choice of gold standard test sites from PROSITE may also
be controversial because the test set is limited to those func-
tional patterns that have been manually characterized and are
thus subject to human judgment as well as human preference.
In addition, due to the small number of test sites for most pat-
terns, the results may be dominated by a few patterns with
many test sites. Perhaps most obvious is the high probability
that the negative test sites, by virtue of being defined as false
positives with respect to the PROSITE pattern, are 'difficult
cases'. This means that SeqFEATURE may be predisposed to
low specificity, and specificity for all methods overall may suf-
fer because the negative examples tend to be highly similar to
the positive examples on at least the local sequence level.
The different types of input used to train each method also
have some implications, an important one being that
sequence-based methods currently have much more data
available to them than structure-based ones. Although this
means that the best sequence-based methods currently
outperform structure-based methods on our unfiltered
PROSITE-based test sets, it does not diminish the need for or
value of structure-based methods. Such methods are useful
precisely when sequence identity to known proteins is low, as
shown in our results on low sequence identity test sets and
our analyses on interesting TargetDB predictions.
The two structure-based methods compared here contain an
analogous advantage, however, in that they match the query
against the entire repository of known protein structures.
Thus, if the query has very similar structures (for example,
the same protein from different species) in the PDB, SSM and
3D template searches will very likely result in a high confi-
dence hit to these structures. In cases where the query struc-
ture is completely novel, however, SSM and 3D templates are
expected to do less well, as suggested by their performance on
the low structural similarity test set. SeqFEATURE, on the
other hand, because it does not rely on exactly conserved
geometries or structural motifs, continues to show robust
performance even when the structure does not share signifi-
cant similarity to known proteins.
Another potential bias may come from limiting the structure-
based comparisons to those patterns associated with EC
numbers. In order to determine the correctness of predictions
from SSM and 3D templates, we required a precise functional
classification system. SCOP is a potential alternative evalua-
tion method, but SCOP is a structural classification that does
not always map directly to function, so we chose to use EC
numbers. This, of course, means that the results of the com-
parisons may not be representative of how each method per-
forms on non-enzymatic functions. The use of EC numbers is
also affected by how accurately and completely the PDB is
annotated and by the granularity of function assigned. Sev-
eral of the test structures on which 3D templates and SSM
performed poorly had matches to proteins annotated with
only slightly different EC numbers. Thus, 3D templates and
SSM should still be considered valuable tools for gaining
insight into the potential function of an uncharacterized
protein.
Although the set of patterns and the resulting test sets used
here are by no means fully representative or without bias,
they enabled us to map our SeqFEATURE models directly to
test sets, a non-trivial endeavor given the inconsistency and
variety of existing function classifications. It also allowed us
to look specifically at where SeqFEATURE improves on or
fares worse than the sequence patterns that generated the
models. We often chose test sets with biases against our
method in order to assess its operating characteristics accu-
rately; for example, our use of one-dimensional sequence
Sensitivity trends of SeqFEATURE, Gene3D, Pfam, and HMMPanther at low sequence identitiesFigure 5
Sensitivity trends of SeqFEATURE, Gene3D, Pfam, and HMMPanther at
low sequence identities. We compared the sensitivity of SeqFEATURE at
three specificity cutoffs against the sensitivity of Gene3D, Pfam, and
HMMPanther on test sets filtered for low sequence identity. We evaluated
each method on the subset of the original test set that had less than the
specified sequence identity to the training sets. As sequence identity
decreases, the sequence-based methods show a clear trend towards lower
sensitivity. In contrast, SeqFEATURE at all three cutoffs shows no such
downward trend, indicating robust detection of function even when
sequence identity is very low.
0.0
0.2
0.4
0.6
0.8
1.0
SeqF_100
SeqF_99
SeqF_95
HMMPanther
Pfam
Gene3D
< 25%< 27%< 29%< 31%< 33%< 35%
Sensitivity
sequence identity cutoff
Genome Biology 2008, Volume 9, Issue 1, Article R8 Wu et al. R8.13
Genome Biology 2008, 9:R8
Local environments SqFEATURE predictions for three TargetDB structures with unknown functionFigure 6
Local environments of SeqFEATURE predictions for three TargetDB structures with unknown function. Three predicted functional sites from TargetDB
structures are shown compared to known examples of the predicted function. The predicted and known sites are shown in yellow, positively charge
atoms (nitrogens) are shown in blue, and negatively charged atoms (oxygens) are shown in red. Carbons and secondary structure are shown in grey. All
atoms within 7.5 angstroms of the site are shown. (a) The active site of a known zinc protease (1KAP) is shown to the left of a zinc protease site in 2EJQ
predicted by SeqFEATURE. Note the presence of two histidine residues (one can be seen clearly above each site) and a number of negative charges
distributed throughout both local environments. Note also the similarity in secondary structure. (b) The local structure of 1FI6 (left), which contains a
known EF hand calcium-binding motif, is compared to SeqFEATURE's predicted calcium-binding site in 2OGF. Note the similar distribution of negative
charges and closely matching loop structures. The calcium is visible as a brown sphere in 1FI6, surrounded by oxygen atoms. (c) 1K8U is another known
EF hand containing protein, shown to the left of the uncharacterized protein structure 2OX6, for which SeqFEATURE predicts calcium-binding. These
figures were created using VMD [43].
(a)
(b)
(c)
Genome Biology 2008, 9:R8
Genome Biology 2008, Volume 9, Issue 1, Article R8 Wu et al. R8.14
patterns as the gold standard provides a strong advantage to
sequence-based methods. Restricting the comparison to pat-
terns that mapped coherently to Pfam, Gene3D, and
HMMPanther families may also predispose those methods to
good performance. SeqFEATURE exhibited good perform-
ance despite these biases.
Because SeqFEATURE also focuses on the local microenvi-
ronment around functional sites, it can detect function at
finer detail than fold-matching algorithms such as SSM.
Because it considers both atom-based and physichochemical
properties in addition to residue-based ones, it is also capable
of generalizing function away from sequence and may be able
to detect functional similarities that have converged from dif-
ferent ancestors or that use slightly different residues and a
different overall fold to accomplish similar activities. This
capability is demonstrated by the fact that SeqFEATURE
detects many of the positive examples that the PROSITE pat-
Overview of the SeqFEATURE pipelineFigure 7
Overview of the SeqFEATURE pipeline. SeqFEATURE forms training sets by (a) extracting sequence (one-dimensional) motifs from PROSITE and (b)
identifying the annotated functional amino acids. We extract examples of the one-dimensional motif with known three-dimensional structure in the PDB
and center FEATURE training sites on each functional atom of each functional amino acid annotated in the PROSITE pattern. We choose negative sites
matched for atom density randomly from the PDB that do not contain the function. (c) FEATURE then creates a model of the sites by summarizing the
biochemical and biophysical features found in concentric shells around the functional atom center. (d) The resulting three-dimensional fingerprint specifies
the properties that are in relative abundance or paucity in the site, representing the model. (e) A protein of interest is converted into features and scored
with the model using a naïve Bayes scoring function, and predictions are made using score cutoffs, which can be based on desired performance statistics.
The scores are calibrated into Z-scores using the training set used to derive each model.
EF_HAND,
THIOREDOXIN
. . .
1D Motif Database
Motif functional sites
EF_HAND.1.ASP.OD1
EF_HAND.5.SER.OG
THIOREDOXIN.8.CYS.SG
Structural examples
of functional site
Background sites
of same atom type
and atom density
Negative training set
Positive training set
Statistical model of functional site
(”fingerprint”)
Sites of interest in protein structure
Score cutoff based on
training data
Scores for query sites
(predictions)
1 1 0 2 1 2 0 0
1 1 0 2 1 2 0 0
0 0 1 1 0 1 2 0
0 0 1 1 0 1 2 0
1 0 0 1 0 0 1 1
1 0 0 1 0 0 1 1
2 1 0 0 1 0 1 0
2 1 0 0 1 0 1 0
Featurization of local
physicochemical environment
using radial shells
FEATURE
1 0 0 0 0 1 1 0
1 0 0 0 0 1 1 0
0 2 1 0 0 0 0 2
0 2 1 0 0 0 0 2
Scoring function
PDB
1 1 0 2 1 2 0 0
1 1 0 2 1 2 0 0
0 0 1 1 0 1 2 0
0 0 1 1 0 1 2 0
1 0 0 1 0 0 1 1
1 0 0 1 0 0 1 1
2 1 0 0 1 0 1 0
2 1 0 0 1 0 1 0
1 0 0 0 0 1 1 0
1 0 0 0 0 1 1 0
0 2 1 0 0 0 0 2
0 2 1 0 0 0 0 2
Calculation of feature vectors
Training set selection Model training Site scanning
(a)
(b)
(c)
(d)
(e)
. . .
Shell
0 1 2 3 4 5
ATOM-TYPE-IS-C
ATOM-TYPE-IS-CT
ATOM-TYPE-IS-Ca
ATOM-TYPE-IS-N
ATOM-TYPE-IS-N2
ATOM-TYPE-IS-N3
ATOM-TYPE-IS-Na
ATOM-TYPE-IS-O
ATOM-TYPE-IS-O2
ATOM-TYPE-IS-OH
ATOM-TYPE-IS-S
ATOM-TYPE-IS-SH
ATOM-TYPE-IS-OTHER
PARTIAL-CHARGE
Genome Biology 2008, Volume 9, Issue 1, Article R8 Wu et al. R8.15
Genome Biology 2008, 9:R8
tern misses. The ability to abstract the properties relevant to
function independent of sequence or structural homology is
one of SeqFEATURE's biggest strengths.
Another one of SeqFEATURE's advantages is that score cut-
offs can be adjusted to reflect the user's desired performance
criteria, for example, estimated specificity, sensitivity, or pos-
itive predictive value. The ratio of true positives to false posi-
tives and false negatives is traded off depending on where the
score cutoff is set. There are several additional filters one can
use to boost the confidence of positive predictions. True hits
often manifest themselves as a cluster of high-scoring positive
predictions for the same or related functional site models.
Single, isolated hits in a protein, although potentially inter-
esting, may not have the exact function represented by the
model.
The functional 'fingerprint' of each model (as shown in Figure
7d) also allows detailed understanding of the physicochemi-
cal environment representative of that type of functional site,
and detailed inspection of potential positives may boost con-
fidence of positive predictions or help explain the existence of
any false positives. Even if the SeqFEATURE prediction is not
entirely accurate, the fact that it is based on a representation
of the local physical and chemical environment means that we
can still make interesting observations about what properties
Table 6
Physicochemical properties used by the FEATURE algorithm
Atom-based Molecule-based Residue-based Secondary structure-based
ATOM-TYPE-IS-C PARTIAL-CHARGE RESIDUE_NAME_IS_ALA SECONDARY_STRUCTURE1_IS_3HELIX
ATOM-TYPE-IS-CT HYDROXYL RESIDUE_NAME_IS_ARG SECONDARY_STRUCTURE1_IS_4HELIX
ATOM-TYPE-IS-Ca AMIDE RESIDUE_NAME_IS_ASN SECONDARY_STRUCTURE1_IS_5HELIX
ATOM-TYPE-IS-N AMINE RESIDUE_NAME_IS_ASP SECONDARY_STRUCTURE1_IS_BRIDGE
ATOM-TYPE-IS-N2 CARBONYL RESIDUE_NAME_IS_CYS SECONDARY_STRUCTURE1_IS_STRAND
ATOM-TYPE-IS-N3 RING-SYSTEM RESIDUE_NAME_IS_GLN SECONDARY_STRUCTURE1_IS_TURN
ATOM-TYPE-IS-Na PEPTIDE RESIDUE_NAME_IS_GLU SECONDARY_STRUCTURE1_IS_BEND
ATOM-TYPE-IS-O VDW-VOLUME RESIDUE_NAME_IS_GLY SECONDARY_STRUCTURE1_IS_COIL
ATOM-TYPE-IS-O2 CHARGE RESIDUE_NAME_IS_HIS SECONDARY_STRUCTURE1_IS_HET
ATOM-TYPE-IS-OH NEG-CHARGE RESIDUE_NAME_IS_ILE SECONDARY_STRUCTURE1_IS_UNKNOWN
ATOM-TYPE-IS-S POS-CHARGE RESIDUE_NAME_IS_LEU SECONDARY_STRUCTURE1_IS_HELIX
ATOM-TYPE-IS-SH CHARGE-WITH-HIS RESIDUE_NAME_IS_LYS SECONDARY_STRUCTURE1_IS_BETA
ATOM-TYPE-IS-OTHER HYDROPHOBICITY RESIDUE_NAME_IS_MET SECONDARY_STRUCTURE1_IS_COIL
ATOM-NAME-IS-ANY MOBILITY RESIDUE_NAME_IS_PHE SECONDARY_STRUCTURE1_IS_HET
ATOM-NAME-IS-C SOLVENT-ACCESSIBILITY RESIDUE_NAME_IS_PRO SECONDARY_STRUCTURE1_IS_UNKNOWN
ATOM-NAME-IS-N RESIDUE_NAME_IS_SER
ATOM-NAME-IS-O RESIDUE_NAME_IS_THR
ATOM-NAME-IS-S RESIDUE_NAME_IS_TRP
ATOM-NAME-IS-OTHER RESIDUE_NAME_IS_TYR
RESIDUE_NAME_IS_VAL
RESIDUE_NAME_IS_HOH
RESIDUE_NAME_IS_OTHER
CLASS1_IS_HYDROPHOBIC
CLASS1_IS_CHARGED
CLASS1_IS_POLAR
CLASS1_IS_UNKNOWN
CLASS2_IS_NONPOLAR
CLASS2_IS_POLAR
CLASS2_IS_BASIC
CLASS2_IS_ACIDIC
CLASS2_IS_UNKNOWN
These properties are expressed at the atomic, molecular, residue and secondary structural levels of abstraction. The properties at the atomic,
molecule and secondary structural level are designed to make the FEATURE models relatively less dependent on primary amino acid sequence, in an
attempt to improve performance on highly divergent (or convergent) sites. Most of these properties are simply counts of the property, and a few are
continuous valued, as discussed in [32].
Genome Biology 2008, 9:R8
Genome Biology 2008, Volume 9, Issue 1, Article R8 Wu et al. R8.16
helped the site score highly, and which additional properties
may be necessary for the site truly to contain the predicted
function.
Most importantly, since SeqFEATURE is not dependent on
sequence or overall structural fold, it can be used when either
the sequence or the structure is novel. This became evident
when we compared the performance of the different methods
at low sequence identities and low structural similarities, and
found that SeqFEATURE shows a trend to being more sensi-
tive than sequence-based methods at low sequence identities
and more sensitive than other structure-based ones at low
structural similarities. As shown with the three TargetDB
examples, SeqFEATURE is able to predict function where
other methods are not. Further inspection of the putative
sites reveals compelling evidence for SeqFEATURE's
predictions. The ability to provide useful predictions on novel
structures will become more and more important as struc-
tural genomics matures, and SeqFEATURE demonstrates
robust performance in this area.
Conclusion
Advances in protein structure determination have led to an
increase in unannotated structures, many with low sequence
identity to known proteins. Our method, SeqFEATURE, uses
functional sequence motifs to seed training sets from which
three-dimensional models of the function are built. We used
SeqFEATURE to construct a large library of three-dimen-
sional functional site models from PROSITE motifs and
scanned uncharacterized structural genomics targets from
TargetDB for function. SeqFEATURE's descriptive and intui-
tive models show comparable performance to existing
sequence- and structure-based methods. Importantly,
SeqFEATURE models retain robust performance when
sequence identity and structural similarity are reduced.
Methods such as SeqFEATURE that do not rely on strict
sequence or structure conservation will be valuable tools for
annotating novel protein structures.
Materials and methods
SeqFEATURE (Figure 7) is a method for automatically select-
ing training sets and building structural models within the
FEATURE framework, a system for modeling functional sites
in protein structures that has been published previously [32].
Here, we summarize the FEATURE algorithm and present
SeqFEATURE in more detail.
The FEATURE algorithm
FEATURE builds statistical three-dimensional models of the
local environment around a functional site given training sets
of positive and negative examples. These models can then be
used to evaluate test sites and predict whether they have par-
ticular functions. FEATURE calculates a number of physico-
chemical properties (Table 6) at varying radial distances from
the site center and creates a feature vector containing the val-
ues of each property in each radial volume (Figure 7c). Both
atomic and residue level properties are examined, allowing
the functional site to be described at multiple levels. The
structural model is constructed by comparing the statistical
distribution of properties between positive and negative sites.
In a model for a particular functional site, properties are
described as either significantly more present, more absent,
or having no significant difference in the positive sites com-
pared to negative sites using the Wilcoxan rank sum test [32].
The significant properties can be visually displayed as a color-
coded matrix unique to that model, which we call its finger-
print (Figure 7d).
Using a naïve Bayes scoring function, FEATURE can then
evaluate the likelihood that a query site contains the function
described by a particular model. A feature vector is created for
the query site in the same way as for the training sites, and a
likelihood score is calculated assuming independence of each
individual feature
υ
i
:
A score cutoff for classifying a query site can be chosen for
each model according to the user's desired performance crite-
ria (Figure 7e).
SeqFEATURE
Training set selection
SeqFEATURE adds to the FEATURE framework by using
one-dimensional sequence motifs as seeds for generating
training sets of structural examples (Figure 7a). This method
was first introduced by Liang et al. [34] in a single application
to calcium binding by EF-hand motifs, and is extended and
applied here into a full library of functional site models. To
build the library of models, we extracted structural examples
of PROSITE functional site patterns from the ASTRAL40
compendium [38], which is a nonredundant subset of protein
domains in the PDB. We required training sets to have a min-
imum of five structural examples.
PROSITE patterns are regular expressions that specify the
amino acids permitted at each position of the motif. We
defined functional site centers to be the functional atom(s) of
annotated functional residues in each pattern, for example,
the gamma oxygen of serine, or SER.OG. For patterns with
multiple functional residues or multiple functional atoms, we
built multiple models for the same PROSITE pattern. For
example, the PROSITE pattern EGF_1 has functional
cysteine residues at positions 1, 3, and 7, so there are three
models centered at three atoms in this pattern -
EGF_1.1.CYS.SG, EGF_1.3.CYS.SG, and EGF_1.7.CYS.SG.
Models derived from PROSITE are always named using a
four-part naming scheme specifying the motif, the position in
Score =
⎡
⎣
⎢
⎤
⎦
⎥
∑
log
(|)
()
Psite
i
Psite
i
u
Genome Biology 2008, Volume 9, Issue 1, Article R8 Wu et al. R8.17
Genome Biology 2008, 9:R8
the motif, the residue at that position, and the atom within
that residue upon which the model is centered. See Table 1 for
a complete list of SeqFEATURE models.
Positive training sets consist of PDB coordinates of functional
atoms as described above, extracted from structures contain-
ing that particular pattern. We selected negative training sets
randomly from identical residues in the rest of the PDB whose
atom compositions and densities are similar to the positive
sites. In order to define the background distribution of the
functional site environments, we used a thousand times as
many negative sites as positive sites for each model, when
possible, but never less than 4,000.
Model cross-validation and evaluation
We internally evaluated each model using five-fold cross val-
idation by partitioning the positive and negative training sets
randomly into five blocks. For each run, we used four blocks
to build the model and tested performance on the remaining
block. To compare results across runs, we transformed the
scores into Z-scores by standardizing to the mean and stand-
ard deviation of the negative score distribution.
To measure performance, we employ ROC curves, which plot
the true positive rate (sensitivity, or the ratio of true positive
predictions to all true positives) against the false positive rate
(1-specificity, or the ratio of false positive predictions to all
true positives) at varying Z-score cutoffs. We also use PPV
versus sensitivity to gauge the performance of a model. Sensi-
tivity, specificity, and PPV are calculated as follows:
The AUC estimates the probability that a random positive site
will be scored higher than a random negative site, and pro-
vides a summary measure of the performance of the model.
The final models used all of the training examples, and
include score cutoffs calculated for 95%, 99%, and 100% spe-
cificity based on cross validation data.
Comparison to other function prediction methods
The manually curated PROSITE record for each pattern con-
tains known true positives, false positives, and false negatives
predicted by that pattern, listed using Swiss-Prot identifiers.
We treated each Swiss-Prot ID as a unique protein. Taking
existing mappings between Swiss-Prot and the PDB, we also
converted each list into a list of corresponding PDB structures
to use as input to SeqFEATURE and other structure-based
prediction methods. Thus, our positive test set consisted of
Swiss-Prot IDs and PDB structures for proteins annotated as
true positives and false negatives in PROSITE, and our nega-
tive test set consisted of Swiss-Prot IDs and PDB structures
for proteins annotated as false positives. We removed all pos-
itive training set structures from the test sets and filtered the
test structures to ensure that they contained the functional
regions described by the appropriate PROSITE pattern.
Using these test sets, we compared performance among
PROSITE, Pfam, Gene3D, HMMPanther, SSM, 3D templates
(reverse template type), and SeqFEATURE. In order to
ensure consistency across the comparisons, we restricted the
analysis to patterns that had at least one model with an AUC
>0.75 and that also mapped unambiguously to the pattern
database or tool being compared. For example, to determine
the Pfam assignment for a particular pattern, we looked up
the set of Pfam assignments for each structure in the training
set using Pfam's publicly available mappings. Unambiguous
assignments were those for which either 100% of the training
set mapped to the same Pfam family, or for which the Pfam
family clearly matched the PROSITE pattern (for example,
PROSITE pattern GLYCOSYL_HYDROL_F10 and Pfam fam-
ily 'Glyco_hydro_10'). Forty-two PROSITE motifs had both
an AUC >0.75 and a positive test set independent of the train-
ing set (TRYPSIN_HIS was excluded due to it being nearly
identical to TRYPSIN_SER), and, of these, 31 mapped unam-
biguously to Pfam, 12 to Panther, and 29 to Gene3D.
Because structure-based methods such as 3D templates and
SSM are more computationally expensive to run than
SeqFEATURE and the sequence-based methods, we split the
comparison into two parts. The first part compared
PROSITE, Pfam, HMMPanther, Gene3D, and SeqFEATURE,
and covered the unambiguous portions of the test sets in their
entirety. PROSITE's predictions came directly from its anno-
tations. For the other sequence-based methods, we analyzed
the test set proteins using each tool and marked a protein as
a positive prediction if at least one of its mapped predictions
matched the unambiguous assignment for the pattern being
tested. HMMPanther and Gene3D were run from the Inter-
Pro servers using the stand-alone downloadable Perl client
[39]. Pfam's predictions were taken directly from their pub-
licly available mapping file. For SeqFEATURE, we classified a
protein as positive if at least one of its mapped PDB structures
scored above the specified cutoff for at least one model
derived from that pattern. Since SeqFEATURE cutoffs are
variable, we tested performance at 95%, 99%, and 100% spe-
cificity cutoffs.
To compare SSM, 3D templates, and SeqFEATURE, we lim-
ited our test sites to those derived from PROSITE patterns
that mapped to EC numbers. Since 3D templates (reverse
template type) and SSM both return protein structures rather
than a named function as output, we used EC numbers to
evaluate predictions made by SSM and 3D templates. We
determined the set of EC numbers corresponding to each pat-
Sensitivity
# of true positive predictions
total # of true
=
ppositives
Specificity
# of true negative predictions
total # of true
=
nnegatives
Positive predictive value
# of true positive predictions
to
=
ttal # of positive predictions
Genome Biology 2008, 9:R8
Genome Biology 2008, Volume 9, Issue 1, Article R8 Wu et al. R8.18
tern's training set and randomly sampled 29 positive sites and
15 negative sites from the EC-compatible subset of test sites.
We then took the top prediction below 95% sequence identity
to the query for each test site from SSM and 3D templates that
had an EC number, and considered it a positive prediction if
the EC number matched any of the EC numbers assigned to
the relevant PROSITE pattern. We determined SeqFEATURE
predictions by evaluating whether each structure scored
above the 95%, 99%, and 100% cutoffs for at least one model
derived from the appropriate pattern.
Importantly, we compared the sequence-based methods to
SeqFEATURE using low sequence identity test sets. We com-
puted all pairwise sequence alignments between structures in
the positive test set and the training set for each pattern using
Jaligner, a freely available Smith-Waterman alignment soft-
ware package [40], and constructed a new test set consisting
of those test structures that had less than 35% sequence iden-
tity to structures in their corresponding training set. This
comprised the low sequence identity positive test set, which
we analyzed according to sequence identity thresholds differ-
ing by 2% (<35%, <33%, and so on, down to <25%). We
looked up the predictions from the sequence-based methods
for the low sequence identity test set at each of these
thresholds.
From the low sequence identity test set, we conducted pair-
wise structural similarity searches between each structure
and the structures in the corresponding training sets using
DALI, a publicly available tool for calculating structural
similarity [41]. We discarded any structure that matched a
training set structure with a Dali Z-score greater than 10.0.
The remaining structures all had no significant matches, or
only low-confidence matches, to their positive training sets.
We looked up the predictions from 3D templates, SSM, and
SeqFEATURE (at the three different cutoffs) for the low
structural similarity test set.
Protein Data Bank scan
Any PDB structure can be scanned with any SeqFEATURE
model to generate a list of predictions. The March 2006 ver-
sion of the PDB contains about 35,600 structures, about 95%
of which are proteins. We extracted lists of each of the rele-
vant potential functional atoms from each protein structure
(ARG.NE, ASP.OD1, ASP.OD2, CYS.SG, and so on), including
all chains. This resulted in 90,919,770 potential sites. We then
scored all of these sites with the corresponding models that
were built on that particular type of functional atom. The
entire scan (extracting and scoring) took about one day to
complete on fourteen parallel processors. To analyze the scan
data, we filtered out redundant scores from proteins with
multiple, identical chains.
TargetDB prediction analysis
We focused our scan analysis on structures listed in Tar-
getDB, the database for targets from structural genomics
centers [4]. Using the headers of released PDB files, we fil-
tered for those that lacked functional annotation; for exam-
ple, 'STRUCTURAL GENOMICS,' 'UNKNOWN FUNCTION',
'HYPOTHETICAL PROTEIN', and so on. We scanned these
structures with the entire library of SeqFEATURE models
and manually examined the predictions for those hits that
satisfied the following two conditions: the prediction was for
a model that has an AUC >0.85; and the hit scored above the
100% specificity cutoff or well within the positive Z-score dis-
tribution for that model. We then compared each prediction
to the results of PROSITE, Pfam, HMMPanther, Gene3D,
SSM, and 3D template searches on those structures, and pri-
oritized cases where the sequence-based methods produced
no significant predictions.
WebFEATURE function prediction server
All of the models may be used to scan any protein structure on
WebFEATURE, our web-accessible function prediction
server [35]. Results from the PDB scan are also available for
download. Source code for FEATURE is available from
SimTK [42].
Abbreviations
AUC, area under the curve; EC, Enzyme Commission; GO,
Gene Ontology; HMM, Hidden Markov Model; PDB, Protein
Data Bank; PPV, positive predictive value; ROC, receiver
operating characteristic; SCOP, Structural Classification of
Proteins; SSM, Secondary Structure Matching.
Authors' contributions
SW performed the model training, performance evaluation,
PDB analysis, case study analysis, and wrote the manuscript.
MPL conceived and preliminarily carried out model training
and performance evaluation. RBA conceived and directed the
study and helped write the manuscript.
Acknowledgements
This work was funded by the following grants: NIHLM0703 and
NIHLM05652. The authors would like to thank Dr Jessica Ebert for helpful
comments on the manuscript.
References
1. Brenner SE: A tour of structural genomics. Nat Rev Genet 2001,
2:801-809.
2. Berman HM, Henrick K, Haruki N: Announcing the worldwide
Protein Data Bank. Nat Struct Biol 2003, 10:980.
3. TargetDB Statistics Summary Report [ />statistics/TargetStatistics.html]
4. Chen L, Oughtred R, Berman HM, Westbrook J: TargetDB: a tar-
get registration database for structural genomics projects.
Bioinformatics 2004, 20:2860-2862.
5. Altschul S, Gish W, Miller W, Myers E, Lipman D: Basic Local
Alignment Search Tool. J Mol Biol 1990, 215:403-410.
6. Wilson CA, Kreychman J, Gerstein M: Assessing annotation
transfer for genomics: quantifying the relations between
protein sequence, structure and function through traditional
and probabilistic scores. J Mol Biol 2000, 297:233-249.
Genome Biology 2008, Volume 9, Issue 1, Article R8 Wu et al. R8.19
Genome Biology 2008, 9:R8
7. Sonnhammer E, Eddy S, Birney E, Bateman A, Durbin R: Pfam: mul-
tiple sequence alignments and HMM-profiles of protein
domains. Nucleic Acids Res 1998, 26:320-322.
8. Hulo N, Bairoch A, Bulliard V, Cerutti L, De Castro E, Langedijk-
Genevaux P, Pagni M, Sigrist C: The PROSITE database. Nucleic
Acids Res 2006, 32:227-230.
9. The InterPro Consortium, Mulder NJ, Apweiler R, Attwood TK, Bai-
roch A, Bateman A, Binns D, Biswas M, Bradley P, Bork P, Bucher P,
Copley R, Courcelle E, Durbin R, Falquet L, Fleischmann W, Gouzy J,
Griffith-Jones S, Haft D, Hermjakob H, Hulo N, Kahn D, Kanapin A,
Krestyaninova M, Lopez R, Letunic I, Orchard S, Pagni M, Peyruc D,
Ponting CP, Servant F, Sigrist CJA: InterPro: an integrated docu-
mentation resource for protein families, domains, and func-
tional sites. Briefings Bioinformatics 2002, 3:225-235.
10. Mulder NJ, Apweiler R, Attwood TK, Bairoch A, Bateman A, Binns D,
Bork P, Buillard V, Cerutti L, Copley R, Courcelle E, Das U, Daugh-
erty L, Dibley M, Finn R, Fleischmann W, Gough J, Haft D, Hulo N,
Hunter S, Kahn D, Kanapin A, Kejariwal A, Labarga A, Langendijk-
Genevaux PS, Lonsdale D, Lopez R, Letunic I, Madera M, Maslen J, et
al.: New developments in the InterPro database. Nucleic Acids
Res 2007, 35:224-228.
11. Bateman A, Haft DH: HMM-based databases in InterPro. Brief-
ings Bioinformatics 2002, 3:236-244.
12. Haft DH, Selengut JD, White O: The TIGRFAMs database of pro-
tein families. Nucleic Acids Res 2003, 31:371-373.
13. Thomas PD, Campbell MJ, Kejariwal A, Mi H, Karlak B, Daverman R,
Diemer K, Muruganujan A, Narechania A: PANTHER: A library of
protein families and subfamilies indexed by function. Genome
Res 2003, 13:2129-2141.
14. Madera M, Vogel C, Kummerfeld SK, Chothia C, Gough J: The
SUPERFAMILY database in 2004: additions and improve-
ments. Nucleic Acids Res 2004, 32:235-239.
15. Murzin A, Brenner SE, Hubbard T, Chothia C: SCOP: a structural
classification of proteins database for the investigation of
sequences and structures. J Mol Biol 1995, 247:536-540.
16. Buchan DW, Shepherd AJ, Lee D, Pearl FM, Rison SC, Thornton JM,
Orengo CA: Gene3D: structural assignment for whole genes
and genomes using the CATH domain structure database.
Genome Res 2002, 12:503-514.
17. Greene LH, Lewis TE, Addou S, Cuff A, Dallman T, Dibley M, Redfern
O, Pearl F, Nambudiry R, Reid A, Sillitoe I, Yeats C, Thornton JM,
Orengo CA: The CATH domain structure database: new pro-
tocols and classification levels give a more comprehensive
resource for exploring evolution. Nucleic Acids Res 2007,
35:291-297.
18. Fetrow JS, Skolnick J: Method for prediction of protein function
from sequence using the sequence-to-structure-to-function
paradigm with application to glutaredoxins/thioredoxins and
T1 ribonucleases. J Mol Biol 1998, 281:949-968.
19. Fetrow JS, Godzik A, Skolnick J: Functional analysis of the
Escherichia coli genome using the sequence-to-structure-to-
function paradigm: identification of proteins exhibiting the
glutaredoxin/thioredoxin disulfide oxidoreductase activity. J
Mol Biol 1998, 282:703-711.
20. Pal D, Eisenberg D: Inference of protein function from protein
structure. Structure 2005, 13:121-130.
21. Altschul S, Madden T, Schaffer A, Zhang J, Zhang Z, Miller W, Lipman
D: Gapped BLAST and PSI-BLAST: a new generation of pro-
tein database search programs. Nucleic Acids Res 1997,
25:3389-3402.
22. Holm L, Sander C: Dali/FSSP classification of three-dimen-
sional protein folds. Nucleic Acids Res 1997, 25:231-234.
23. Xenarios I, Rice DW, Salwinski L, Baron MK, Marcotte EM, Eisenberg
D: DIP: the Database of Interacting Proteins. Nucleic Acids Res
2000, 28:289-291.
24. Consortium TGO: Gene Ontology: tool for the unification of
biology.
Nat Genet 2000, 25:25-29.
25. Polacco BJ, Babbitt PC: Automated discovery of 3D motifs for
protein function annotation. Bioinformatics 2006, 22:723-730.
26. Krissinel E, Henrick K: Secondary-structure matching (SSM), a
new tool for fast protein structure alignment in three
dimensions. Acta Crystallogr D 2004, 12:2256-2268.
27. Laskowski RA, Watson JD, Thornton JM: Protein function predic-
tion using local 3D templates. J Mol Biol 2005, 351:614-626.
28. Laskowski RA, Watson JD, Thornton JM: ProFunc: a server for
predicting protein function from structure. Nucleic Acids Res
2005, 33:89-93.
29. Watson JD, Sanderson S, Ezersky A, Savchenko A, Edwards A,
Orengo C, Joachimiak A, Laskowski RA, Thornton JM: Towards
fully automated structure-based function prediction in struc-
tural genomics: a case study. J Mol Biol 2007, 367:1511-1522.
30. Committee IUoBaMBN: Enzyme Nomenclature 1992: Recommenda-
tions of the Nomenclature Committee of the International Union of Bio-
chemistry and Molecular Biology on the Nomenclature and Classification of
Enzymes San Diego: Academic Press; 1992.
31. Babbitt PC: Definitions of enzyme function for the structural
genomics era. Curr Opin Chem Biol 2003, 7:230-237.
32. Wei L, Altman RB: Recognizing protein binding sites using sta-
tistical descriptions of their 3D environments. Pac Symp
Biocomput 1998:497-508.
33. Wei L, Altman RB: Recognizing complex, asymmetric func-
tional sites in protein structures using a Bayesian scoring
function. J Bioinformatics Computational Biol 2003, 1:119-138.
34. Liang MP, Brutlag DL, Altman RB: Automated construction of
structural motifs for predicting functional sites on protein
structures. Pac Symp Biocomput 2003:204-215.
35. WebFEATURE: Automated function prediction in protein
structures [ />36. PDB SeqFEATURE Scan Data [ />webfeature/data]
37. Chothia C, Lesk AM: The relation between the divergence of
sequence and structure in proteins. EMBO J 1986, 5:823-826.
38. Brenner SE, Koehl P, Levitt M: The ASTRAL compendium for
protein structure and sequence analysis. Nucleic Acids Res 2000,
28:254-256.
39. Quevillon E, Silventoinen V, Pillai S, Harte N, Mulder NJ, Apweiler R,
Lopez R: InterProScan: protein domains identifier. Nucleic
Acids Res 2005, 33:116-120.
40. JAligner []
41. The Dali Server [ />42. FEATURE on SimTK [ />43. Visual Molecular Dynamics [ />vmd]