Báo cáo y học: "Systems biology-defined NF-κB regulons, interacting signal pathways and networks are implicated in the malignant phenotype of head and neck cancer cell lines differing in p53 status" pps
Bạn đang xem bản rút gọn của tài liệu. Xem và tải ngay bản đầy đủ của tài liệu tại đây (981.31 KB, 22 trang )
Genome Biology 2008, 9:R53
Open Access
2008Yanet al.Volume 9, Issue 3, Article R53
Research
Systems biology-defined NF-
κ
B regulons, interacting signal
pathways and networks are implicated in the malignant phenotype
of head and neck cancer cell lines differing in p53 status
Bin Yan
¤
*
, Guang Chen
¤
†‡
, Kunal Saigal
*§
, Xinping Yang
*
, Shane T Jensen
¶
,
Carter Van Waes
*
, Christian J Stoeckert
‡¥
and Zhong Chen
*
Addresses:
*
Head and Neck Surgery Branch, NIDCD, National Institutes of Health, Bethesda, MD 20892, USA.
†
Department of Bioengineering,
Smith Walk; University of Pennsylvania, Philadelphia, Pennsylvania 19104, USA.
‡
Center for Bioinformatics, Guardian Drive; University of
Pennsylvania, Philadelphia, Pennsylvania 19104, USA.
§
NIH-Pfizer Clinical Research Training Program Award; University of Pennsylvania,
Philadelphia, Pennsylvania 19104, USA.
¶
Department of Statistics, The Wharton School, Walnut Street; University of Pennsylvania,
Philadelphia, Pennsylvania 19104, USA.
¥
Department of Genetics, School of Medicine, Curie Boulevard; University of Pennsylvania,
Philadelphia, Pennsylvania 19104, USA.
¤ These authors contributed equally to this work.
Correspondence: Zhong Chen. Email:
© 2008 Yan et al.; licensee BioMed Central Ltd.
This is an open access article distributed under the terms of the Creative Commons Attribution License ( which
permits unrestricted use, distribution, and reproduction in any medium, provided the original work is properly cited.
NF-?B regulons involved in head and neck cancer<p>Detailed analysis of NFkB regulons in 1,265 genes differentially expressed in head and neck cancer cell lines differing in p53 status revealed a cross talk between NFkB and specific signaling pathways.</p>
Abstract
Background: Aberrant activation of the nuclear factor kappaB (NF-
κ
B) pathway has been previously
implicated as a crucial signal promoting tumorigenesis. However, how NF-
κ
B acts as a key regulatory node
to modulate global gene expression, and contributes to the malignant heterogeneity of head and neck
cancer, is not well understood.
Results: To address this question, we used a newly developed computational strategy, COGRIM
(Clustering Of Gene Regulons using Integrated Modeling), to identify NF-
κ
B regulons (a set of genes under
regulation of the same transcription factor) for 1,265 genes differentially expressed by head and neck
cancer cell lines differing in p53 status. There were 748 NF-
κ
B targets predicted and individually annotated
for RELA, NF
κ
B1 or cREL regulation, and a prevalence of RELA related genes was observed in over-
expressed clusters in a tumor subset. Using Ingenuity Pathway Analysis, the NF-
κ
B targets were reverse-
engineered into annotated signature networks and pathways, revealing relationships broadly altered in
cancer lines (activated proinflammatory and down-regulated Wnt/β-catenin and transforming growth
factor-
β
pathways), or specifically defective in cancer subsets (growth factors, cytokines, integrins,
receptors and intermediate kinases). Representatives of predicted NF-
κ
B target genes were
experimentally validated through modulation by tumor necrosis factor-
α
or small interfering RNA for
RELA or NF
κ
B1.
Conclusion: NF-
κ
B globally regulates diverse gene programs that are organized in signal networks and
pathways differing in cancer subsets with distinct p53 status. The concerted alterations in gene expression
patterns reflect cross-talk among NF-
κ
B and other pathways, which may provide a basis for molecular
classifications and targeted therapeutics for heterogeneous subsets of head and neck or other cancers.
Published: 11 March 2008
Genome Biology 2008, 9:R53 (doi:10.1186/gb-2008-9-3-r53)
Received: 8 November 2007
Revised: 28 January 2008
Accepted: 11 March 2008
The electronic version of this article is the complete one and can be
found online at />Genome Biology 2008, 9:R53
Genome Biology 2008, Volume 9, Issue 3, Article R53 Yan et al. R53.2
Background
The nuclear factor kappaB (NF-
κ
B) family comprises a group
of evolutionarily conserved signal-activated transcription fac-
tors (TFs) that have been shown to play a central role in the
control of a large number of normal and stressed cellular
processes [1,2]. NF-
κ
B is involved in similar biological proc-
esses in cancers, as a critical modulator of genes that promote
cell survival, inflammation, angiogenesis, tumor develop-
ment, progression and metastasis [3-5]. We previously
showed that NF-
κ
B is aberrantly activated and modulates the
expression of gene clusters that include oncogenes that pro-
mote survival, tumorigenesis and therapeutic resistance of
advanced murine and human squamous cell carcinomas [6-
16]. In addition, NF-
κ
B and related pathways have been iden-
tified as potential biomarkers and therapeutic targets for a
variety of human cancers [3,4,17-19]. However, our under-
standing of the regulatory mechanisms activating or affected
by the NF-
κ
B pathway still remains limited to the classical
concept of linear pathway activation based on experimental
observations from traditional biological approaches. Such a
linear paradigm for NF-
κ
B as well as other pathways could be
problematic, as suggested by the observation that pharmaco-
logical and clinical approaches targeting individual NF-
κ
B
signal molecules alone have not yielded significant clinical
efficacy in most solid tumors [20-22].
Several levels of complexity contribute to our limited under-
standing of the function of the NF-
κ
B pathway in health and
disease. First, the NF-
κ
B family consists of five structurally
related proteins, namely RELA (p65), NF
κ
B1 (p50/p105),
cREL, RELB, and NF
κ
B2 (p52/p100), as well as seven inhib-
itor kappaB (I
κ
B) molecules [1,2]. Constitutive activation of
RELA/NF
κ
B1 was found to be an essential factor controlling
the expression of genes that affect cellular proliferation,
apoptosis, angiogenesis, immune and proinflammatory
responses, and therapeutic resistance in head and neck squa-
mous cell carcinoma (HNSCC) and other cancers [3-5]. How-
ever, nuclear activation of hetero- and homodimers
composed of other NF-
κ
B subunits has also been detected in
HNSCC tissues and cell lines [23]. While the function of the
less studied species of NF-
κ
B is not yet fully understood, there
is evidence that formation of homo- or heterodimers from dif-
ferent NF-
κ
B subunits can increase the diversity of responses
through interaction with various I
κ
Bs or other regulatory fac-
tors, and by having different binding affinities for variant
κ
B
promoter binding motifs [1,2,24]. Second, multiple signals
from membrane receptors and intermediate kinases converge
to modulate different NF-
κ
B subunits directly or indirectly.
At present, there is evidence for signaling through a classic
pathway involving a trimeric inhibitor-kappaB kinase
(IKK)
α
/
β
/
γ
and casein kinase 2 complexes modulating
NF
κ
B1, RELA and cREL, and alternative pathways involving
NF-
κ
B inducing kinase and IKK
α
modulating NF
κ
B2 and
RELB [1,2,11,24-26]. Furthermore, there is potential for
cross-talk between IKK/NF-
κ
B and other major signal path-
ways, such as the mitogen-activated protein kinase (MAPK),
phosphatidylinositol 3-kinase (PI3K), JAK/STAT (Janus
kinase/signal transducer and transcription factor), and p53
pathways, which have been implicated in significantly affect-
ing the cancer phenotype, including proliferation, apoptosis,
angiogenesis and tumorigenesis [1,4,27-30]. These observa-
tions highlight the tremendous technical challenges and
experimental limitations when studying such dynamic and
complex biological and regulatory systems using a classic one
molecule/one pathway approach.
Molecular and phenotypic heterogeneity represents an addi-
tional obstacle that limits our understanding of the regulatory
mechanisms giving rise to differences in the malignant phe-
notype between different cancers of the same histological
type, such as HNSCC. The identification of heterogeneous
sub-populations in specific types of cancer, such as HNSCC,
and selection of therapies targeting them are major hurdles
for clinical diagnosis, prognosis and treatment. Such hetero-
geneity usually remains undetected by standard histological
and pathological classification and clinical grading systems,
and other biomarkers based on molecular gene expression
profiles and immunohistochemistry are not yet well enough
understood or validated for clinical applications. Such heter-
ogeneity in the malignant phenotype includes differences in
prognosis, therapeutic resistance, angiogenesis or metastatic
potential associated with specific molecular alterations iden-
tified in HNSCC, such as overexpression or mutation of epi-
dermal growth factor receptor (EGFR) [10,31,32],
constitutive activation of NF-
κ
B, MAPK, AKT and STAT path-
ways [15,31,33-37], mutation or dysfunction of p53/p63/p73
family members [35,36,38], and over-expression of proin-
flammatory and proangiogeneic cytokines and growth fac-
tors, including interleukin (IL)1, IL6, IL8, vascular
endothelial growth factor (VEGF), platelet-derived growth
factor, and hepatocyte growth factor [18,34,37,39-42].
We recently identified specific gene expression signatures in
HNSCC cell lines (UM-SCC, University of Michigan Cell Lines
Series of Head and Neck Squamous Cell Carcinoma), which
were associated with differing p53 status and NF-
κ
B regula-
tory activity, subsets previously associated with differences in
prognosis, response to chemoradiation or metastatic pheno-
types [14]. Some genes in the NF-
κ
B related expression signa-
tures identified from our study have been identified and
associated with a higher risk for HNSCC recurrence and
metastasis by independent groups [43,44]. However, the
individual genes and proteins identified from the molecular
and clinical studies do not function alone, but often form
dynamically complex interactions to execute their biological
functions, through regulatory control mechanisms involving
TFs, signal pathways and networks. The analysis of critical
transcriptional modules, pathways and networks has been
experimentally impractical, until the recent availability of
large sets of data from different microarray and genomic plat-
forms, as well as advances in development of bioinformatic
and systems biology approaches [45,46].
Genome Biology 2008, Volume 9, Issue 3, Article R53 Yan et al. R53.3
Genome Biology 2008, 9:R53
It remains a great challenge to systematically analyze tran-
scriptional regulation in eukaryotes through mathematical
modeling and integration of multiple large data sets from dif-
ferent platforms and experimental conditions, where each
provides only partial information about the biological proc-
ess. To address these challenges, a statistical model, COGRIM
(Clustering of Gene Regulons Using Integrated Modeling) has
been developed, based on a Bayesian hierarchical model with
a Markov chain Monte Carlo implementation [47,48]. Here,
this modeling has been specifically applied to novel applica-
tions in human cancer cell lines, where the successful predic-
tion of NF-
κ
B regulons (a set of genes under regulation of the
same TF) in HNSCC cell lines has been achieved by integra-
tion of large data sets of gene expression and multiple TFs
from different platforms and experimental conditions. Fur-
thermore, the global connections of NF-
κ
B regulons were
established through networks and pathways using Ingenuity
Pathway Analysis (IPA), and predicted novel NF-
κ
B targets
were confirmed with experimental validation. Our study
identified distinct molecular signatures composed of NF-
κ
B
dominant signal pathways and networks specific for subsets
of HNSCC cell lines differing in p53 status. Our identification
of NF-
κ
B related networks and pathways could significantly
enhance our understanding of NF-
κ
B regulatory mecha-
nisms, lead to new concepts of molecular regulation and clas-
sification of cancer subgroups, and targeted therapeutics for
HNSCC.
Results
Genome-wide identification of NF-
κ
B target genes in
HNSCC cell lines through COGRIM modeling
Previously, heterogeneous gene expression signatures were
identified in the UM-SCC cell lines associated with different
p53 status [14]. In this study, NF-
κ
B target genes were pre-
dicted by COGRIM modeling from 1,265 genes differentially
expressed in UM-SCC cells, and subgrouped by their p53 sta-
tus (Figure 1). A total of 748 genes were identified as putative
NF-
κ
B target genes, which represented 59% of the differen-
tially expressed genes input (Figure 1 and Additional data file
1). Among the 748 genes, 10% (75 genes) were previously
identified as NF-
κ
B target genes (labeled in bold in Additional
data file 1), based on publications from PubMed and available
web sites described in the Materials and methods section.
These known NF-
κ
B target genes, such as IL6, IL8, BIRC2
(clAP-1), ICAM1, YAP1, CDKN1A (p21), CSF2, CCDN1, IL1A,
IL1B, and so on, include many that have been independently
confirmed to be differentially expressed and pathologically
implicated in HNSCC and other cancers [6-8,39,44,49-52]. In
addition, functional binding of activated NF-
κ
B to several
sites within the promoters of IL6, IL8, ICAM1 and YAP1 have
been confirmed experimentally in our laboratory [6,14].
Next, we investigated if differentially expressed NF-
κ
B target
genes were specifically associated with subgroups of UM-SCC
cell lines that differ in p53 status (Figure 2a). Among these
NF-
κ
B target genes, 125 were associated with wild-type (wt)
p53-deficient status [14], 173 were associated with mutant
(mt) p53 status, and 250 were globally expressed in UM-SCC
cells (wt+mt p53) relative to non-malignant keratinocytes
(Figure 2a). In addition, 74 genes were overlapping between
the group of lines with wild-type p53-deficient status and all
10 p53 cell lines used (wt+mt), which include the 5 cell lines
with wild-type p53-deficient status. Similarly, 117 genes were
overlapping between the group of 5 cell lines with mutant p53
status and the 10 wt+mt p53 cell lines. Seven genes over-
lapped among cell groups with either wild-type or mutant p53
status, which are mutually exclusive groups; however, these
seven genes showed either up- or down-regulation in the dif-
ferent groups of cells, indicating that they could be oppositely
affected by p53 status. Furthermore, we annotated specific
genes under regulation by three individual NF-
κ
B subunits,
RELA, NF
κ
B1 or cREL. There were 124 genes predicted to be
under the regulation of all three NF-
κ
B subunits; 328 genes
by RELA; 410 genes by NF
κ
B1; and 306 genes by cREL (Fig-
ure 2b and Additional data file 1). In addition, some genes
were predicted to be preferentially under the regulation of
one of the NF-
κ
B family members, including 57 genes under
RELA regulation, 197 genes under NF
κ
B1 regulation, and 56
genes under cREL regulation (Figure 2b). We also observed
that genes preferentially under RELA regulation were over-
represented in the up-regulated genes in the subgroup of
tumors with wild-type p53-deficient status (
Χ
2
analysis, P <
0.0001; Figure 2c). Thus, our study predicted broad associa-
tions between NF-
κ
B regulated genes with all UM-SCC
groups, or with subsets of them that differ in p53 status, and,
specifically, it revealed an over-representation of RELA up-
regulated genes in UM-SCC cell lines with wild-type p53-defi-
cient status.
Predicted functionality of putative NF-
κ
B target genes
by comparative genomics
The identification of conserved NF-
κ
B binding sites across
human and mouse genomes was conducted through a com-
parative genome analysis (Transfac 8.4), as these binding
sites are more likely to be evolutionarily important and func-
tional. We observed that 183 of 748 genes (24.5%) have con-
served NF-
κ
B binding sites, including IL6, ICAM1,
REL(cREL), TIMP2, CSF1, IL1A, IL1B, IL1R2, ITGA5,
LAMB3, and so on (Additional data file 1). Individually, con-
served RELA, NF
κ
B1 or cREL binding sites were identified in
the promoters of 73 (22.3%), 96 (23.4%) and 67 (21.9%)
genes, respectively (Additional data file 1). To determine the
functional classification of the NF-
κ
B target genes, we per-
formed Gene Ontology annotation. Among the top Gene
Ontology categories, epidermal development, cell differentia-
tion, angiogenesis, cell-cell signaling, and cell adhesion
appeared in all tumor groups with increased statistical signif-
icance (Additional data file 2).
Genome Biology 2008, 9:R53
Genome Biology 2008, Volume 9, Issue 3, Article R53 Yan et al. R53.4
NF-
κ
B regulon related networks
It has been hypothesized that NF-
κ
B promotes cancer cell
progression through interactions with other proteins,
associated signal pathways and structured biological net-
works [1,2,4,26]. Using COGRIM modeling, we predicted NF-
κ
B regulons, which refer to the sets of genes under regulation
of specific TFs, such as NF-
κ
B RELA. Using IPA, we examined
how NF-
κ
B regulons connected as networks in cells with dif-
ferent p53 status. IPA defines networks as a group of biologi-
cally related genes, proteins or other molecules based on
experimentally derived genomic datasets and relationships
through dynamical computation and manual extraction of
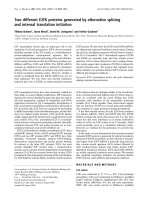
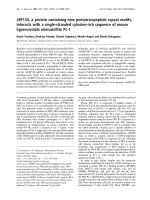
A schematic diagram of computational, analytic and experimental strategiesFigure 1
A schematic diagram of computational, analytic and experimental strategies. COGRIM modeling was performed by integrating four data sources, including
microarray analysis of genes differentially expressed by cancer cells, the promoter sequences extracted from genomic databases, NF-
κ
B binding activity in
cancer cells, and the NF-
κ
B PWMs from Transfac. The predicted NF-
κ
B target genes were subjected to Ingenuity Pathway Analysis, and NF-
κ
B-associated
networks and signaling pathways were identified. The predicted NF-
κ
B target genes were validated by real time RT-PCR, gene knocking down by siRNA,
and NF-
κ
B specific binding assays.
24k cDNA microarray
Regulation
NF-κB regulons
748 genes
Network scoring
IPA
1265 differentially expressed genes
Expression data NF-κB PWMs Promoter sequences
Experimental validation
- Q-RT-PCR
- Binding assay
- siRNA
COGRIM modeling
g
it
=
α
i
+
β
j
C
ij
f
jt
j =1
J
∑
+
ε
it
IPKB
Functional annotation
Known NF-κB
target genes
Signaling pathways
Gene networks
NF-κB binding activity
Transfac
NF-κB
Genome Biology 2008, Volume 9, Issue 3, Article R53 Yan et al. R53.5
Genome Biology 2008, 9:R53
thousands of direct and indirect physical and functional
interactions from peer-reviewed publications. The relation-
ships in the network include protein-protein interactions,
protein binding to DNA or RNA, protein enzyme and sub-
strate interactions, as well as transcriptional and transla-
tional regulation, as described in Figure 3.
We observed that RELA or NF
κ
B1 dominant networks ranked
top in each subset of cells (Figure 3 and Additional data file 3),
consistent with the importance of NF-
κ
B regulons predicted
by COGRIM. Specifically, in cells with wild-type p53-deficient
status, the top-ranked network with RELA included: seven
up-regulated genes (compared with human normal keratino-
cytes), such as IL6, IL8, BIRC2, TNFAIP2, IKBKE, and so on;
nine down-regulated genes, such as IL1A, CSF2, CDKN1A,
and so on; plus four molecular complexes/groups, such as
cAMP responsive element binding protein and p300 (CBP/
p300), IL1, activating protein-1 (AP1) and RNA polymerase II
(Figure 3a). In cells with mutant p53 status, the top-ranked
network with RELA included: seven up-regulated genes, such
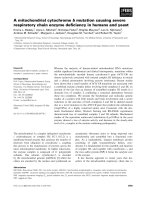
Distribution of predicted NF-
κ
B target genesFigure 2
Distribution of predicted NF-
κ
B target genes. (a) The distribution of predicted NF-
κ
B target genes in UM-SCC cells with different p53 status using five
NF-
κ
B binding PWMs. (b) The distribution of predicted genes regulated by RELA, NF
κ
B1, or cREL using individual PWMs. (c) Comparison of distribution
(%) of predicted genes by RELA, NF
κ
B1, or cREL regulation in the up-regulated gene group of UM-SCC cells (left), and in the cells with wild-type p53-
deficient status (right).
§
Statistical significance by chi square (X
2
, P < 0.001).
(a) (b)
wt+mt p53
wt p53-deficient mt p53
0
125
74 117
250
1737
RELA
NFκB1 cREL
57
197
55 92
124
5634
(c)
0
10
20
30
40
50
60
70
RELA NFκB1 cREL
% of gene number
wt p53-deficient
mt p53
up-regulated
§
0
10
20
30
40
50
60
70
RELA NFκB1 cREL
% of gene number
up-regulated
down-regulated
wt p53-deficient
§
Genome Biology 2008, 9:R53
Genome Biology 2008, Volume 9, Issue 3, Article R53 Yan et al. R53.6
Figure 3 (see legend on next page)
(a) (b)
(c) (d)
Genome Biology 2008, Volume 9, Issue 3, Article R53 Yan et al. R53.7
Genome Biology 2008, 9:R53
as IL6, REL, IL2RA, TNFAIP2, and so on; eight down-regu-
lated genes, such as IL1A, IL1B, CSF2, CDKN1A, and so on;
plus several complexes/groups, such as CBP/p300, AP1, IL1/
IL6/tumor necrosis factor (TNF), IL1 receptor (IL1R) and his-
tone H3 (Figure 3b). In the top-ranked network related to
NF
κ
B1, only four genes were identified in cells with wild-type
p53-deficient status: PPARG, CDKN1A, CSF2, PTGS2, plus
AP1 complex (Figure 3c). In cells with mutant p53 status,
NF
κ
B1 was linked with seven up-regulated genes, such as
CCDN1, IL6, REL, TNFAIP2, and so on; five down-regulated
genes, such as CDKN1A, ETS1, CSF2, and so on; plus six com-
plexes/groups, such as CBP/p300, AP1, CREB (cAMP
Responsive Element Binding Protein), STAT, ETS and his-
tone H3 (Figure 3d). Here we noticed that there were excep-
tionally fewer NF
κ
B1 target genes connected in cells with
wild-type p53-deficient status. Thus, the network analyses
revealed potentially unique interactive relationships of NF-
κ
B regulons in the subgroups of cells with different p53
status.
NF-
κ
B regulon associated signal pathways
Next, we analyzed how NF-
κ
B regulons are related to other
signal pathways using IPA with a significance level of P <
0.05; relationships to different NF-
κ
B subunits, such as
RELA and NF
κ
B1, were determined and are shown in Figure
4. A detailed list of genes involved in each pathway is pre-
sented in Table 1. Figure 4a shows, for the pathways com-
posed of the up-regulated genes in the broader panel of UM-
SCC cells, that all NF-
κ
B family members were associated
with the pathways of leukocyte extravasation, inositol phos-
phate metabolism and xenobiotic metabolism (top panels and
left panel in the second row). Insulin-like growth factor (IGF)
signaling was significantly associated with all NF-
κ
B family
members in tumor cells with mutant p53 status (middle panel
in the second row). However, genes involved in the IL-6 sign-
aling pathway were most significantly associated with RELA
in cells with wild-type p53 status (right panel of the second
row). When the genes down-regulated broadly in UM-SCC
cells were analyzed (Figure 4b), Wnt/
β
-catenin signaling and
transforming growth factor (TGF)-
β
signaling pathways were
related to all NF-
κ
B family members, while RELA was domi-
nantly associated with components of the neuregulin signal-
ing pathway (the third row). In the remaining signaling and
functional pathways, with the exception of cell cycle:G2/M
checkpoint components, different NF-
κ
B subunits were asso-
ciated with down-regulated genes in cells with mutant p53
status, whereas cell cycle:G2/M checkpoint was the only
pathway associated more significantly with RELA in cells
with wild-type p53-deficient status (Figure 4b, rows 4-6). The
analysis provides evidence for potential differences in the
contribution of NF-
κ
B subunits in the regulation of genes
involved in the signature pathways of the subset tumor cells
with different p53 status.
Modulation of NF-
κ
B target gene expression by TNF-
α
and small interfering RNA
The predicted NF-
κ
B target genes involved in the networks
and pathways were first validated by experimental modula-
tion of gene expression under TNF-
α
, a classic NF-
κ
B
inducer. We previously showed that TNF-
α
regulated a wide
set of genes from one of the over-expressed clusters in UM-
SCC, including AKAP12, BAG2, ICAM1, IGFBP3, IL6, IL8,
TNFAIP2, and PIK3R3 [14]. In this study, we tested another
14 genes identified in NF-
κ
B related networks and pathways,
including IL8 as a positive control (Figure 5). Expression of
the genes modulated by TNF-
α
showed different kinetics.
This included one group consisting of IL8, IL1A, IL1B, CSF2,
REL, and VEGFC, which showed a rapid induction pattern
typical of early response genes, where the peak of gene induc-
tion was observed around 1-2 hours with a rapid tapering
back to the base line. In contrast, gene expression of IL1R2,
IKBKE, ALDH1A3, ITGA2 and ITGA5 exhibited a slower time
dependent induction (Figure 5).
To further examine whether the expression of predicted NF-
κ
B target genes was affected by NF-
κ
B subunits RELA or
NF
κ
B1, we knocked down RELA or NF
κ
B1 individually by
small interfering RNAs (siRNAs). As shown in Figure 6, after
knocking down RELA or NF
κ
B1 for 24 or 48 hours, the
expression levels of RELA or NF
κ
B1 were dramatically
reduced by more than 90% compared with control siRNA.
Knocking down RELA reduced NF
κ
B1 gene expression signif-
icantly at 48 hours and slightly decreased IL8, IL6 and
IGFBP3 expression. However, knocking down NF
κ
B1 signifi-
cantly increased the gene expression at 48 hours, suggesting
that NF
κ
B1 may mediate suppression of basal expression of
these genes. Furthermore, knocking down RELA or NF
κ
B1
suppressed IL1A, IL1B, IL1R2, IL1RN, CSF2, CDKN1A,
ITGA5, LAMA3 and LAMB3 genes, more significantly at 48
hours. The expression of ICAM1 was affected more signifi-
cantly by knocking down RELA than NF
κ
B1.
The binding activities of RELA and NF
κ
B1 in UM-SCC
cells
The binding activities of individual subunits of NF-
κ
B, such
as RELA and NF
κ
B1, to synthetic oligonucleotides equivalent
to predicted sequences of promoters of selected genes were
quantified using a commercially available binding assay, as
described in Materials and methods. NF-
κ
B family TF assays
were performed for three UM-SCC cell lines (Figure 7a). All
RELA or NF
κ
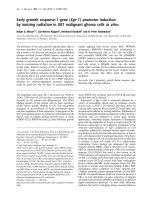
B1 dominant networks revealed by IPAFigure 3 (see previous page)
RELA or NF
κ
B1 dominant networks revealed by IPA. (a, b) RELA or (c, d) NF
κ
B1 dominant networks in cells with wild-type p53-deficient (a, c) or
mutant p53 (b, d) status were generated by IPA and showed graphically. The brightness of node colors is proportional to the fold changes of gene
expression levels. Color indicates up-regulated (red) and down-regulated (green) genes. Blue lines indicate direct connections of RELA or NF
κ
B1 with
genes through different functionalities.
Genome Biology 2008, 9:R53
Genome Biology 2008, Volume 9, Issue 3, Article R53 Yan et al. R53.8
Figure 4 (see legend on next page)
(a)
Leukocyte Extravasation
0.0
1.0
2.0
3.0
4.0
NF-κBRELANFκB1
*
**
*
*
*
*
**
*
*
Xenobiotic Metabolism
0.0
1.0
2.0
NF-κBRELANFκB1
*
*
*
*
*
*
*
Inositol Phosphate Metabolism
0.0
1.0
2.0
3.0
NF-κBRELANFκB1
**
*
*
IGF-1 Signaling
0.0
1.0
2.0
NF-κBRELANFκB1
*
*
*
IL-6 Signaling
0.0
1.0
2.0
NF-κBRELANFκB1
*
(b)
)eis(gol- )e
wt p53-deficient
Ephrin Receptor Signaling
0.0
2.0
4.0
6.0
NF-κBRELANFκB1
*
*
*
*
*
**
*
*
*
Wnt/ β-catenin Signaling
0.0
1.0
2.0
3.0
NF-κBRELANFκB1
*
*
*
Cell Cycle: G2/M Checkpoint
0.0
1.0
2.0
3.0
NF-κBRELANFκB1
*
*
*
*
Neuregulin Signaling
0.0
1.0
2.0
3.0
NF-κBRELANFκB1
*
*
*
*
PPAR Signaling
0.0
1.0
2.0
3.0
NF-κBRELANFκB1
*
*
*
*
GM-CSF Signaling
0.0
1.0
2.0
NF-κBRELANFκB1
*
*
*
Integrin Signaling
0.0
2.0
4.0
NF-κBRELANFκB1
*
*
*
*
*
*
*
*
.
VEGF Signaling
0.0
1.0
2.0
NF-κBRELANFκB1
*
*
*
NF-κB Signaling
0.0
1.0
2.0
NF-κBRELANFκB1
*
*
*
*
p38 MAPK Signaling
0.0
1.0
2.0
3.0
NF-κBRELANFκB1
*
*
*
TGF-β Signaling
0.0
1.0
2.0
3.0
NF-κBRELANFκB1
*
*
*
*
*
**
*
PTEN Signaling
0.0
1.0
2.0
NF-κBRELANFκB1
*
*
*
wt+mt p53
mt p53
gnificanc-log(significanc
Genome Biology 2008, Volume 9, Issue 3, Article R53 Yan et al. R53.9
Genome Biology 2008, 9:R53
cell lines exhibited constitutively active RELA or NF
κ
B1 bind-
ing activities, which were induced further by TNF-α (Figure
7a). To dissect the specific binding activity of each NF-
κ
B sub-
unit to their cognate promoter sequences as predicted above,
we performed NF-
κ
B binding assays using the promoter-spe-
cific DNA oligonucleotides. We observed similar constitutive
and inducible binding activities for the IL8 promoter
sequence by both RELA and NF
κ
B1 in the control oligonucle-
otide generated by Active Motif (containing only the 10 bp
core sequence of the RELA binding motif, Figure 7b, upper
left panel), or using oligonucleotides containing a larger 50 bp
sequence that included the RELA binding motif (Figure 7b,
upper middle panel). These data are consistent with the pre-
vious experimental results using electrophoretic mobility
shift assay and chromatin immunoprecipitation (ChIP),
showing that RELA/NF
κ
B1 heterodimers are involved in the
binding of the IL8 promoter, leading to target gene expres-
sion [6,14]. Next, we tested the binding activity on the pro-
moters of less studied NF-
κ
B targeted genes. The promoter of
IGFBP3 was predicted to contain NF-
κ
B_Q6 binding motifs,
which can not discriminate the binding activities of specific
NF-
κ
B subunits, and our results support the prediction (Fig-
ure 7, upper right panel). In promoters of the remaining three
genes, both RELA- and NF
κ
B1-specific binding motifs were
predicted. In most cases, we observed the basal and TNF-α-
induced binding activities of RELA or NF
κ
B1 (Figure 7, lower
panels). Our experimental data confirmed the predicted bind-
ing motifs of selected genes tested.
Based on the predicted binding activity, we generated a logo
of RELA or NF
κ
B1 binding motifs predicted by COGRIM
from 202 and 151 genes, respectively (Figure 7a, upper pan-
els). Our logos of RELA and NF
κ
B1 binding motifs are very
similar to their consensus sequences and logos generated
from position weighted matrices (PWMs) of Transfac 8.4:
GGRRATTTCC
(RELA) and GGGGATYCCC (NF
κ
B1), where
underlined sequences represent core sites, and R = A or G,
and Y = C or T.
Discussion
In this study, we used a newly developed COGRIM statistical
model to systematically define NF-
κ
B regulons of genes dif-
ferentially expressed by UM-SCC cells (Figures 1 and 2).
These NF-
κ
B regulons are connected to networks and signal
pathways, for which there is evidence of significant involve-
ment in tumorigenesis (Figures 3 and 4, and Table 1). Our
experimental data confirmed and validated computational
and bioinformatic predictions for NF-
κ
B regulation and bind-
ing activity on the promoter sequences of a selection of these
genes (Figures 5, 6, 7), indicating that NF-
κ
B family members
function as important master controls of gene expression,
coordinating action within networks and pathways that con-
tribute to the malignant phenotype of UM-SCC. Our study
revealed the power of a systems biology analysis using
COGRIM modeling and IPA to identify molecular signatures
at the global level that are modulated by functionally active
TFs, interacting networks and signaling pathways.
This study is the first utilization of COGRIM to analyze a fam-
ily of TFs in a human cancer system [47,53]. Previously, there
have been limited genome-wide computational analyses of
NF-
κ
B binding activity and regulated genes related to malig-
nant phenotypes and genotypes, due to the complexity of NF-
κ
B regulatory mechanisms, heterogeneous cancer subtypes,
and inherent limitations or biases in computational and
experimental conditions. An important feature of the COG-
RIM model is the ability to computationally analyze complex
transcriptional regulatory mechanisms by simultaneously
integrating multiple large scaled data sources, in a principled
and robust fashion without requiring a priori knowledge of
the relative accuracy of each data source. This model-based
strategy greatly improved the efficiency and accuracy of the
elucidation of the functional and physical relationships
among the TFs, pathways and networks. Although the linear
model of expression used as a basis for COGRIM is an approx-
imation of transcriptional regulation, it has proven to be
effective in other investigations [54-56]. One potential limita-
tion of COGRIM is that the TF activity f
jt
must be approxi-
mated by a proxy measure such as the expression level of the
gene that codes for that TF. The predicted functions of TFs are
confirmed with experimental results even when extensive
ChIP binding data were not available [47].
As described previously [47], the COGRIM method includes a
probabilistic model for each data source that addresses the
inherent uncertainty within each data type. COGRIM is more
than a simple extension of previous linear models in that it
provides a principled mechanism for integrating sequence
features with expression data for the prediction of target
genes and can be further extended in several interesting
directions in the presence of additional data sources. It
NF-
κ
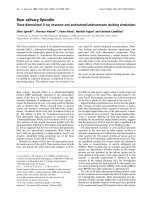
B target genes were reverse-engineered and assigned to signaling pathways with significant implication in the malignant phenotypeFigure 4 (see previous page)
NF-
κ
B target genes were reverse-engineered and assigned to signaling pathways with significant implication in the malignant phenotype. NF-
κ
B target
genes were analyzed by IPA and the pathways with statistical significance were presented. The y-axis represents the statistical significances in log scale of
each signaling pathway, and the x-axis indicates the predicted genes specifically regulated by NF-
κ
B subunits. On the x-axis, 'NF-
κ
B' refers to common NF-
κ
B regulation (not subunit specific), and 'RELA' and 'NF
κ
B1' refer to regulation by RELA or NF
κ
B1 subunits, respectively. (a) Pathways associated with up-
regulated genes in cancer cells with different p53 statuses; (b) pathways associated with down-regulated genes. *Pathways that reached a statistically
significant level (P < 0.05).
Genome Biology 2008, 9:R53
Genome Biology 2008, Volume 9, Issue 3, Article R53 Yan et al. R53.10
Table 1
Signal pathways associated with NF-
κ
B regulons in UM-SCC cells
Tumor type* Pathway p53
†
P-value
‡
Genes
§
All subgroups Ephrin receptor signaling W 8.1 × 10
-3
ANGPT1↓, CXCL14↓, EFNB1↓, EPHB2↑, EPHB4↓, ITGA2↓,
GNA15↓, GNAI2↓, GNB1↓, GNG12↓, IL8↑, PGF↓
M2.3 × 10
-3
AKT1↓, ANGPT1↓, AXIN1↑, CXCL14↑, EFNB1↓, GNA15↓,
GNAI2↓, GNB2↓, GNB4↓, GNG12↓, ITGA2↓, MAP4K4↓, PGF↓,
RASA1↑, RAC2↓, RHOA↓, VEGFC↓
W+M 8.9 × 10
-4
ANGPT1↓, AXIN1↑, CXCL14↑, EFNB1↓, EPHB2↑, GNAI2↓,
GNA15↓, GNG12↓, IL8↑, ITGA2↓, PGF↓, RAC2↓, RHOA↓, VEGFC↓
Leukocyte extravasation signaling W 4.4 × 10
-2
CD99↓, CLDN7↑, CXCL14↓, CYBA↑, GNAI2↓, ICAM1↑, IL8↑,
PRKCQ↓, TIMP2↑, VASP↓
M1.8 × 10
-3
ACTN3↓, ACTG2↓, CD99↓, CD44↓, CLDN7↑, CXCL14↑, CYBA↑,
GNAI2↓, MMP13↑, PIK3R3↑, PLCG2↑, RAC2↓, RHOA↓, TIMP2↑,
VASP↓
W+M 7.9 × 10
-5
ACTN3↓, CD99↓, CLDN7↑, CXCL14↑, CYBA↑, GNAI2↓, ICAM1↑,
IL8↑, MMP13↑, PIK3R3↑, PLCG2↑, PRKCQ↓, RAC2↓, RHOA↓,
TIMP2↑, VASP↓
Wnt/β-catenin signaling W 3.2 × 10
-2
DKK3↓, GJA1↓, PPP2R5B↓, SFRP1↓, SOX8↓, SOX9↓, TCF4↓,
TGFBR2↓, TLE4↓
M3.4 × 10
-2
AKT1↓, AXIN1↑, CCND1↑, CD44↓, DKK3↓, SOX9↓, SFRP1↓,
TCF4↓, TGFB2↓, TGFBR2↓
W+M 2.8 × 10
-2
AXIN1↑, CCND1↑, DKK3↓, PPP2R5B↓, SFRP1↓, SOX8↓, SOX9↓,
TCF4↓ TGFBR2↓
Xenobiotic metabolism signaling W 1.2 × 10
-2
ALDH1A3↑, ALDH4A1↓, ALDH5A1↑, FMO3↓, GSTM2↓, IL1A↓,
IL6↑, NOS2A↓, NQO1↑, PPARBP↓, PPP2R5B↓, PRKCQ↓, SULT1A3↑
M8.7 × 10
-3
ALDH1A2↑, ALDH1A3↑, ALDH3B2↑, CYP1A2↑, CYP3A4↓,
EIF2AK3↓, FMO3↓, IL1A↓, IL1B↓, IL6↑, NFE2L2↑, NQO1↑,
PIK3R3↑, PPARBP↓, SULT1A3↑
W+M 1.6 × 10
-3
ALDH1A2↑, ALDH5A1↑, ALDH1A3↑, ALDH3B2↑, CYP3A4↓,
FMO3↓, IL1A↓, IL6↑, NOS2A↓, NQO1↑, PIK3R3↑, PPARBP↓,
PPP2R5B↓, PRKCQ↓, SULT1A3↑
ERK/MAPK signaling W+M 4.2 × 10
-2
DUSP4↓, DUSP6↓, ELF3↑, ETS1↓, ITGA2↓, PIK3R3↑, PLCG2↑,
PPP2R5B↓, PPARG↑, RAC2↓
Inositol phosphate metabolism W+M 1.7 × 10
-2
ISYNA1↑, ITPKA↑, NEK2↑, PIK3R3↑, PIM1↑, PLK1↑, PRKCQ↓,
PLCD1↓, PLCG2↑, PRKX↓
IL-6 signaling W 4.4 × 10
-2
IKBKE↑, IL1A↓, IL1R2↓, IL1RN↓, IL6↑, IL8↑
M1.7 × 10
-2
IL1A↓, IL1B↓, IL1R2↓, IL6↑, IL6ST↓, TNFRSF1A↓, MAP4K4↓, LBP↑
p38 MAPK signaling W 4.8 × 10
-2
DUSP10↑, IL1A↓, IL1R2↓, IL1RN↓, MAPKAPK3↓, TGFBR2↓
M3.5 × 10
-3
DUSP10↑, IL1A↓, IL1B↓, IL1R2↓, MAPKAPK3↓, PLA2G4B↑,
TGFB2↓, TGFBR2↓, TNFRSF1A↓
Wild-type p53-deficient Cell cycle:G2/M DNA damage W 3.5 × 10
-3
CDKN1A↓, PLK1↑, RPS6KA1↓, SFN↓, TOP2A↑
checkpoint regulation W+M 1.8 × 10
-2
CDKN1A↓, PLK1↑, SFN↓, TOP2A↑
Neuregulin signaling W 3.4 × 10
-2
ADAM17↓, ITGA2↓, NRG2↓, PDK1↑, PICK1↓, PRKCQ↓
PPAR signaling W 3.6 × 10
-2
IL1A↓, IL1R2↓, IL1RN↓, IKBKE↑, PPARBP↓, PPARG↑
Protein ubiquitination pathway W 3.1 × 10
-2
BIRC2↑, CDC20↑, DOC1↓, FBXW7↓, NEDD4L↓, PSMB10↑,
SMURF2↓, UBE2H↓, UBE2L6↑, USP6↓
Mutant p53 GM-CSF signaling M 1.5 × 10
-2
AKT1↓, CCND1↑, CFS2↓, ETS1↓, PIK3R3↑, PPP3CC↓
W+M 6.0 × 10
-3
CCND1↑, CFS2↓, ETS1↓, PIK3R3↑, PIM1↑, PPP3CC↓
Genome Biology 2008, Volume 9, Issue 3, Article R53 Yan et al. R53.11
Genome Biology 2008, 9:R53
should also be noted that although we have focused on TFs,
the model would work equally well with regulatory factors
that are not proteins but whose levels can be measured and
whose binding sites can be identified (for example, microR-
NAs). COGRIM represents an initial step toward solving the
problem of integrating available biological information in a
principled fashion. Our belief is that this goal will best be
accomplished by fitting large and flexible probability models
that combine data from various experimental and compiled
sources in a structured or multi-level framework. We
anticipate that the model will become even more valuable as
the accuracy and coverage of expression and sequence feature
data improve.
Using COGRIM in this study, 748 putative NF-
κ
B target
genes were identified, which consisted of 59% of 1,265 differ-
entially expressed genes from microarray analysis in UM-SCC
cells (Figure 1 and Additional data file 1). This ratio is slightly
higher than the frequency of all predicted NF-
κ
B binding
motifs calculated in vertebrates (approximately 50%, includ-
ing human, mouse and rat data from the Genomatix promoter
database), but is slightly lower than the frequencies of NF-
κ
B
binding motifs predicted in the up-regulated gene clusters
enriched with known NF-
κ
B related genes published
previously (approximately 65-70% in B-C gene clusters) [14].
The prediction is consistent with the hypothesis and experi-
mental data that NF-
κ
B regulated genes are over-represented
in tumor associated gene signatures, especially in the up-reg-
ulated gene clusters [14]. Interestingly, the overall ratio of
approximately 60% of differentially expressed genes in
human UM-SCC cells is remarkably consistent with the
approximate percentage of genes in murine squamous cell
carcinoma restored to expression levels seen in non-malig-
nant cells of syngeneic origin by inhibition of NF-
κ
B using an
inducible mutant I
κ
B
α
[13]. Inhibition of NF-
κ
B and target
genes in this murine model was accompanied by decreased
proliferation, migration, cell survival, angiogenesis and tum-
origenesis [13]. The murine NF-
κ
B modulated gene signature
was independently associated with a gene signature associ-
ated with decreased prognosis in a large series of human
HNSCC[43]. Together, these experimental and in silico anal-
yses of expression profiling data in murine and human squa-
mous cell carcinoma are consistent with involvement of NF-
κ
B as a key regulatory factor in global alterations in gene
expression in squamous cell carcinoma.
The efficiency and accuracy of COGRIM prediction are also
supported by cross validation with other experimental data
from published literature, as well as with our experimental
results from UM-SCC cells upon TNF-
α
stimulation or siRNA
knock down of NF-
κ
B (Figures 5, 6, 7) [14]. Among the 748
genes predicted as NF-
κ
B target genes, 75 of them (10%; in
bold in Additional data file 1) overlapped with approximately
600 NF-
κ
B target genes published previously by the three
websites described in the Materials and methods, indicating
most of the predicted genes represent novel NF-
κ
B target
genes. Additionally, only 16 genes of the list of 1,265 'known
NF-
κ
B genes' based on these websites were excluded from our
predicted gene list, due to low probability scores by COGRIM
modeling (data not shown). Among the 16 genes, 3 were pre-
viously implicated in HNSCC and other cancers, namely
AREG (amphiregulin), MMP14, and MYC. After searching the
original references, we found the reference for AREG was
incorrectly cited. For MMP14, a NF-
κ
B binding motif was
IGF-1 signaling M 2.0 × 10
-3
AKT1↓, CYR61↓, IGFBP2↑, IGFBP3↑, IGFBP6↑, IRS1↑, PIK3R3↑,
RASA1↑, SFN↓
W+M 3.0 × 10
-2
CYR61↓, IGFBP2↑, IGFBP3↑, IGFBP6↑, PIK3R3↑, SFN↓
Integrin signaling M 1.3 × 10
-3
ACTG2↓, ACTN3↓, AKT1↓, BCAR3↓, DDEF1↓, ITGA2↓, ITGA5↓,
ITGB4↓, LAMA3↓, LAMB3↓, LAMC2↓, PIK3R3↑, PLCG2↑, RAC2↓,
RHOA↓, RHOC↓, TSPAN4↓, TSPAN7↑, VASP↓
W+M 2.6 × 10
-2
ACTN3↓, ITGA2↓, ITGA5↓, ITGA6↓, ITGB4↓, LAMA3↓, LAMB3↓,
LAMC2↓, PIK3R3↑, PLCG2↑, RAC2↓, RHOA↓, RHOC↓, VASP↓
VEGF signaling M 7.8 × 10
-3
ACTG2↓, ACTN3↓, AKT1↓, PGF↓, PIK3R3↑, PLCG2↑, SFN↓,
VEGFC↓
W+M 3.1 × 10
-2
ACTN3↓, PGF↓, PIK3R3↑, PLCG2↑, SFN↓, VEGFC↓
NF-
κ
B signaling M 1.7 × 10
-2
AKT1↓, BCL10↓, IL1A↓, IL1R2↓, IL1B↓, MALT1↓, MAP4K4↓,
PIK3R3↑, PLCG2↑, TNFRSF1A↓
SAPK/JNK signaling M 2.0 × 10
-2
DUSP4↓, DUSP10↑, EDG5↓, IRS1↑, MAP4K4↓, PIK3R3↑, RAC2↓,
SH2D2A↓, ZAK↓
Shown are signaling pathways associated with NF-
κ
B regulons in UM-SCC cells using IPA 5.0 with a significant enrichment (P < 0.05). *Subgroups
with different p53 statuses that are associated with the major signal transduction pathways.
†
The subgroups within each pathway based on p53 status:
W refers to five UM-SCC cell lines with wild-type-deficient status; M refers to five UM-SCC cell lines with mutant p53 status; and W+M refers to ten
UM-SCC cell lines.
‡
Statistical significance of a given pathway (cut off, P < 0.05).
§
Genes included in the pathway by IPA; up and down arrows indicate
up- and down-regulated gene expression with two-fold or more changes.
Table 1 (Continued)
Signal pathways associated with NF-
κ
B regulons in UM-SCC cells
Genome Biology 2008, 9:R53
Genome Biology 2008, Volume 9, Issue 3, Article R53 Yan et al. R53.12
observed in the promoter; however, it is located at -1,165 bp
from the transcriptional stating site, which is outside the
proximal promoter sequence defined in this study. The refer-
ence for MYC was published in 1990, for which the consensus
sequence of the NF-
κ
B binding motif cited does not exist in
the most updated human genome sequence (data not shown).
However, there are several references suggesting other subu-
nits of NF-
κ
B could be involved in the regulation of MYC,
including evidence that the RELB/p52 complex can directly
bind to the MYC gene promoter [24]. However, the PWM of
RELB/p52 binding motifs has not been well established, and
the computation in this study did not include RELB/p52.
There have been reports about possible involvement of cREL
in MYC gene expression but without discussing detailed
mechanisms [24,57]. Thus, the COGRIM modeling in this
study successfully predicted 82% (75/91) of known NF-
κ
B
genes identified. The few cases of failed prediction could be
either due to errors in literature citations, or because the loca-
tion of the NF-
κ
B binding site is outside of the promoter
sequence boundary selected for this study.
Basal and inducible expression of NF-
κ
B target genes modulated by TNF-
α
Figure 5
Basal and inducible expression of NF-
κ
B target genes modulated by TNF-
α
. UM-SCC 6 cells were treated with TNF-
α
(2000 units/ml) for different times.
Total RNA was isolated, and genes selected from NF-
κ
B networks or pathways were analyzed by real time RT-PCR. The data are presented as the mean
plus standard deviation from triplicates with normalization by 18S ribosome RNA. *P < 0.05 compared with the control (t test).
0
5
10
15
20
IL8
*
*
*
*
*
*
0.0
1.0
2.0
3.0
4.0
IL1A
*
*
0.0
2.0
4.0
6.0
8.0
IL1B
*
*
*
***
0.0
2.0
4.0
6.0
8.0
IL1R2
*
*
*
*
0.0
2.0
4.0
6.0
IL1RN
*
*
*
*
**
0
10
20
30
40
CSF2
*
*
*
*
*
*
0.0
1.0
2.0
VEGFC
*
0.0
1.0
2.0
cRel
*
*
0.0
1.0
2.0
IKBKE
*
*
*
*
*
*
0.0
2.0
4.0
6.0
8.0
CDKN1A
*
*
*
*
*
*
0.0
1.0
2.0
A
LDH1A
3
*
*
*
*
*
*
0.0
1.0
2.0
3.0
ITGA2
*
*
*
*
*
0.0
1.0
2.0
ITGA5
*
control 1 2 4 6 8 24
TNF-α
(
h
)
*
*
*
0.0
1.0
2.0
LAMA3
*
control 1 2 4 6 8 24
TNF-α
(
h
)
**
*
*
*
0.0
1.0
2.0
3.0
4.0
LAMB3
*
*
control 1 2 4 6 8 24
TNF-α
(
h
)
**
*
*
Relative gene expression (arbitrary unit)
Genome Biology 2008, Volume 9, Issue 3, Article R53 Yan et al. R53.13
Genome Biology 2008, 9:R53
We experimentally validated a selected subset of predicted
NF-
κ
B genes involved in signal pathways, using TNF-
α
and
siRNA as tools. We showed that TNF-
α
significantly
enhanced gene expression of 15 genes selected from the pre-
diction, where 6 are novel NF-
κ
B targets, including IL1R2,
ALDH1A3, ITGA2, ITGA5, LAMA3 and LAMB3 (Figure 5 and
Additional data file 1). To date, we have experimentally tested
expression of a total of 47 genes in response to TNF-
α
(Figure
5) [14], where 41 genes were identified as NF-
κ
B target genes
by COGRIM, of which 23 are novel. Previously, there have
been several experimental studies attempting to globally
investigate NF-
κ
B binding activity and regulated gene expres-
sion, including RELA binding activity throughout human
chromosome 22 [58], and TNF-
α
-induced NF-
κ
B target gene
expression in HeLa cells [59,60], U937 monocytic cells [61],
lipopolysaccharide-stimulated human peripheral blood
mononuclear cells [62], and THP.1 cells transfected with
IKK
γ
[63]. Under TNF-
α
stimulation, 767 genes (P < 0.05) or
Silencing RELA or NF
κ
B1 by siRNA significantly altered gene expressionFigure 6
Silencing RELA or NF
κ
B1 by siRNA significantly altered gene expression. UM-SCC 6 cells were transfected with siRNA to RELA or NF
κ
B1 for 24 or 48
hours. Total RNA was isolated, and genes selected from NF-
κ
B networks or pathways were analyzed by real time RT-PCR. The data were calculated as
the mean plus standard deviation from triplicates with normalization by 18S ribosome RNA, and are presented as the comparison with the cultured cells
transfected with the control siRNA oligos. *P < 0.05 (t test).
0.0
0.5
1.0
1.5
Control RELA NFκB1
**
RELA
0.0
0.5
1.0
1.5
*
*
NF
κ
B1
*
0.0
1.0
2.0
*
*
IL8
*
*
0.0
0.5
1.0
1.5
2.0
2.5
*
*
IL6
*
0.0
0.5
1.0
1.5
**
IL1A
0.0
0.5
1.0
1.5
*
*
IL1B
*
*
0.0
0.5
1.0
1.5
*
*
IL1R2
0.0
0.5
1.0
1.5
*
*
IL1RN
*
0.0
0.5
1.0
1.5
*
*
CSF2
*
0.0
0.5
1.0
1.5
**
CDKN1A
**
0.0
0.5
1.0
1.5
*
*
IGFBP3
0.0
0.5
1.0
1.5
*
*
ICAM1
*
0.0
0.5
1.0
1.5
**
ITGA5
24 h 48 h
0.0
0.5
1.0
1.5
*
*
LAMA3
24 h 48 h
0.0
0.5
1.0
1.5
**
LAMB3
*
24 h 48 h
*
Relative gene expression (arbitrary unit)
Genome Biology 2008, 9:R53
Genome Biology 2008, Volume 9, Issue 3, Article R53 Yan et al. R53.14
Figure 7 (see legend on next page)
(a)
0.0
0.2
0.4
0.6
0.8
1.0
RELA
*
*
*
- + - + - + Raji Neg
1 1 6 6 22B 22B
TNF-α
UM-SCC
0.0
0.5
1.0
1.5
2.0
NFκB1
*
*
*
- + - + - + Raji Neg
1 1 6 6 22B 22B
TNF-α
UM-SC C
Relative binding activity
(OD
450nm
)
(b)
0.0
0.5
1.0
1.5
2.0
-TNFα
+TNFα
Raji
Neg
IL8
(Active Motif)
Oligo NF-κB
§
NF-κB
§
A
b RELA NFκB1
*
*
0.0
0.5
1.0
1.5
IL8
Oligo RELA RELA
A
b RELA NFκB1
*
*
0.0
0.5
1.0
IGFBP3
Oligo NF-κB_Q6 NF-κB_Q6
Ab RELA NFκB1
*
*
0.0
0.5
1.0
CDKN1A
(p21)
Oligo RELA NFκB1
A
b RELA NFκB1
*
*
0.0
0.5
ITGA5
2.5
Oligo RELA NFκB1
A
b RELA NFκB1
*
0.0
0.5
1.0
1.5
2.0
LAMB3
Oligo RELA NFκB1
Ab RELA NFκB1
*
*
Relative binding activity (OD
450nm
)
(c)
Genome Biology 2008, Volume 9, Issue 3, Article R53 Yan et al. R53.15
Genome Biology 2008, 9:R53
343 genes (P < 0.01) were differentially expressed by HeLa
cells [60], 348 genes exhibited NF-
κ
B binding activity in
U937 cells [61], and 79 or 72 genes were identified as NF-
κ
B
regulated and responsive to lipopolysaccharide in
macrophages [62,63]. Among these gene lists, a total of 88
genes were confirmed as NF-
κ
B-regulated genes and over-
lapped with our gene list (Additional data file 1), where 25
genes were identified as known NF-
κ
B genes listed by the
three websites previously mentioned. These experimental
data also cross-validate 63 putative NF-
κ
B target genes iden-
tified by our analysis.
We noticed different kinetics in the expression of gene sub-
sets induced by TNF-
α
in UM-SCC cell lines. The responsive
kinetics of many of the novel NF-
κ
B target genes are either
slowly induced, or induced and sustained without rapid
decrease (Figure 5), in contrast to the typical TNF-
α
-induced
early response gene, as observed for cytokines (IL1A, IL1B,
IL1RN, CSF2 and VEGFC) and a NF-
κ
B family member
(REL). Different kinetics of gene expression in response to
TNF-
α
treatment has been noticed previously [59], where
rapid oscillatory responses could be due to TNF-
α
-mediated
phosphorylation, degradation and re-synthesis of I
κ
B
α
, in
contrast to that of I
κ
B
β
and I
κ
B
ε
, which mediate prolonged
stimulation [64]. It has also been reported that the TNF-
α
-
induced early response pattern is seen often in genes with
conserved promoter regions [59]. This observation supports
the hypothesis that the genes with typical early response
inducible patterns are those with evolutionarily conserved
functions involved in the first line of defense, where a quick
reaction and termination mechanism is needed. The genes
with the slower induction patterns are involved in functions
such as adhesion and cell structure, where slower and persist-
ent responses are necessary.
We also observed that the predicted NF-
κ
B regulons are not
uniformly distributed in the subgroups of UM-SCC cells (Fig-
ure 2), and more genes with predicted RELA-specific regula-
tory motifs were observed in the up-regulated gene groups
with wild-type p53-deficient status (Figure 2c). This observa-
tion is in good agreement with the general consensus and
experimental data regarding the positive regulatory role of
RELA in controlling oncogenic gene expression [2,25,65],
and is consistent with our observation that in UM-SCC cells
with wild-type p53-deficient status a cluster of NF-
κ
B regu-
lated genes is over-expressed [14,35]. The experiments
knocking down RELA or NF
κ
B1 elucidated NF-
κ
B-mediated
specific regulatory mechanisms (Figure 6), and provided data
consistent with the previous findings that the basal expres-
sion of most of the NF-
κ
B-regulated genes depends on both
RELA and NF
κ
B1 (p65/p50 heterodimer). Negative regula-
tion of NF
κ
B1 compared to the basal gene expression was
consistent with a repressive function associated with p50
homodimers [1,2]. Furthermore, the binding activities of
RELA and NF
κ
B1 were confirmed in the promoter regions of
a typical NF-
κ
B target gene, namely IL8 (which served as the
positive control), in the promoters of atypical NF-
κ
B target
genes, namely IGFBP3 and CDKN1A, and in the promoters of
novel NF-
κ
B target genes, namely ITGA5 and LAMB3 (Figure
6b). Interestingly, CDKN1A is also a p53 target gene with
important function in the control of the cell cycle and apopto-
sis, and IGFBP3 is a p63 target gene involved in the IGF sign-
aling pathway [66]. Our data provide computational and
experimental evidence consistent with potential cross-talk
between the two important pathways, namely NF-
κ
B and
p53/p63, through which target genes could be transcription-
ally regulated by either or both TFs.
The NF-
κ
B target genes identified were connected by net-
works and functioned as regulons under direct interaction or
close regulation by RELA (Figure 3a,b), or NF
κ
B1 (Figure
3c,d). These gene groups included many known NF-
κ
B target
genes with confirmed NF-
κ
B binding sites, such as CCDN1,
CSF1, CSF2, ELF3, ICAM1, IL1A, IL1B, IL1RN, IL2RA, IL6,
IL8, and VIM. Interestingly, most of these known NF-
κ
B tar-
get genes appear in the networks with RELA (Figure 3a,b),
and are less significantly associated with NF
κ
B1 (Figure 3c,d).
This observation is consistent with the fact that RELA con-
tains the functional transactivation domain for mediating
gene transcription [2,25,65]. In addition, even fewer NF-
κ
B
target genes were connected with NF
κ
B1 in cells with wild-
type p53-deficient status (Figure 3c); this subgroup of cells
over-expressed genes with a high prevalence of RELA regula-
tion (Figure 2c). In this subgroup of cells (Figure 3c), more
genes were connected to peroxisome proliferator-activated
receptor gamma (PPARG), a member of the nuclear hormone
receptor subfamily. PPARG is able to form heterodimers with
retinoid X receptors, affect RELA cytoplasmic distribution
and negatively regulate inflammatory responses [67]. Inter-
estingly, in this network, PPARG is also linked with PPAR
binding protein, a PPAR co-activator with the ability to bind
to DNA and p53 protein [68,69]. Our and other data provide
computational and experimental evidence consistent with
potential cross-talk between the two important pathways,
namely NF-
κ
B and p53/p63, through which target genes
could be transcriptionally regulated by either or both TFs.
Binding activity and motif logo of RELA and NF
κ
B1Figure 7 (see previous page)
Binding activity and motif logo of RELA and NF
κ
B1. (a) The basal and inducible binding activity of RELA or NF
κ
B1 were tested using TransAM NF
κ
B
family kit in UM-SCC 1, 6 and 22B cells after TNF-
α
(2000 units/ml) treatment. 'Raji' and 'Neg' represent positive and negative controls, respectively. (b)
Binding activity of RELA and NF
κ
B1 in the promoter of NF-
κ
B target genes. The promoter sequences with putative RELA or NF
κ
B1 binding sites were
synthesized as 50-mer oligos and biotin labeled, and the assays were performed using TransAM flexi NF
κ
B family kit. *P < 0.05 compared with the control
(t test). (c) Motif logos of RELA and NF
κ
B1 were generated from 202 and 151 genes differentially expressed in UM-SCC with their putative binding sites,
respectively (upper panels). Motif logos of RELA and NF
κ
B1 from Transfac were included for the comparison (lower panels).
Genome Biology 2008, 9:R53
Genome Biology 2008, Volume 9, Issue 3, Article R53 Yan et al. R53.16
The up-regulated NF-
κ
B target genes are enriched in impor-
tant signal pathways implicated in most cancers, including
leukocyte extravasation, inositol phosphate metabolism, and
xenobiotic metabolism pathways (Table 1 and Figure 4a). The
pathways identified are consistent with previous evidence
from studies by us and others that NF-
κ
B promotes
proinflammation, pro-angiogenesis, cell adhesion and migra-
tion through up-regulation of genes involved in these path-
ways [4,6-16,70,71]. The inositol phosphate metabolism
pathway consists of molecular components of PI3K and pro-
tein kinase C pathways, both important signal pathways
implicated in promoting tumorigenesis, especially in epider-
mis and epithelia [72-75]. The involvement of NF-
κ
B with the
down-regulated genes has been less studied; in this study,
genes in Wnt/
β
-catenin and TGF-
β
pathways were down-reg-
ulated in all tumor cells through regulation in association
with all NF-
κ
B family members (Figure 4b). The Wnt/
β
-cat-
enin signaling pathway includes many negative regulators of
cell growth and survival, and the down-regulation of these
genes has been shown to be the critical step in tumorigenesis
in epidermis and epithelia [76]. Interestingly, the involve-
ment of RELA and NF
κ
B1 in the Wnt/
β
-catenin pathway was
not significant, suggesting other NF-
κ
B family members or
NF-
κ
B-independent intermediates could be involved. The
TGF-
β
signaling pathway is another negative regulatory path-
way and the resulting deficiency has been demonstrated in
HNSCC. Lu et al. [77] identified a defect of TGF-
β
receptor 2
(TGF
β
R2) and the related pathway that significantly contrib-
utes to HNSCC carcinogenesis and metastasis. Other signal
pathways identified are more specific to the phenotypic and
genotypic differences in UM-SCC cells resulting from differ-
ent p53 statuses (Figure 4). The pathways related to IGF,
integrins, receptor and intermediate signals (Ephrin recep-
tor, NF-
κ
B, p38 MAPK, PPAR and PTEN, and cytokines
(VEGF and GM-CSF are dominant in cells with mutant p53
status, which is consistent with either the loss of the negative
regulation (PTEN and PPAR), or the suppression of NF-
κ
B
and other signal pathways and genes by gaining or retaining
p53 functions in cells with mutant p53 status [14,35]. For cells
with wild-type p53-deficient status, down-regulated genes
were only involved in the cell cycle:G2/M DNA damage
checkpoint pathway, where RELA showed dominant effects
(Figure 4b).
This study provides a strong link between NF-
κ
B regulons
and related pathways identified by the systems biology
approaches, consistent with many conclusions previously
drawn from individual and classic biological experiments.
The data from both computational and experimental strate-
gies support the hypothesis that the malignant progression of
HNSCC is due to, or leads to, multiple genetic and phenotypic
defects, such as p53 mutation or underexpression [38,78],
and aberrant activation of several major growth factor and
cytokine receptor pathways, including the TNF receptor [16],
IL1R [9,39], IL6R [31], EGFR [10], hepatocyte growth factor
receptor/cMet [41], TGF-
β
receptor [77], and platelet-derived
growth factor receptor [79] pathways. These receptors modu-
late multiple signal pathways, including aberrant activation
of NF-
κ
B [6,7,19], AP1 [6,9], JAK/STAT [31], early growth
response-1(EGR1) [37], casein kinase 2 [11], MAPK [15], PI3K
[10,41], and BCL-XL/IAP associated apoptosis pathways [8].
Our previous report showed that the five major TFs - NF-
κ
B,
STAT3, AP1, EGR1, and p53 - are specifically implicated in the
unique gene signatures of UM-SCC cells [14], adding support-
ing evidence to current work that multiple transcriptional
mechanisms and signal pathways control specific gene and
pathway signatures that determine the malignant phenotypes
and the heterogeneous characteristics in UM-SCC cells.
In interpreting our current study, we recognize that there are
differences between cell lines and human tissues. However,
many of our previous studies using these cell lines have led to
the demonstration and confirmation of important molecular
findings made with them in tumor tissue and serum speci-
mens. These include the demonstration of alterations and the
biological and clinical significance of NF-
κ
B activation and of
multiple NF-
κ
B-regulated genes and cytokines expressed in
HNSCC tumor specimens and serum [18,32,33,42,80,81],
and the demonstration of an inverse relationship between
NF-
κ
B and p53 nuclear localization and associated protein
expression in tumors [35]. As a result, and to further examine
the validity of the results of the bioinformatic analysis of the
present study, we have recently undertaken a meta-analysis
of 34 microarray datasets of HNSCC (approximately 80%
from tissue specimens). Preliminary analyses are consistent
with key observations from this study using UM-SCC cell
lines, including that the molecules in, and/or regulated by,
the NF-
κ
B and p53 signaling pathways are significantly
enriched and related to HNSCC malignancy (B Yan et al.,
manuscript in preparation). Since there are many important
differences between the tumor cell lines in culture and human
tumor specimens, where the paracrine effects from fibrob-
lasts and other host cells are missing, it will be important in
future studies to integrate stromal cell gene and protein
expression data with functional studies of potential networks
involving these interactions.
Conclusion
We successfully predicted NF-
κ
B regulons through COGRIM
modeling and connected them into organized NF-
κ
B regula-
tory modules. This analysis revealed the concerted activation
of NF-
κ
B target genes or gene products, many of them previ-
ously identified as unrelated molecules. The analysis of NF-
κ
B regulons established a complex interaction comprising
novel or previously identified pathways and networks, where
the molecular signatures were particularly associated with
cells differing in p53 status. Our study identified pathway sig-
natures related to UM-SCC cells in general for over-activated
proinflammation, self-defense and inositol phosphate metab-
olism, as well as down-regulated Wnt/
β
-catenin, TGF-
β
and
neuregulin pathways. RELA-controlled over-activation of IL6
Genome Biology 2008, Volume 9, Issue 3, Article R53 Yan et al. R53.17
Genome Biology 2008, 9:R53
signaling and down-regulated cell cycle:G2M checkpoint was
specific for tumor cells with wild-type p53-deficient status.
Up-regulated IGF signaling and multiple down-regulated
pathways comprise the molecular signature for cells with
mutant p53 status. Such molecular signatures composed of
multiple pathways established the foundation for further
global identification of biomarkers and therapeutic targets in
HNSCC and other cancers with phenotypic and genetic heter-
ogeneity related to p53 status or other abnormalities.
Materials and methods
Cell lines
Ten established HNSCC cell lines, UM-SCC 1, 5, 6, 9, 11A, 11B,
22A, 22B, 38 and 46, were obtained from the University of
Michigan series of HNSCC (UM-SCC, Ann Arbor, MI, USA),
as described previously [40]. The ten UM-SCC cell lines were
obtained from eight HNSCC patients, representing aggressive
malignancies derived from different anatomic sites. Many
molecular alterations of these cell lines were confirmed in
HNSCC tumors, including over-expression and activation of
EGFR, IL1 and IL6 signal transduction pathways, mutation
and altered activation of TFs p53, NF-
κ
B, AP-1, STAT3 and
EGR1, over-expression of proinflammatory and proang-
iogenic cytokines and genes, and resistance to radiation and
chemotherapies [6-9,14,15,18,37,43,44,49]. Human normal
keratinocytes were obtained from four individuals (Cascade
Biologics Inc., Portland, OR, USA), and cultured following the
manufacturer's protocol. p53 mutation and expression status
of UM-SCC cell lines were carried out with bidirectional
genomic sequencing of exons 4-9, and confirmed with west-
ern blotting and immunohistochemistry [14]. Mutation of
p53 was detected in six cell lines, UM-SCC 5, 11B, 22A, 22B,
38 and 46. Four cell lines, UM-SCC 1, 6, 9 and 11A, retained a
wild-type p53 genotype [14].
Microarray experiments and data analysis
The cDNA microarray chips containing 24K human elements
were from NHGRI/NIH (Bethesda, MD, USA). The experi-
mental procedures and data are available at Gene Expression
Omnibus [82] (Series accession number GSE10774 Microar-
ray experimental design, data collection and analyses were as
described previously [83]. The subgroups of UM-SCC cells
were identified according to microarray data analysis using
principle components analysis and hierarchical clustering
analysis. Subgroup 1 included five UM-SCC lines with mutant
p53 status, and subgroup 2 was defined as wild-type p53-like
status and included four UM-SCC lines with wild-type p53
sequence but deficient expression, plus 11B cells, which
express a transcriptionally deficient mutant p53 and the same
gene signature [14,38]. Thus, in this study, the definition
'wild-type p53-like status' is changed to 'wild-type p53-defi-
cient' based on data showing that p53 expression and func-
tion is deficient in this group of cells in the absence of
mutations found in promoter and coding sequences [38]. We
identified differentially expressed genes among human nor-
mal keratinocytes and UM-SCC subgroups that satisfied the
following criteria: two-fold and above change of average gene
expression in the ten UM-SCC cell lines or in either subgroup
with different p53 statuses when compared with the average
gene expression of human normal keratinocytes. These crite-
ria resulted in 1,265 genes for the following analyses (Figure
1).
Extraction of promoter sequences and TF matrices
The promoter sequences of the 1,265 differentially expressed
genes were extracted using DBTSS [84] and Genomatix suite
3.4.1 [85]. The proximal promoter of each gene was set to
1,000 bp upstream and 300 bp downstream of the transcrip-
tional start site. PWMs for NF-
κ
B binding sites were derived
from Transfac 8.4 [86]. PWMs for five NF-
κ
B binding sites
were used, including: RELA/p65 (NFKAPPAPP65), NF
κ
B1/
p50 (NFKAPPABP50), cREL, NF
κ
B_Q6 and NF
κ
B_Q6_01.
COGRIM modeling
We applied COGRIM [47] to identify NF-
κ
B gene regulons by
integrating the data sources from differentially expressed
gene profiles, the related promoter sequences, NF-
κ
B binding
activities in UM-SCC cell lines, and PWMs for NF-
κ
B binding
sites (Figure 1). Briefly, COGRIM is a Bayesian hierarchical
model with a Markov chain Monte Carlo implementation that
is able to integrate heterogeneous biological data and avoid
an ad hoc, stage-wise analysis by simultaneously modeling
gene clustering and the strength of the contribution from
each of the data sources [47].
The central goal of the COGRIM procedure is to infer the cor-
rect set of gene-TF associations, which are mathematically
formulated as indicator variables C
ij
. The variable C
ij
= 1 if
gene i is regulated by TF j, and C
ij
= 0 if there is no regulation
of gene i by TF j. The first level of COGRIM incorporated our
gene expression data into the inference for each C
ij
by specify-
ing the observed gene expression g
it
as a linear function of TF
activity, f
jt
.
Note that only TFs with connections to gene i (that is, C
ij
= 1)
are allowed to influence the expression of gene i in the equa-
tion above. This also means that
α
i
can be interpreted as the
baseline expression for gene i in the absence of regulation by
known TFs (that is, C
ij
= 0 for all TFs j), whereas
β
j
can be con-
sidered as the linear effect of TF j on target gene expression.
As mentioned above, we have one additional class of data for
inferring a particular gene-TF association C
ij
: promoter ele-
ment data m
ij
. The probability of a binding site for TF j in the
upstream region of gene i, m
ij
, is calculated using TESS [87].
We use m
ij
as the prior probability for the variable C
ij
as
described previously [47]. Note that we have a choice between
two proxies for the TF activity f
jt
: the expression of the gene
gCfNormal
it i j ij jt it
j
J
it
=+ +
=
∑
αβ εε δ
1
2
0~(,)
Genome Biology 2008, 9:R53
Genome Biology 2008, Volume 9, Issue 3, Article R53 Yan et al. R53.18
that encodes TF j or the experiment results from NF-
κ
B DNA
binding assays (as described in the NF-
κ
B DNA binding assay
section). In our analysis, we compare the results based on
these two different proxies for TF activity.
COGRIM identifies putative NF-
κ
B gene targets (regulons)
that represent a set of genes (748; Figure 1) regulated by the
five NF-
κ
B PWMs described previously by Transfac 8.4. The
probability cutoff scores (0.8) were proposed to infer putative
NF-
κ
B gene targets based on the comparisons to background
models. These genes included 11 known NF-
κ
B target genes
with slightly lower scores than the cutoff. The known NF-
κ
B
target genes were defined by PubMed publications and avail-
able NF-
κ
B websites [88-90].
Gene Ontology annotation
Gene Ontology annotation was performed using Onto-
Express software [91]. A hypergeometric distribution was
used to calculate the significance values in the probability
model. Corrected P < 0.05 was used as the cutoff value in this
study.
Analysis of networks and pathways
The putative NF-
κ
B regulated genes identified from COGRIM
were imported into IPA 5.0 (Ingenuity Systems Inc, Moun-
tain View, CA, USA) according to the Ingenuity Pathways
Knowledge Base (IPKB), where each interaction in IPKB is
supported by the underlying publications and structured
functional annotation [92]. Statistical scores were then
assigned to rank the resulting networks and pathways using
Fisher's right tailed exact test, where the significant networks
(P < 0.001) and pathways (P < 0.05) were selected. IPA allows
comparison of gene networks and pathways generated by dif-
ferent sets of input genes, or under the regulation of different
TFs. In this study, we input predicted RELA or NF
κ
B1 target
gene sets from Figure 2b into IPA, and used RELA or NF
κ
B1
as override genes to identify RELA or NF
κ
B1 directly interact-
ing genes and networks.
TNF-
α
-induced gene expression in UM-SCC cells
TNF-
α
-induced gene expression was studied in cultured UM-
SCC 6 cells treated with or without TNF (2,000 units/ml;
Knoll Pharmaceutical Company, Whippany, NJ, USA). Total
RNAs were isolated using a Trizol reagent (Invitrogen,
Carlsbad, CA, USA) and RNeasy Mini Kit (QIAGEN, Valencia,
CA, USA) combined method at indicated time points. cDNA
synthesis was performed by using a High-Capacity cDNA
Archive Kit (Applied Biosystems, Foster City, CA, USA). PCR
was performed together with endogenous eukaryotic 18S
ribosomal RNA (18S) as the control using Assays-on-
Demand™ Gene Expression Assay (Applied Biosystems), as
previously described [14,35]. Relative quantification of the
expression was calculated by normalizing the target gene sig-
nals with the 18S endogenous control. An arbitrary unit was
calculated after setting C
T
to 40 as undetectable expression
and used for normalization.
Knocking down NF-
κ
B RELA and NF
κ
B1 by siRNA
The knockdown of RELA and NF
κ
B1 mRNA was performed
by using siRNA (ON-TARGETplus SMARTpool; Dharmacon,
Lafayette, CO, USA). UM-SCC 6 cells were seeded in 6-well
plates at 1 × 10
5
/well. At 50-60% confluency (24 h later), cells
were transfected with 50 nM of a mixture of four siRNA oligos
directed against human RELA or NF
κ
B1 designed by Dhar-
macon, or 50 nM of a non-silencing control siRNA (QIA-
GEN), using 1:200 Lipofectamine 2000 (Invitrogen) in Opti-
MEM I Reduced Serum Medium (Invitrogen) for 5 h. At 24 h
and 48 h post-transfection, cells were harvested in Trizol for
RNA isolation (Invitrogen).
NF-
κ
B DNA binding assays
Cultured UM-SCC cells were treated with TNF-
α
for 30 min-
utes. Nuclear fractions were harvested from cells using the
nuclear extraction kit following the manufacturer's sugges-
tions (Active Motif, Carlsbad, CA, USA). The protein concen-
tration was determined using the BCA method (Pierce,
Rockford, IL, USA). NF-
κ
B DNA binding activity was quanti-
tatively assessed using the TransAM NF-
κ
B family TF assay
kit (Active Motif) per the manufacturer's protocol. To each
well containing a NF-
κ
B consensus binding site (5'-
GGGACTTTCC-3'), 10
μ
g of nuclear extract in cell binding
and cell lysis buffer were added in each well in triplicates. We
used 5
μ
g of nuclear extract of Raji cells (a Burkitt's
lymphoma cell line) as the positive control (Active Motif). To
assess DNA binding specificity, excess wild-type NF-
κ
B con-
sensus oligonucleotide was added (20 pmol/well) to compete
for the binding, as compared with other wells to which was
added an inactive mutated consensus oligonucleotide. Plates
were washed using the ELx50 strip washer (Bio-Tek,
Winooski, VT, USA), and the absorbance was measured at
450 nm by
μ
Quant ELISA microplate reader (Bio-Tek).
To dissect the specific binding activity of each NF-
κ
B subunit
for their cognate promoter sequences as predicted above, we
performed NF-
κ
B binding assays using promoter-specific
DNA oligonucleotides in TransAM flexi NF-
κ
B family kit
(Active Motif). The 50 bp oligonucleotides contains a 10 bp
core consensus sequence of a RELA binding motif of the IL8
promoter generated by Active Motif as the positive control
(5'-biotin-GGGCCATTTACCGTAAGTTATGTAACGCGCCT-
GGGAAATTCCA
CTCAACT-3'; the underlined sequence is the
NF-
κ
B binding consensus). We also generated 50 bp oligonu-
cleotides based on the predicted RELA binding motif flanked
with the natural sequences of promoters of: IL8, 5'-biotin-
CCCTGAGGGGATGGGCCATCAGTTGCAAATCGTGGAATT-
TCCTCTGACAT-3' for the RELA binding site; CDKN1A, 5'-
biotin-ACTGAGCCTTCCTCACATCCTCCTTCTTCAGGCTT-
GGGCTTTCCACCTTT-3' for the RELA binding site, 5'-biotin-
AGGTGAATTCCTCTGAAAGCTGACTGCCCCTATTT-
GGGACTCCCC
AGTCT-3 for the NF
κ
B1 binding site; ITGA5,
3'-biotin-CTCCGCCCACCAGAGGTGATTCCTTTCCTCATT-
AGGAAATTCTC
CGCTCC-5' for the RELA binding site, 3'-
biotin-AGAACCCAGGCACCCGGCGGCCCCGGAAGGCAAG-
Genome Biology 2008, Volume 9, Issue 3, Article R53 Yan et al. R53.19
Genome Biology 2008, 9:R53
GGGGAATCCCAGTTGG-5' for the NF
κ
B1 binding site;
LAMB3, 3'-biotin-ACTTGTGGTCAGGTCTGTTTTCT-
GGCCCTCCAGG CGGGCATTCC
TGCCTA-5' for the RELA
binding site, 3'-biotin-GGTGAGGCTGTTGTTTAAAAACCT-
GGAGCCGGGAGGGGAGACCC
CCACAT-5' for the NF
κ
B1;
IGFBP3, 3'-biotin-GGCAAGCGTCCAATTTCAACAGCGT-
TCAGGAAAGTCTCCT
CCCGCGGAGG-5' for the NFkB_Q6 (a
NF-
κ
B PWM of Transfac 8.4) binding motif. The oligonucle-
otides were about 50 bp in length, each with gene specific pro-
moter sequences, and were custom synthesized and
biotinylated at the far end from the NF-
κ
B consensus sites by
the Midland Certified Reagent Company (Midland, TX, USA).
Ten micrograms of nuclear extract, 50
μ
l binding buffer, and
1 pmol of biotinylated oligonucleotide were incubated for 30
minutes at room temperature prior to placement in a well on
strepavidin-coated 96-microtiter plates. The binding
experiments were performed following the protocol provided
by TransAM NF-
κ
B family TF assay kit as described.
Abbreviations
AKT, v-akt murine thymoma viral oncogene homolog 1; AP1,
activating protein-1; ChIP, chromatin immunoprecipitation;
COGRIM, Clustering Of Gene Regulons using Integrated
Modeling; EGFR, epidermal growth factor receptor; EGR1,
early growth response-1; ETS, v-ets erythroblastosis virus
E26 oncogene homolog (avian); GM-CSF, granulocyte-mac-
rophage colony-stimulating-factor; HNSCC, head and neck
squamous cell carcinoma; IGF, insulin-like growth factor;
I
κ
B, inhibitor kappaB; IKK, inhibitor-kappaB kinase; IL,
interleukin; IL-R, interleukin receptor; IPA, Ingenuity Path-
way Analysis; IPKB, Ingenuity Pathways Knowledge Base;
MAPK, mitogen-activated protein kinase; NF-
κ
B, nuclear
factor kappaB; PI3K, phosphatidylinositol 3-kinase; PPAR,
peroxisome proliferator-activated receptor; PTEN,
phosphatase and tensin homolog; PWM, position weighted
matrix; siRNA, small interfering RNA; STAT, signal trans-
ducer and transcription factor; STAT3, signal transducer and
transcription factor 3; TF, transcription factor; TGF, trans-
forming growth factor; TNF, tumor necrosis factor; UM-SCC,
University of Michigan Cell Lines Series of Head and Neck
Squamous Cell Carcinoma; VEGF, vascular endothelial
growth factor.
Authors' contributions
BY, GC and ZC conceived and designed the bioninformatic
and analytic strategies and experiments. GC, STJ and CJS
originally developed the COGRIM model. BY prepared mic-
orarray and related promoter data for caculation through
COGRIM modeling. GC performed mathematical caculation
through COGRIM modeling. BY performed data analysis
after mathematical caculation using IPA and other bioinfor-
matic tools. BY, KS, XY and ZC contributed to the experimen-
tal designs. BY, KS and XY wrote experimental protocols, and
performed experiments and data analyses. BY prepared the
final figures and tables. ZC, BY, CVW, GC, STJ and CJS con-
tributed to the writing and discussion of the paper.
Additional data files
The following additional data are available with the online
version for this paper. Additional data file 1 lists NF-
κ
B target
genes differentially expressed in UM-SCC cell lines. Addi-
tional data file 2 lists Gene Ontology annotations for NF-
κ
B
target genes in wild-type p53-deficient, mutant p53 and wild-
type plus mutant p53 subsets of UM-SCC cells. Additional
data file 3 shows network lists generated by IPA based on
gene sets regulated by NF-
κ
B subunits RELA/p65 and
NF
κ
B1/p50.
Additional data file 1NF-
κ
B target genes differentially expressed in UM-SCC cell linesNF-
κ
B target genes differentially expressed in UM-SCC cell lines.Click here for fileAdditional data file 2Gene Ontology annotations for NF-
κ
B target genes in wild-type p53-deficient, mutant p53 and wild-type plus mutant p53 subsets of UM-SCC cellsGene Ontology annotations for NF-
κ
B target genes in wild-type p53-deficient, mutant p53 and wild-type plus mutant p53 subsets of UM-SCC cells.Click here for fileAdditional data file 3Network lists generated by IPA based on gene sets regulated by NF-
κ
B subunits RELA/p65 and NF
κ
B1/p50Network lists generated by IPA based on gene sets regulated by NF-
κ
B subunits RELA/p65 and NF
κ
B1/p50.Click here for file
Acknowledgements
This work is supported by NIDCD Intramural project Z01-DC-00016. We
should like to express our appreciation to Drs Paul Meltzer and Bilke Sven
for their critical reading and helpful comments (NCI/NIH).
References
1. Hoffmann A, Baltimore D: Circuitry of nuclear factor kappaB
signaling. Immunological reviews 2006, 210:171-186.
2. Hayden MS, Ghosh S: Signaling to NF-kappaB. Genes Dev 2004,
18(18):2195-2224.
3. Karin M: NF-kappaB and cancer: mechanisms and targets.
Mol Carcinog 2006, 45(6):355-361.
4. Van Waes C: Nuclear factor-kappaB in development, preven-
tion, and therapy of cancer. Clin Cancer Res 2007,
13(4):1076-1082.
5. Karin M: Nuclear factor-kappaB in cancer development and
progression. Nature 2006, 441(7092):431-436.
6. Ondrey FG, Dong G, Sunwoo J, Chen Z, Wolf JS, Crowl-Bancroft CV,
Mukaida N, Van Waes C: Constitutive activation of transcrip-
tion factors NF-(kappa)B, AP-1, and NF-IL6 in human head
and neck squamous cell carcinoma cell lines that express
pro-inflammatory and pro-angiogenic cytokines. Mol Carcinog
1999, 26(2):119-129.
7. Duffey DC, Chen Z, Dong G, Ondrey FG, Wolf JS, Brown K, Sieben-
list U, Van Waes C: Expression of a dominant-negative mutant
inhibitor-kappaBalpha of nuclear factor-kappaB in human
head and neck squamous cell carcinoma inhibits survival,
proinflammatory cytokine expression, and tumor growth in
vivo. Cancer Res 1999, 59(14):3468-3474.
8. Duan J, Friedman J, Nottingham L, Chen Z, Ara G, Van Waes C:
Nuclear factor-kappaB p65 small interfering RNA or protea-
some inhibitor bortezomib sensitizes head and neck
squamous cell carcinomas to classic histone deacetylase
inhibitors and novel histone deacetylase inhibitor PXD101.
Mol Cancer Ther 2007, 6(1):37-50.
9. Wolf JS, Chen Z, Dong G, Sunwoo JB, Bancroft CC, Capo DE, Yeh
NT, Mukaida N, Van Waes C: IL (interleukin)-1alpha promotes
nuclear factor-kappaB and AP-1-induced IL-8 expression,
cell survival, and proliferation in head and neck squamous
cell carcinomas. Clin Cancer Res 2001, 7(6):1812-1820.
10. Bancroft CC, Chen Z, Yeh J, Sunwoo JB, Yeh NT, Jackson S, Jackson
C, Van Waes C: Effects of pharmacologic antagonists of epi-
dermal growth factor receptor, PI3K and MEK signal kinases
on NF-kappaB and AP-1 activation and IL-8 and VEGF
expression in human head and neck squamous cell carci-
noma lines. Int J Cancer 2002,
99(4):538-548.
11. Yu M, Yeh J, Van Waes C: Protein kinase casein kinase 2 medi-
ates inhibitor-kappaB kinase and aberrant nuclear factor-
kappaB activation by serum factor(s) in head and neck squa-
mous carcinoma cells. Cancer Res 2006, 66(13):6722-6731.
12. Dong G, Loukinova E, Chen Z, Gangi L, Chanturita TI, Liu ET, Van
Waes C: Molecular profiling of transformed and metastatic
murine squamous carcinoma cells by differential display and
Genome Biology 2008, 9:R53
Genome Biology 2008, Volume 9, Issue 3, Article R53 Yan et al. R53.20
cDNA microarray reveals altered expression of multiple
genes related to growth, apoptosis, angiogenesis, and the
NF-kappaB signal pathway. Cancer Res 2001, 61(12):4797-4808.
13. Loercher A, Lee TL, Ricker JL, Howard A, Geoghegen J, Chen Z, Sun-
woo JB, Sitcheran R, Chuang EY, Mitchell JB, et al.: Nuclear factor-
kappaB is an important modulator of the altered gene
expression profile and malignant phenotype in squamous
cell carcinoma. Cancer Res 2004, 64(18):6511-6523.
14. Yan B, Yang X, Lee TL, Friedman J, Tang J, Van Waes C, Chen Z:
Genome-wide identification of novel expression signatures
reveal distinct patterns and prevalence of binding motifs for
p53, nuclear factor-kappaB and other signal transcription
factors in head and neck squamous cell carcinoma. Genome
Biol 2007, 8(5):R78.
15. Bancroft CC, Chen Z, Dong G, Sunwoo JB, Yeh N, Park C, Van Waes
C: Coexpression of proangiogenic factors IL-8 and VEGF by
human head and neck squamous cell carcinoma involves
coactivation by MEK-MAPK and IKK-NF-kappaB signal
pathways. Clin Cancer Res 2001, 7(2):435-442.
16. Duffey DC, Crowl-Bancroft CV, Chen Z, Ondrey FG, Nejad-Sattari
M, Dong G, Van Waes C: Inhibition of transcription factor
nuclear factor-kappaB by a mutant inhibitor-kappaBalpha
attenuates resistance of human head and neck squamous
cell carcinoma to TNF-alpha caspase-mediated cell death. Br
J Cancer 2000, 83(10):1367-1374.
17. Kim HJ, Hawke N, Baldwin AS: NF-kappaB and IKK as therapeu-
tic targets in cancer. Cell Death Differ 2006, 13(5):738-747.
18. Van Waes C, Chang AA, Lebowitz PF, Druzgal CH, Chen Z, Elsayed
YA, Sunwoo JB, Rudy SF, Morris JC, Mitchell JB, et al.: Inhibition of
nuclear factor-kappaB and target genes during combined
therapy with proteasome inhibitor bortezomib and reirradi-
ation in patients with recurrent head-and-neck squamous
cell carcinoma. Int J Radiat Oncol Biol Phys 2005, 63(5):1400-1412.
19. Zhang PL, Pellitteri PK, Law A, Gilroy PA, Wood GC, Kennedy TL,
Blasick TM, Lun M, Schuerch C 3rd, Brown RE: Overexpression of
phosphorylated nuclear factor-kappa B in tonsillar squa-
mous cell carcinoma and high-grade dysplasia is associated
with poor prognosis. Mod Pathol 2005,
18(7):924-932.
20. Kondagunta GV, Drucker B, Schwartz L, Bacik J, Marion S, Russo P,
Mazumdar M, Motzer RJ: Phase II trial of bortezomib for
patients with advanced renal cell carcinoma. J Clin Oncol 2004,
22(18):3720-3725.
21. Fanucchi MP, Fossella FV, Belt R, Natale R, Fidias P, Carbone DP,
Govindan R, Raez LE, Robert F, Ribeiro M, et al.: Randomized
phase II study of bortezomib alone and bortezomib in com-
bination with docetaxel in previously treated advanced non-
small-cell lung cancer. J Clin Oncol 2006, 24(31):5025-5033.
22. Alberts SR, Foster NR, Morton RF, Kugler J, Schaefer P, Wiesenfeld
M, Fitch TR, Steen P, Kim GP, Gill S: PS-341 and gemcitabine in
patients with metastatic pancreatic adenocarcinoma: a
North Central Cancer Treatment Group (NCCTG) rand-
omized phase II study. Ann Oncol 2005, 16(10):1654-1661.
23. Mishra A, Bharti AC, Varghese P, Saluja D, Das BC: Differential
expression and activation of NF-kappaB family proteins dur-
ing oral carcinogenesis: Role of high risk human papillomavi-
rus infection. Int J Cancer 2006, 119(12):2840-2850.
24. Demicco EG, Kavanagh KT, Romieu-Mourez R, Wang X, Shin SR,
Landesman-Bollag E, Seldin DC, Sonenshein GE: RelB/p52 NF-kap-
paB complexes rescue an early delay in mammary gland
development in transgenic mice with targeted superrepres-
sor IkappaB-alpha expression and promote carcinogenesis of
the mammary gland. Mol Cell Biol 2005, 25(22):10136-10147.
25. Viatour P, Merville MP, Bours V, Chariot A: Phosphorylation of
NF-kappaB and IkappaB proteins: implications in cancer and
inflammation. Trends Biochem Sci 2005, 30(1):43-52.
26. Hacker H, Karin M: Regulation and function of IKK and IKK-
related kinases. Sci STKE 2006, 2006(357):re13.
27. Liu J, Lin A: Wiring the cell signaling circuitry by the NF-kappa
B and JNK1 crosstalk and its applications in human diseases.
Oncogene 2007, 26(22):3267-3278.
28. Leeman RJ, Lui VW, Grandis JR: STAT3 as a therapeutic target
in head and neck cancer. Expert opinion on biological therapy 2006,
6(3):231-241.
29. Rocha S, Garrett MD, Campbell KJ, Schumm K, Perkins ND: Regu-
lation of NF-kappaB and p53 through activation of ATR and
Chk1 by the ARF tumour suppressor. Embo J 2005,
24(6):1157-1169.
30. Huang WC, Ju TK, Hung MC, Chen CC: Phosphorylation of CBP
by IKKalpha promotes cell growth by switching the binding
preference of CBP from p53 to NF-kappaB. Mol Cell 2007,
26(1):75-87.
31. Lee TL, Yeh J, Van Waes C, Chen Z: Epigenetic modification of
SOCS-1 differentially regulates STAT3 activation in
response to interleukin-6 receptor and epidermal growth
factor receptor signaling through JAK and/or MEK in head
and neck squamous cell carcinomas. Mol Cancer Ther 2006,
5(1):8-19.
32. Pernas FG, Allen CT, Winters ME, Dabir B, Bagain L, Saigal K, Yan B,
Morris JC, Calvo KR, Van Waes C, et al.: Proteomic signatures of
epidermal growth factor receptor and survival signal path-
ways correspond to Gefitinib sensitivity in head and neck
cancer. In Proceedings of the AACR Edited by: Foti M. Philadelphia,
Pennsylvania: Amer. Assn. Cancer Res; 2008 in press.
33. Allen CT, Chang AA, Chen Z, Van Waes C: Inhibition of NF-
κ
B
with Proteasome Inhibitor Bortezomib during Re-Irradia-
tion in Patients with Recurrent Head and Neck Squamous
Cell Carcinoma. In NF-kappaB: 20 Years on the Road from Biochem-
istry to Pathology Silverthorne, Colorado: Keystone Symposia; 2006.
34. Allen CT, Ricker JL, Chen Z, Van Waes C: Role of activated
nuclear factor-kappaB in the pathogenesis and therapy of
squamous cell carcinoma of the head and neck. Head Neck
2007, 29(10):959-971.
35. Lee TL, Yang XP, Yan B, Friedman J, Duggal P, Bagain L, Dong G, Yeh
NT, Wang J, Zhou J, et al.: A Novel Nuclear Factor-{kappa}B
Gene Signature Is Differentially Expressed in Head and Neck
Squamous Cell Carcinomas in Association with TP53 Status.
Clin Cancer Res 2007, 13(19):5680-5691.
36. Lee TL, Yeh J, Friedman J, Yan B, Yang X, Yeh NT, Van Waes C, Chen
Z: A signal network involving coactivated NF-kappaB and
STAT3 and altered p53 modulates BAX/BCL-XL expression
and promotes cell survival of head and neck squamous cell
carcinomas. Int J Cancer 2008.
37. Worden B, Yang XP, Lee TL, Bagain L, Yeh NT, Cohen JG, Van Waes
C, Chen Z: Hepatocyte growth factor/scatter factor
differentially regulates expression of proangiogenic factors
through Egr-1 in head and neck squamous cell carcinoma.
Cancer Res 2005, 65(16):7071-7080.
38. Friedman J, Nottingham L, Duggal P, Pernas FG, Yan B, Yang XP, Chen
Z, Van Waes C: Deficient TP53 Expression, Function, and Cis-
platin Sensitivity Are Restored by Quinacrine in Head and
Neck Cancer. Clin Cancer Res 2007, 13(22):6568-6578.
39. Chen Z, Colon I, Ortiz N, Callister M, Dong G, Pegram MY, Arosa-
rena O, Strome S, Nicholson JC, Van Waes C: Effects of inter-
leukin-1alpha, interleukin-1 receptor antagonist, and
neutralizing antibody on proinflammatory cytokine expres-
sion by human squamous cell carcinoma lines. Cancer Res
1998, 58(16):3668-3676.
40. Chen Z, Malhotra PS, Thomas GR, Ondrey FG, Duffey DC, Smith
CW, Enamorado I, Yeh NT, Kroog GS, Rudy S, et al.: Expression of
proinflammatory and proangiogenic cytokines in patients
with head and neck cancer. Clin Cancer Res 1999,
5(6):1369-1379.
41. Dong G, Chen Z, Li ZY, Yeh NT, Bancroft CC, Van Waes C: Hepa-
tocyte growth factor/scatter factor-induced activation of
MEK and PI3K signal pathways contributes to expression of
proangiogenic cytokines interleukin-8 and vascular endothe-
lial growth factor in head and neck squamous cell carcinoma.
Cancer Res 2001, 61(15):5911-5918.
42. Druzgal CH, Chen Z, Yeh NT, Thomas GR, Ondrey FG, Duffey DC,
Vilela RJ, Ende K, McCullagh L, Rudy SF, et al.: A pilot study of lon-
gitudinal serum cytokine and angiogenesis factor levels as
markers of therapeutic response and survival in patients
with head and neck squamous cell carcinoma. Head Neck
2005, 27(9):771-784.
43. Chung CH, Parker JS, Ely K, Carter J, Yi Y, Murphy BA, Ang KK, El-
Naggar AK, Zanation AM, Cmelak AJ, et al.: Gene Expression Pro-
files Identify Epithelial-to-Mesenchymal Transition and Acti-
vation of Nuclear Factor-{kappa}B Signaling as
Characteristics of a High-risk Head and Neck Squamous Cell
Carcinoma. Cancer Res 2006, 66(16):8210-8218.
44. Roepman P, Kemmeren P, Wessels LF, Slootweg PJ, Holstege FC:
Multiple robust signatures for detecting lymph node metas-
tasis in head and neck cancer. Cancer Res 2006,
66(4):2361-2366.
45. Zhu X, Gerstein M, Snyder M: Getting connected: analysis and
principles of biological networks. Genes Dev 2007,
Genome Biology 2008, Volume 9, Issue 3, Article R53 Yan et al. R53.21
Genome Biology 2008, 9:R53
21(9):1010-1024.
46. Wang E, Lenferink A, O'Connor-McCourt M: Cancer systems biol-
ogy: exploring cancer-associated genes on cellular networks.
Cell Mol Life Sci 2007.
47. Chen G, Jensen ST, Stoeckert CJ Jr: Clustering of genes into
regulons using integrated modeling-COGRIM. Genome Biol
2007, 8(1):R4.
48. Jensen ST, Chen G, Stoeckert CJ Jr: Bayesian Variable Selection
and Data Integration for Biological Regulatory Networks.
Annals of Applied Statistics 2007(1):612-633.
49. Akervall J, Guo X, Qian CN, Schoumans J, Leeser B, Kort E, Cole A,
Resau J, Bradford C, Carey T, et al.: Genetic and expression pro-
files of squamous cell carcinoma of the head and neck corre-
late with cisplatin sensitivity and resistance in cell lines and
patients. Clin Cancer Res 2004, 10(24):8204-8213.
50. Engels EA, Wu X, Gu J, Dong Q, Liu J, Spitz MR: Systematic Eval-
uation of Genetic Variants in the Inflammation Pathway and
Risk of Lung Cancer. Cancer Res 2007.
51. Balasubramanian SP, Azmy IA, Higham SE, Wilson AG, Cross SS, Cox
A, Brown NJ, Reed MW: Interleukin gene polymorphisms and
breast cancer: a case control study and systematic literature
review. BMC cancer 2006, 6:188.
52. Ninck S, Reisser C, Dyckhoff G, Helmke B, Bauer H, Herold-Mende
C: Expression profiles of angiogenic growth factors in squa-
mous cell carcinomas of the head and neck. Int J Cancer 2003,
106(1):34-44.
53. Sun Q, Chen G, Streb JW, Long X, Yang Y, Stoeckert CJ Jr, Miano JM:
Defining the mammalian CArGome. Genome Res 2006,
16(2):197-207.
54. Bussemaker HJ, Li H, Siggia ED: Regulatory element detection
using correlation with expression. Nature genetics 2001,
27(2):167-171.
55. Gao F, Foat BC, Bussemaker HJ: Defining transcriptional net-
works through integrative modeling of mRNA expression
and transcription factor binding data.
BMC bioinformatics 2004,
5:31.
56. Liao JC, Boscolo R, Yang YL, Tran LM, Sabatti C, Roychowdhury VP:
Network component analysis: reconstruction of regulatory
signals in biological systems. Proc Natl Acad Sci USA 2003,
100(26):15522-15527.
57. Siebelt F, Berberich I, Shu G, Serfling E, Clark EA: Role for CD40-
mediated activation of c-Rel and maintenance of c-myc RNA
levels in mitigating anti-IgM-induced growth arrest. Cellular
immunology 1997, 181(1):13-22.
58. Martone R, Euskirchen G, Bertone P, Hartman S, Royce TE, Lus-
combe NM, Rinn JL, Nelson FK, Miller P, Gerstein M, et al.: Distribu-
tion of NF-kappaB-binding sites across human chromosome
22. Proc Natl Acad Sci USA 2003, 100(21):12247-12252.
59. Tian B, Nowak DE, Brasier AR: A TNF-induced gene expression
program under oscillatory NF-kappaB control. BMC genomics
2005, 6:137.
60. Tian B, Nowak DE, Jamaluddin M, Wang S, Brasier AR: Identifica-
tion of direct genomic targets downstream of the nuclear
factor-kappaB transcription factor mediating tumor necro-
sis factor signaling. J Biol Chem 2005, 280(17):17435-17448.
61. Schreiber J, Jenner RG, Murray HL, Gerber GK, Gifford DK, Young
RA: Coordinated binding of NF-kappaB family members in
the response of human cells to lipopolysaccharide. Proc Natl
Acad Sci USA 2006, 103(15):5899-5904.
62. Sharif O, Bolshakov VN, Raines S, Newham P, Perkins ND: Tran-
scriptional profiling of the LPS induced NF-kappaB response
in macrophages. BMC immunology 2007, 8:1.
63. Carayol N, Chen J, Yang F, Jin T, Jin L, States D, Wang CY: A
dominant function of IKK/NF-kappaB signaling in global
lipopolysaccharide-induced gene expression. J Biol Chem 2006,
281(41):31142-31151.
64. Hoffmann A, Levchenko A, Scott ML, Baltimore D: The IkappaB-
NF-kappaB signaling module: temporal control and selective
gene activation. Science 2002, 298(5596):1241-1245.
65. Barkett M, Gilmore TD: Control of apoptosis by Rel/NF-kappaB
transcription factors. Oncogene 1999, 18(49):6910-6924.
66. Barbieri CE, Perez CA, Johnson KN, Ely KA, Billheimer D, Pietenpol
JA: IGFBP-3 is a direct target of transcriptional regulation by
DeltaNp63alpha in squamous epithelium. Cancer Res 2005,
65(6):2314-2320.
67. Kelly D, Campbell JI, King TP, Grant G, Jansson EA, Coutts AG, Pet-
tersson S, Conway S: Commensal anaerobic gut bacteria atten-
uate inflammation by regulating nuclear-cytoplasmic
shuttling of PPAR-gamma and RelA. Nature immunology 2004,
5(1):104-112.
68. Drane P, Barel M, Balbo M, Frade R: Identification of RB18A, a
205 kDa new p53 regulatory protein which shares antigenic
and functional properties with p53. Oncogene 1997,
15(25):3013-3024.
69. Frade R, Balbo M, Barel M: RB18A, whose gene is localized on
chromosome 17q12-q21.1, regulates in vivo p53 transacti-
vating activity. Cancer Res 2000, 60(23):6585-6589.
70. Monaco C, Paleolog E: Nuclear factor kappaB: a potential ther-
apeutic target in atherosclerosis and thrombosis. Cardiovascu-
lar research 2004, 61(4):671-682.
71. Xie W, Tian Y: Xenobiotic receptor meets NF-kappaB, a col-
lision in the small bowel. Cell metabolism 2006, 4(3):177-178.
72. Piccolo E, Vignati S, Maffucci T, Innominato PF, Riley AM, Potter BV,
Pandolfi PP, Broggini M, Iacobelli S, Innocenti P, et al.: Inositol pen-
takisphosphate promotes apoptosis through the PI 3-K/Akt
pathway. Oncogene 2004, 23(9):1754-1765.
73. Cataisson C, Joseloff E, Murillas R, Wang A, Atwell C, Torgerson S,
Gerdes M, Subleski J, Gao JL, Murphy PM, et al.: Activation of cuta-
neous protein kinase C alpha induces keratinocyte apoptosis
and intraepidermal inflammation by independent signaling
pathways. J Immunol 2003, 171(5):2703-2713.
74. Suh KS, Tatunchak TT, Crutchley JM, Edwards LE, Marin KG, Yuspa
SH: Genomic structure and promoter analysis of PKC-delta.
Genomics 2003, 82(1):57-67.
75. Hou P, Liu D, Shan Y, Hu S, Studeman K, Condouris S, Wang Y, Trink
A, El-Naggar AK, Tallini G, et al.: Genetic alterations and their
relationship in the phosphatidylinositol 3-kinase/Akt path-
way in thyroid cancer. Clin Cancer Res 2007, 13(4):1161-1170.
76. Blanpain C, Horsley V, Fuchs E: Epithelial stem cells: turning
over new leaves. Cell 2007, 128(3):445-458.
77. Lu SL, Herrington H, Reh D, Weber S, Bornstein S, Wang D, Li AG,
Tang CF, Siddiqui Y, Nord J, et al.: Loss of transforming growth
factor-beta type II receptor promotes metastatic head-and-
neck squamous cell carcinoma. Genes Dev 2006,
20(10):1331-1342.
78. Bradford CR, Zhu S, Ogawa H, Ogawa T, Ubell M, Narayan A, John-
son G, Wolf GT, Fisher SG, Carey TE: P53 mutation correlates
with cisplatin sensitivity in head and neck squamous cell car-
cinoma lines. Head Neck 2003, 25(8):654-661.
79. Ongkeko WM, Altuna X, Weisman RA, Wang-Rodriguez J: Expres-
sion of protein tyrosine kinases in head and neck squamous
cell carcinomas. American journal of clinical pathology 2005,
124(1):71-76.
80. Allen C, Duffy S, Teknos T, Islam M, Chen Z, Albert PS, Wolf G, Van
Waes C: Nuclear factor-kappaB-related serum factors as lon-
gitudinal biomarkers of response and survival in advanced
oropharyngeal carcinoma. Clin Cancer Res 2007,
13(11):3182-3190.
81. Duggal P, Allen CT, Chen Z, Van Waes C: Differential Expression
of p53 & NF-
κ
B in Head & Neck Cancer. In Proceedings of the
AACR Edited by: Foti M. Philadelphia, Pennsylvania: Amer. Assn. Can-
cer Res; 2006.
82. Gene Expression Omnibus. [ />83. Chen Z, Lee TL, Yang XP, Dong G, Loercher A, Van Waes C: cDNA
Microarray and Bioinformatic Analysis of Nuclear Factor-
kappaB Related Genes in Squamous Cell Carcinoma. In Can-
cer Genomics and Proteomics: Methods and Protocols Volume 383. Edited
by: Fisher PD. Totowa, New Jersey: Humana press; 2007.
84. Promoter database. []
85. Genomatix Software GmbH. []
86. Transfac. [ />87. Schug J, Overton GC: TESS: Transcription Element Search
Software on the WWW. In Technical Report CBIL-TR-1997-1001-
v00 Philadelphia, PA: Computational Biology and Informatics Labora-
tory, School of Medicine, University of Pennsylvania; 1997:1-10.
88. Rel/NF-kappaB target genes. [ />89. Rel/NF-
κ
B Transcription factors. [ />nf-kb/target/index.html]
90. Transcriptional Regulatory Element Database. [http://
rulai.cshl.edu/cgi-bin/TRED/tred.cgi?process=home]
91. Draghici S, Khatri P, Martins RP, Ostermeier GC, Krawetz SA: Glo-
bal functional profiling of gene expression. Genomics 2003,
81(2):98-104.
92. Calvano SE, Xiao W, Richards DR, Felciano RM, Baker HV, Cho RJ,
Chen RO, Brownstein BH, Cobb JP, Tschoeke SK, et al.: A network-
Genome Biology 2008, 9:R53
Genome Biology 2008, Volume 9, Issue 3, Article R53 Yan et al. R53.22
based analysis of systemic inflammation in humans. Nature
2005, 437(7061):1032-1037.