Báo cáo y học: " Variability and seasonality of active transportation in USA: evidence from the 2001 NHTS" ppsx
Bạn đang xem bản rút gọn của tài liệu. Xem và tải ngay bản đầy đủ của tài liệu tại đây (274.81 KB, 9 trang )
RESEARCH Open Access
Variability and seasonality of active transportation
in USA: evidence from the 2001 NHTS
Yong Yang
1*
, Ana V Diez Roux
1
and C Raymond Bingham
2
Abstract
Background: Active transportation including walking and bicycling is an important source of physical activity.
Promoting active transportation is a challenge for the fields of public health and transportation. Descriptive data on
the predictors of active transportation, including seasonal patterns in active transportation in the US as a whole, is
needed to inform interventions and policies.
Methods: This study analyzed monthly variation in active transportation for the US using National Household
Travel Survey 2001 data. For each age group of children, adolescents, adults and elderly, logistic regression models
were used to identify predictors of the odds of active transportation in cluding gender, race/ethnicity, household
income level, geographical region, urbanization level, and month.
Results: The probability of engaging in active transportation was generally higher for children and adolescents
than for adults and the elderly. Active transportation was greater in the lower income groups (except in the
elderly), was lower in the South than in other regions of the US, and was greater in areas with higher urbanization.
The percentage of people using active transportation exhibited clear seasonal patterns: high during summer
months and low during winter months. Children and adolescents were more sensitive to seasonality than other
age groups. Women, non-Caucasians, persons with lower household income, who resided in the Midwest or
Northeast, and who lived in more urbanized areas had greater seasonal variation.
Conclusions: These descriptive results suggest that interventions and policies that target the promotion of active
transportation need to consider socio-demographic factors and seasonality.
Keywords: Active transportation, seasonality, NHTS
Introduction
Regular physical activity is important for the health and
well being of people of all ages [1]. It reduces the risk of
chronic diseases and enhances mental health [2]. Active
transportation including walking and bicycling is not
only an important source of physical activity, but also has
positive effects on climate change and air pollution [3].
Unfortunately, walking and bicycling for transportation
have declined over the past few decades in the US [4].
Thi s trend has been observed in all age groups includ ing
children and adolescents, adults and the elderly [5,6].
Promoting active transportation is a challenge for the
fields of public health and transportation [7].
Environmen tal effects on act ive transportati on have
received increasing attention because of their relevance
for policy [8-12]. Most research has focused on the built
environment such as land use mix, land use density,
street connectivity, and access to transportation, while
the effects of seasonality and weather conditions, have
been relatively neglected [13]. Humans’ physical activity
including active transportation, are undoubtedly influ-
enced by seasonality [14]. People have evolved different
physical activi ty patterns to cope w ith geographically
varying seasona l climate changes [15 ]. In the short-term,
changes in weather conditions such as the amount of
daylight, temperature and precipitation, can impede or
promote both the desire for and the feasibility of active
transportation [16].
Generally, le vels of physical activity are higher in
spring and s ummer and lower in winte r [13,15-19].
* Correspondence:
1
Department of Epidemiology, Center for Social Epidemiology and
Population Health, University of Michigan, Ann Arbor, Michigan, USA
Full list of author information is available at the end of the article
Yang et al. International Journal of Behavioral Nutrition and Physical Activity 2011, 8:96
/>© 2011 Yang et al; licensee BioMed Central Ltd. This is an Open Access article distributed under the terms of the Creative Commons
Attribution License ( w hich permi ts unrestricted use, distribution, and reproduction in
any medium, provided the original work i s properly cited.
However this seasonal variation can be modified by geo-
graphic region as well as by demographic, cultural and
social factors. For example, in contrast to the northern
states, in southern states of the US where the summer
months are hot and humid, children have lower physical
activity in s ummer than in winter [20]. The impact of
season may also be modified by economic and cultural
factors: in developing countries opportunities for hunt-
ing and crop cultivation determine seasonal activity
while temperature and rainfall are key determinants in
developed countries [21]. Seasonal differences in physi-
cal activity may also vary by age and gender, for exam-
ple, in Norway children were found to be more sensitive
to seasonality than adolescents [22] while in the Neth er-
lands seasonal variation was greater in males than in
females [23].
Although the impact of seasonal variations on physical
activity has been systematically reviewed [13,24], most stu-
dies included in these reviews were conducted in relatively
small regions with little climate variation. Only a small
number of studies co vered the whole US [19,2 5-29], and
differences in patterns across population subgroups were
infrequently investigated [18]. Studies which cover a range
of climate regions and which investigate variations across
socio-demographic groups are needed to assist in the
design of more effective physical activity promotion
policies.
This study used 2001 data from a large national sample
to describe monthly variation in active transportation in
the US by selected demographic and regional factors
including age, gender, race/ethnicity, household income
level, geographical region and urbanization level. In addi-
tion to overall patterns, we examined seasonal variations
as well as the extent to which seasonal variations differed
by demographic, and regional characteristics that could
be useful in planning intervention.
Methods
The National Household Travel Survey (NHTS) 2001
is a survey of personal transporta-
tion in the US. The NHTS 2001 updated information
gathered in prior Nationwide Personal Transportation
Surveys (NPTS) conducted in 1969, 1977, 1983, 1990,
and 1995. This survey was conducted by computer-
aided telephone interviews from March 2001 through
July 2002. The target population was the US civilian
population from infancy through 88 years of age. List-
assisted random-digit dialing was used to sample house-
holds. The sampling frame consisted of all telephone
numbers in 100-banks of numbers in which there was at
least one list ed residential number. Telephone numbers
were sorted according to geographic and population
variables and a systematic sample wa s then selected
from the sorted list. For the national sample, all
telephone numbers in the frame of 100-banks had an
equal probability of selection. The national sample was
increased in several add-on areas: New York State, Wis-
consin, Texas, Kentucky, Hawaii, Lancaster Pen nsylva-
nia, Baltimore Maryland, Des M oines, Ohio and Oahu
Hawaii. An adult proxy was required for indivi duals less
than 14 years old, and 14- and 15-year-olds responded
for themselves if their parent approved. The survey
included 160,758 people (with written informed con-
sents) in 69,817 households and collected information
on 642,292 daily trips including the purpose, transporta-
tion mode, travel time, and time of the day. For this
study, data were weighted by personal weights (provided
by NHTS) to adjust for the selection probabilities at the
individual level.
In this study, active transportation was defined to
include walking and bicycling. The population was
grouped by age into four groups: children (5-10 years old,
denoted by C), adolescents (11-17 years old, denoted by T
for teenagers), adults (18-64 years old, denoted by A) and
elderly (65 years and above, denoted by E). Respondents
were also classified based on gender, race/ethnicity, house-
hold income level, region, and urbanization level. Race/
ethnicity was classified as White, Black, Asian and Hispa-
nic. Household income level was categorized as (1) less
than 20,000 dollars per year; (2) 20,000-40,000; (3) 40,000-
80,000; and (4) more t han 80,000. The US was divided
into four sections based on US Census Region: West, Mid-
west, Northeast and South [30]. Level of urbanization was
classified as (1) rural; (2) town; (3) suburban; (4) second
city, and (5) urban based on population density [31]. Of
the 160,758 NHTS respondents, 30,536 were excluded
because they were of race/ethnic groups too small for reli-
able analysis (races/ethnicities other t han the four men-
tioned above) or because they were missing data on key
variables (12,329 for household income level, 12,142 for
age, 9,384 race/ethnicity, 48 urbanization level and 21 gen-
der), leaving 130, 222 persons for analysis. Characteristics
of the population used for this study were described in
Table 1.
Four variables were used to describe the monthly var-
iation of transportation: (1) the mean number of all
trips per person per day; (2) the mean number of active
trips per person per day; (3) the percen tage of people
who take at least one active trip in a day; and (4) the
percentage of active trips among st all trips less than on e
mile. Subsequent analyses focused on percentage of peo-
ple who take at least one active trip in a day (denoted
by PAT), because the percent of active trips among all
trips was unstable due to small numbers of daily trips
among some individuals. For each age group, logistic
regression was used to identify predictors of PAT
including gen der, race/ethnicity, house hold income
level, region, urbanization level and travel month.
Yang et al. International Journal of Behavioral Nutrition and Physical Activity 2011, 8:96
/>Page 2 of 9
Results
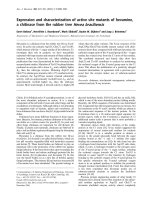
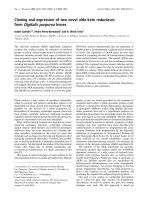
Figure 1 shows monthly variations in the four measures
of active transportation by age grou p. The mean number
of total trips was higher for adults than for the other
three age groups: on average in a year, each adult had
4.47 trips per day, while for the other three groups the
mean number of trips ranged between 3.49 and 3.60 per
day. Children had a clear seasonal pattern with a str ong
peak in June, while the other three groups had a weaker
but still clear seasonal pattern with higher values in sum-
mer than winter generally, but with a trough in July.
In contrast to total trips, active trips were more fre-
quent in adolescents and children, and least frequent in
the adults and elderly. Adolescents had a mean of 0.58
active trips per day, 26% had at least one active trip per
day, and 43% of all trips less than one mile were active
trips; the elderly had a mean of 0.31 active trips per day,
15% had at least one active trip per day, and 24% of all
trips under a mile were active. Active trips also varied
seasonally: adolescents and children were most sensitive
to seasonality. Adolescents and children had two peak
periods: June and August/September. Less clear seasonal-
ity was observed in adults and the elderly.
Table 2 shows independent associations of each of the
socio-demographic predictors and month with the odds
of having at least one daily active trip for each age group.
Sample sizes were very large so confidence limits were
homogeneously tight and are not shown. Female adults
had higher odds of active trips than male adults, while
forallotherthreeagegroups,malesweremoreactive
Table 1 Characteristics of the study population
Age group 5-10 years 11-17 years 18-64 years 65+ years All
Percentage (%) 9.8 (n = 12723) 11.1 (n = 14442) 66.9 (n = 87053) 12.3 (n = 16004) 100
Sex Male 51.8 51.3 49.2 42.6 48.9
Female 48.2 48.7 50.8 57.4 51.1
Race/ethnicity White 70.9 73.9 77.1 86.2 77.3
Black 14.3 16.6 12.5 10.5 12.9
Asian 2.6 2.1 2.9 1.1 2.5
Hispanic 12.2 7.4 7.6 2.2 7.3
Household income level <20k 15.7 13.0 12.6 30.6 15.2
20-40 k 23.6 21.8 23.8 36.3 25.1
40-80 k 36.9 39.0 38.0 24.4 36.4
>80k 23.9 26.2 25.5 8.6 23.4
Region Northeast 18.1 18.9 18.7 20.7 18.9
Midwest 24.3 24.6 23.3 24.5 23.7
South 34.7 35.3 36.2 36.5 36.0
West 22.9 21.2 21.9 18.2 21.5
Urbanization level Rural 21.8 24.0 20.5 21.6 21.1
Town 24.1 23.2 22.3 21.3 22.4
Suburban 23.0 24.3 24.3 22.7 24.0
Second city 17.4 15.8 17.7 21.0 17.9
Urban 13.8 12.7 15.2 13.3 14.6
Month January 8.5 8.7 8.7 7.7 8.5
February 8.0 7.3 7.8 7.2 7.7
March 9.0 9.0 8.5 8.1 8.6
April 8.4 8.2 8.2 8.0 8.2
May 8.2 8.8 8.1 9.4 8.4
June 8.0 8.1 8.1 8.4 8.1
July 8.3 8.1 8.2 9.8 8.4
August 7.8 8.0 8.4 9.7 8.5
September 8.3 8.1 8.2 8.5 8.3
October 8.8 8.0 9.0 7.0 8.6
November 8.0 8.5 8.2 8.1 8.2
December 8.8 9.2 8.6 8.1 8.6
Yang et al. International Journal of Behavioral Nutrition and Physical Activity 2011, 8:96
/>Page 3 of 9
24
68
1
0
12
3.0 3.5 4.0 4.5
1
24
68
1
0
12
0.2 0.4 0.6 0.8
2
C
T
A
E
24
68
1
0
12
0.10 0.20 0.30
3
24
68
1
0
12
0.2 0.3 0.4 0.5
4
Figure 1 Monthly variation of the four variables for ag e groups (1: total trip; 2: active trip; 3: percentage of people who took active
trip; 4: percentage of active trips amongst trips less than one mile). Note: for X axis, 1 means January, 2 means February, and so on.
Table 2 Odds ratios for the association between PAT and selected variables within four age groups
Age groups 5-10 years 11-17 years 18-64 years 65+ years
Number 11556 13651 84712 20303
Sex Male 1111
Female 0.84 0.87 1.12 0.87
Race/ethnicity White 1.00 1.00 1.00 1.00
Black 0.98 1.50 0.880 0.96
Asian 0.67 0.79 0.82 0.70
Hispanic 0.99 0.95 0.83 1.15
Household income level <20k 1.00 1.00 1.00 1.00
20-40 k 0.81 0.93 0.67 0.91
40-80 k 0.68 0.76 0.69 1.13
>80k 0.64 0.53 0.86 1.36
Region Northeast 1.00 1.00 1.00 1.00
Midwest 0.70 0.85 0.67 0.84
South 0.58 0.58 0.56 0.68
West 0.93 0.93 0.73 1.07
Urbanization level Rural 1.00 1.00 1.00 1.00
Town 1.46 1.16 1.24 1.00
Suburban 1.61 1.52 1.39 1.31
Second city 1.59 1.63 1.84 1.38
Urban 2.43 1.91 3.00 1.99
Month January 1.00 1.00 1.00 1.00
February 1.13 1.22 0.98 1.02
March 0.95 0.92 0.90 0.85
April 1.33 1.38 1.35 1.09
May 1.67 1.54 1.46 1.19
June 2.02 1.54 1.33 1.12
July 1.09 1.06 1.27 1.36
August 1.48 1.36 1.37 1.10
September 1.20 1.31 1.10 1.02
October 1.18 1.22 1.20 1.10
November 1.39 0.95 1.08 0.99
December 0.86 0.95 0.91 0.94
Note: confidence intervals are not shown because the very large sample size resulted in very tight confidence intervals.
Yang et al. International Journal of Behavioral Nutrition and Physical Activity 2011, 8:96
/>Page 4 of 9
than females. Asians had lower odds of active transporta-
tion than other race/ethnic groups across all age groups.
Thelargestrace/ethnicdifferencewasobservedamong
adolescents, with black adolescents having more than
50% higher odds of active trips than other racial groups.
Among children and adolescents, higher income level
was associated with lower odds of active trips. In adults,
those with incomes less than 20 k per year had the
highest odds of active trips and those earning more than
80 k per year the second highest. Among the elderly all
income groups had similar odds of active transportation,
with those earning more than 80 k per year having the
highest odds of active trips. In terms of regional differ-
ences, all age groups displayed similar patterns, that is,
people living in the West and Northeast had the highest
odds of active trips, people in the South had the lowest
odds, and people in Midwest had intermediate levels.
People who lived in areas with higher levels of urbaniza-
tion had higher odds of active trips than those living in
less urban areas.
With respect to seasonal variation, children, adoles-
cents and adults had similar patterns: April, May a nd
June corresponded to peaks in active trips. For the
elderly, the peak time was July. Generally, younger peo-
ple were more sensitive to seasonal variation than older
people.
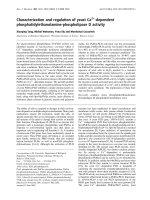
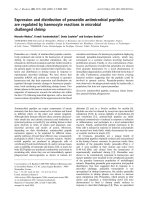
Seasonal differences in active trips by gender are
shown in Figure 2. Very similar patterns were observed
for males and females across age groups. For children
and adolescents, females were relatively less sensi tive to
seasonality compared to males.
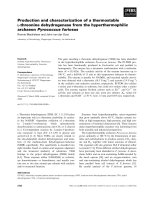
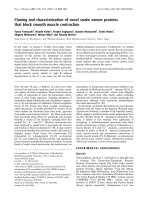
Figure 3 shows monthly PAT by race/ethnicity group.
White respondents had lower PAT and were less sensi-
tive to seasonality than other groups. Among Black,
Asian and Hispanic respondents, adolescents and chil-
dren were more sensitive to seasonality than adults and
the elderly with the possible exception of Asian children.
Figure 3 shows monthly PAT by household income
level. Generally, the lower the household income, the
higher PAT. Children and adolescents with higher
household income levels were more sensitive to
seasonality.
Figure 3 shows monthly variation in active trips in four
regions of US. The South had the lowest PAT amongst
all four age groups and was least sensitive to seasonal ity,
whereas seasonal changes were most pronounced in the
Midwest. In all regions, children and adolescents were
the most sensitive groups to seasonality.
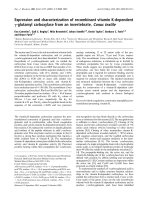
Figure 4 shows monthly PAT for areas with different
levels of urbanization. PAT increased in a dose response
fashion from rural to urban area. Increases from rural to
urban areas were more pronounced for younger groups
than for the elderly. People in rural areas had the lowest
PAT with the smallest differences among age groups.
Discussion
This study examined factors associated with variations in
active transportation and seasonal patterns in active
transportation by different subgroups. The probability of
engaging in active transportation was generally higher for
children and adolescents than for adults and the elderly.
There were also important overall differenc es in active
transportation by income, region, and level of urbaniza-
tion: in general active transportation was greater in the
lower income groups (except in the elderly), was lower in
the South than in o ther regions of the US, and was
greater in areas with higher urbanization. There was also
evidence of import ant seasonality, with high percentages
24
68
1
0
12
0
.
10 0
.
20 0
.
30 0
.4
0
Male
24
68
1
0
12
Female
C
T
A
E
Figure 2 Gender difference of the monthly PAT.
Yang et al. International Journal of Behavioral Nutrition and Physical Activity 2011, 8:96
/>Page 5 of 9
during the summer months such as June and low percen-
tage during the winter months such as January, although
patterns varied somewhat across age groups, genders,
race/ethnicity, household income levels, regions of resi-
dence and urbanization levels. Children and adolescents
were more sensitive to seasonality than other age groups.
Further, people who were non-Caucasians, with lower
household income, residing in regions of the Midwest
and Northeast and in areas with higher levels of urbani-
zation had greater seasonal variation.
Children and adolescents were more likely to have
active trips than other age groups. The greater seasonal-
ityobservedinchildrenandadolescentscomparedto
other groups may be because walking or cycling may be
strongly affected by the summer school break during
which children and adolescents engage in more active
0.00.20.40.6
White
C
T
A
E
Black Asian
Hispanic
0.0 0.2 0.4 0.6
Less than 20k 20−40k 40−80k More than 80k
24
68
1
0
12
0.00.20.40.6
Northeast
24
68
1
0
12
Midwest
24
68
1
0
12
South
24
68
1
0
12
West
R
eg
i
ons
H
ouse
h
o
ld
i
ncome
R
ac
i
a
l
groups
Figure 3 Monthly PAT for groups by race, level of household income and regions.
24
68
1
0
12
0.0 0.1 0.2 0.3 0.4 0.
5
Rural
C
T
A
E
24
68
1
0
12
Tow n
24
68
1
0
12
Suburban
24
68
1
0
12
Second City
24
68
1
0
12
Urban
Figure 4 Monthly PAT for areas with different levels of urbanization.
Yang et al. International Journal of Behavioral Nutrition and Physical Activity 2011, 8:96
/>Page 6 of 9
trans porta tion due to good weather, more fr ee time and
more options for summer activities. Developing strate-
gies to maintain active transportation levels as people
age, and particularly to encourage active transportation
among the elderly, is therefore an important need.
Active transportation was generally more common in
the lower income groups (although this pattern was not
consistent at all ages). Stronger seasonality among low
income groups and non-Caucasians may simply reflect
greater probability of walking or bicycling for transporta-
tion among these groups. It has been suggested that the
relationship between income and active transportation
maybemediatedinpartbyneighborhoodsocialand
physical environments [32-34]. For example, higher
income groups and non-Caucasians may be more likely
to live in suburban areas with longer distances from their
households to daily destinati ons, making them rely more
on private vehicles. An interesting exception to the
income patterning was the effect of income among the
elderly: high income elderly were more likely to have
active trips that low income elderly possibly reflecting
residential locations and access to destinations among
high income elderl y who may be retiring to communities
that favor active transportation. One interesting observa-
tion was that among Asians, children are more similar to
the elderly than to adolescents in terms of active travel,
which is distinct from the other race/ethnicity groups,
this may be explained by cultural differences resulting in
Asian elderly spending more time with their grandchil-
dren, such as walking the children to school.
Access to destina tions and public transportat ion could
also explain the regional and urban-suburban diffe rences
that we observed. More urbanized areas have a higher
population density and a more advanced infrastructure
providing greater access to active transportation. Identi-
fying strategies that facil itate active transportation across
social groups by encouraging mixed land use and
improving public transportation access could help
increase levels of physical activity across the population
as a whole. The seasonal variation in active transporta-
tion in different regions, especially among children and
adolescents, corresponded with the climate patterns.
Generally, in the regions of the Midwest and Northeast,
active transportation peaks during summer whereas
regions of the South have relatively warm weather during
the spring and autumn and hot humid weather in the
summer resulting in peaks in active transporta tion peaks
during the spring and autumn.
To the authors’ knowledge, this is among the first stu-
dies to examine variations in active transportation across
the US as a whole and variations in seasonal patterning
by socio-demographic and regional factors. However,
several limitations of this study should be pointed out.
Firstly, although active transportation is an important
component of physical activity, the focus on active trans-
portation may not fully capture seasonal variations in
total physical activity. For example, pleasant weather dur-
ing the summer in most regions may have both positive
and negative effects on different components of total
physical activity. Pleasant weather provides safer, more
aesthetic conditions for active transportation. At the
same time, pleasant weather might also encourage people
to engage in other physical activities, such as water and
other outdoor recreation, some of which may r equire
passive transportation to reach recreation areas. In addi-
tion if people get enough physical activity in other ways,
they may be more reluctant to choose active transporta-
tion modes. Moreover, these analyses did not examine
the actual physical activity intensity of the active trans-
portation which depends on distance travelled as well as
on speed and characteristics of the terrain. Secondly,
active transportation is affected by other factors such as
holidays (for example, school holiday for students), unex-
pected events such as epidemic outbreaks or other
national or regional events (for example, the NHTS 2001
sample may be influenced by September 11 [35]). Third,
the NHTS 2001 sample is intended to be approximately
representative of the whole US population, but does not
cover the increasing numbers of households with only
cellular phones and no landlines [36].
This study provides important descriptive data for the
development and targeting of interventions and policies to
promote active transportation and physical activity gener-
ally. Together with previous research, this study confirms
the need to design and implement group-specific and sea-
son-specific interventio n policies. For example, active
transportation such as active travel to school is of special
importance for children and adolescents. Studies have
shown that walking or bicycling to and from scho ol is
associated with higher overall physical activity [37-39]. In
addition , it can reduce children’s dependence on parents,
improve social interaction, and promote healthier life style
patterns that may be maintained in adulthood. However,
the percentage of students who walked or biked to and
from school decreased from 40.7% in 1969 to 12.9% in
2001 [5]. According to the CDC, weather is one of the
most common barriers for children’s walking to school
together with distance to school and traffic-related danger
[40]. Strategies to promote active transportation in chil-
dren (as well as adults) should not only make the built
environment safer , more convenien t and more comforta-
ble for people to engage in walking or bicycling by design-
ing safer streets, sidewalks and bicycling lanes, but also
take into consideration the role of seasonal patterns and
attempt to eliminate at least some of the barriers to active
transportation in inclement weather by providing showers,
change rooms and secure bicycle storage areas. Winter
maintenance of sidewalks and bike paths and lanes
Yang et al. International Journal of Behavioral Nutrition and Physical Activity 2011, 8:96
/>Page 7 of 9
coupled with programs to increase walking and biking to
school in the winter could also contribute to greater active
transport during winter months in northern areas.
Active transportation is far more common in European
countries than in the United States [41], and the shares
of active trips in some European countries were 3 to
5 times as high as the shares in any US state [42]. Policies
implemented in these countries whic h could be relevant
to the US include not only the provision of safe, conveni-
ent and attractive infrastructure for pedestrians and
cyclists, but also restrictions on car use, such as car-free
zones, traffic calming facilities and limited parking
[42,43]. Educational campaigns focused on changing
social norms should be combined with the adoption of
mixed and compacted land-use policies which could
generate trips with shorter distances and make active
transportation possible in the first place [41,42]. It is
important to note that even countries with adverse cli-
mates can have large proportions of active transportation,
and that policies that facilitate active transportation may
dampen seasonal variations. In fact the presence of seaso-
nal variation may reflect the fact that environmental con-
ditions (related to proximity of destinations and
infr astructure for active transportation) are generally not
favorable to active transportation; hence it only occurs
when the weather is good. Strategies that make active
transportation less dependent on seasonal variations is an
important need and could be an important strategy to
improve active transportation in the US generally.
Acknowledgements
Support for this work was received from the Robert Wood Johnson
Foundation Health and Society Scholars program.
Author details
1
Department of Epidemiology, Center for Social Epidemiology and
Population Health, University of Michigan, Ann Arbor, Michigan, USA.
2
Transportation Research Institute, University of Michigan, Ann Arbor,
Michigan, USA.
Authors’ contributions
YY designed the study, performed data analysis, and drafted the manuscript.
AD participated in the study design and helped to draft the manuscript. YY,
AD and RB critically reviewed and revised versions of the manuscript. All
authors read and approved the final manuscript.
Competing interests
The authors declare that they have no competing interests.
Received: 4 April 2011 Accepted: 14 September 2011
Published: 14 September 2011
References
1. Pate RR, Pratt M, Blair SN, Haskell WL, Macera CA, Bouchard C, Buchner D,
Ettinger W, Heath GW, King AC, et al: Physical activity and public health.
A recommendation from the Centers for Disease Control and Prevention
and the American College of Sports Medicine. JAMA 1995, 273:402-407.
2. Haskell WL, Lee IM, Pate RR, Powell KE, Blair SN, Franklin BA, Macera CA,
Heath GW, Thompson PD, Bauman A: Physical activity and public health:
updated recommendation for adults from the American College of
Sports Medicine and the American Heart Association. Circulation 2007,
116:1081-1093.
3. Maibach E, Steg L, Anable J: Promoting physical activity and reducing
climate change: Opportunities to replace short car trips with active
transportation. Preventive Medicine 2009, 49:326-327.
4. Ham SA, Macera CA, Lindley C: Trends in Walking for Transportation in
the United States, 1995 and 2001. Preventing Chronic Disease 2005, 2:A14.
5. McDonald NC: Active Transportation to School: Trends Among U.S.
Schoolchildren, 1969-2001. American Journal of Preventive Medicine 2007,
32:509-516.
6. Simpson ME, Serdula M, Galuska DA, Gillespie C, Donehoo R, Macera C,
Mack K: Walking trends among U.S. adults: The Behavioral Risk Factor
Surveillance System, 1987-2000. American Journal of Preventive Medicine
2003, 25:95-100.
7. Sallis JF, Frank LD, Saelens BE, Kraft MK: Active transportation and physical
activity: opportunities for collaboration on transportation and public
health research. Transportation Research Part A: Policy and Practice 2004,
38:249-268.
8. Handy SL, Boarnet MG, Ewing R, Killingsworth RE: How the built
environment affects physical activity views from urban planning.
American Journal of Preventive Medicine 2002, 23(2 S):64-73.
9. Brownson RC, Baker EA, Housemann RA, Brennan LK, Bacak SJ:
Environmental and policy determinants of physical activity in the United
States. American Journal of Public Health 2001, 91:1995-2003.
10. Owen N, Humpel N, Leslie E, Bauman A, Sallis JF: Understanding
Environmental Influences on Walking: Review and Research Agenda.
American Journal of Preventive Medicine 2004, 27:67-76.
11. Humpel N, Owen N, Leslie E: Environmental Factors Associated with
Adults’ Participation in Physical Activity: A Review. American Journal of
Preventive Medicine 2002, 22:188-199.
12. Saelens BE, Handy SL: Built Environment Correlates of Walking: A Review.
Medicine & Science in Sports & Exercise 2008, 40(7 S):S550-S566.
13. Tucker P, Gilliland J: The effect of season and weather on physical
activity: a systematic review. Public Health 2007, 121:909-922.
14. Nankervis M: The effect of weather and climate on bicycle commuting.
Transportation Research Part A: Policy and Practice 1999,
33:417-431.
15.
Reilly T, Peiser B: Seasonal Variations in Health-Related Human Physical
Activity. Sports Medicine 2006, 36:473-485.
16. Bélanger M, Gray-Donald K, O’Loughlin J, Paradis G, Hanley J: Influence of
Weather Conditions and Season on Physical Activity in Adolescents.
Annals of Epidemiology 2009, 19:180-186.
17. Pivarnik JM, Reeves MJ, Rafferty AP: Seasonal variation in adult leisure-
time physical activity. Medicine & Science in Sports & Exercise 2003,
35:1004-1008.
18. McCormack GR, Friedenreich C, Shiell A, Giles-Corti B, Doyle-Baker PK: Sex-
and age-specific seasonal variations in physical activity among adults.
Journal of Epidemiology and Community Health 2010, 64:1010-1016.
19. Merrill RM, Shields EC, White GL, Druce D: Climate conditions and physical
activity in the United States. American Journal of Health Behavior 2005,
29:371-381.
20. Baranowski T, Thompson WO, DuRant RH, Baranowski J, Puhl J:
Observations on physical activity in physical locations: age, gender,
ethnicity and month effects. Research quarterly for exercise and sport 1993,
127-133.
21. Shephard R, Aoyagi Y: Seasonal variations in physical activity and
implications for human health. European Journal of Applied Physiology
2009, 107:251-271.
22. Kolle E, Steene-Johannessen J, Andersen L, Anderssen S: Seasonal variation
in objectively assessed physical activity among children and adolescents
in Norway: a cross-sectional study. International Journal of Behavioral
Nutrition and Physical Activity 2009, 6:36.
23. Plasqui G, Westerterp KR: Seasonal Variation in Total Energy Expenditure
and Physical Activity in Dutch Young Adults. Obesity 2004, 12:688-694.
24. Chan C, Ryan D: Assessing the Effects of Weather Conditions on Physical
Activity Participation Using Objective Measures. International Journal of
Environmental Research and Public Health 2009, 6:2639-2654.
25. King A, Castro C, Eyler A: Personal and environmental factors associated
with physical inactivity among different racial/ethnic groups of U.S.
middle-aged and older-aged women. Health Psych 2000, 19:354-364.
26. BRFSS Coordinators: Monthly estimates of leisure-time physical inactivity -
United States, 1994. MMWR 1997, 46:393-397, 393-397.
Yang et al. International Journal of Behavioral Nutrition and Physical Activity 2011, 8:96
/>Page 8 of 9
27. Gordon-Larsen P, McMurray R, Popkin B: Determinants of adolescent
physical activity and inactivity patterns. Pediatrics 2000, 105:E83.
28. Ross JG, Gilbert GG: The national children and youth fitness survey: a
summary of findings. Journal of Physical Education, Recreation & Dance
articles 1985, 56:43-90.
29. Brandt EN, McGinnis JM: National Children and Youth Fitness Study: its
contribution to our national objectives. Public Health Reports 1985,
100:1-3.
30. Census Regions and Divisions of the United States. [sus.
gov/geo/www/us_regdiv.pdf].
31. Miller DR, Hodges K: A Population Density Approach to Incorporating an
Urban-Rural Dimension into Small Area Lifestyle Clusters. Annual Meeting
of the Population Association of America Miami, Florida; 1994.
32. Ball K, Timperio A, Salmon J, Giles-Corti B, Roberts R, Crawford D: Personal,
social and environmental determinants of educational inequalities in
walking: a multilevel study. Journal of Epidemiology and Community Health
2007, 61:108-114.
33. Kamphuis CB, Lenthe FJv, Giskes K, Huisman M, Brug J, Mackenbach JP:
Socioeconomic differences in lack of recreational walking among older
adults: the role of neighbourhood and individual factors. International
Journal of Behavioral Nutrition and Physical Activity 2009, 6.
34. Cerin E, Leslie E, Owen N: Explaining socio-economic status differences in
walking for transport: An ecological analysis of individual, social and
environmental factors. Social Science & Medicine 2009, 68:1013-1020.
35. U.S. Department of Transportation, Research and Innovative Technology
Administration, Bureau of Transportation Statistics: Estimated Impacts of
September 11th on US Travel Washington, DC; 2006.
36. Pucher J, Renne JL: Socioeconomics of Urban Travel: Evidence from the
2001 NHTS. Transportation Quarterly 2003, 57:49-77.
37. Sirard J, Riner W, McIver K, Pate R: Physical activity and active commuting
to elementary school. Medicine & Science in Sports & Exercise 2005,
37:2062-2069.
38. Davison K, Werder J, Lawson C: Children’s active commuting to school:
current knowledge and future directions. Prev Chronic Dis 2008, 5.
39. Cooper AR, Andersen LB, Wedderkopp N, Page AS, Froberg K: Physical
Activity Levels of Children Who Walk, Cycle, or Are Driven to School.
American Journal of Preventive Medicine 2005, 29:179-184.
40. CDC: Barriers to Children Walking to or from School - United States,
2004. Morbidity and Mortality Weekly Report 2005, 54:949-952.
41. Bassett DR, Pucher J, Buehler R, Thompson DL, Crouter SE: Walking,
cycling, and obesity rates in Europe, North America, and Australia.
Journal of Physical Activity and Health 2008, 5:795-814.
42. Pucher J, Buehler R, Bassett DR, Dannenberg AL: Walking and Cycling to
Health: A Comparative Analysis of City, State, and International Data.
Am
J Public Health 2010, 100 :1986-1992.
43. Pucher J, Dijkstra L: Promoting Safe Walking and Cycling to Improve
Public Health: Lessons From The Netherlands and Germany. American
Journal of Public Health 2003, 93:1509-1516.
doi:10.1186/1479-5868-8-96
Cite this article as: Yang et al.: Variability and seasonality of active
transportation in USA: evidence from the 2001 NHTS. International
Journal of Behavioral Nutrition and Physical Activity 2011 8:96.
Submit your next manuscript to BioMed Central
and take full advantage of:
• Convenient online submission
• Thorough peer review
• No space constraints or color figure charges
• Immediate publication on acceptance
• Inclusion in PubMed, CAS, Scopus and Google Scholar
• Research which is freely available for redistribution
Submit your manuscript at
www.biomedcentral.com/submit
Yang et al. International Journal of Behavioral Nutrition and Physical Activity 2011, 8:96
/>Page 9 of 9