Báo cáo y học: "Evolutionary potentials: structure specific knowledge-based potentials exploiting the evolutionary record of sequence homolog" docx
Bạn đang xem bản rút gọn của tài liệu. Xem và tải ngay bản đầy đủ của tài liệu tại đây (524.31 KB, 11 trang )
Genome Biology 2008, 9:R68
Open Access
2008Panjkovichet al.Volume 9, Issue 4, Article R68
Method
Evolutionary potentials: structure specific knowledge-based
potentials exploiting the evolutionary record of sequence homologs
Alejandro Panjkovich
*‡
, Francisco Melo
*
and Marc A Marti-Renom
†
Addresses:
*
Departamento de Genética Molecular y Microbiología, Facultad de Ciencias Biológicas, Pontificia Universidad Católica de Chile,
Alameda 340, Santiago, Chile.
†
Structural Genomics Unit, Bioinformatics Department, Centro de Investigación Príncipe Felipe (CIPF), Av.
Autopista del Saler, 16, 46013 Valencia, Spain. Current address:
‡
Institute for Research in Biomedicine (IRB) and Barcelona Supercomputing
Center (BSC), c/Josep Samitier 1-5, 08028 Barcelona, Spain.
Correspondence: Francisco Melo. Email: Marc A Marti-Renom. Email:
© 2008 Panjkovich et al.; licensee BioMed Central Ltd.
This is an open access article distributed under the terms of the Creative Commons Attribution License ( which
permits unrestricted use, distribution, and reproduction in any medium, provided the original work is properly cited.
Evolutionary potentials for protein structure prediction<p>So-called ‘Evolutionary potentials’ for protein structure prediction are derived using a single experimental protein structure and all three-dimensional models of its homologous sequences.</p>
Abstract
We introduce a new type of knowledge-based potentials for protein structure prediction, called
'evolutionary potentials', which are derived using a single experimental protein structure and all
three-dimensional models of its homologous sequences. The new potentials have been
benchmarked against other knowledge-based potentials, resulting in a significant increase in
accuracy for model assessment. In contrast to standard knowledge-based potentials, we propose
that evolutionary potentials capture key determinants of thermodynamic stability and specific
sequence constraints required for fast folding.
Background
Comparative protein structure prediction is typically imple-
mented in four main steps: fold assignment, target-template
alignment, model building, and model assessment [1]. Thus,
the starting point in comparative modeling identifies protein
structures related to the target sequence. This initial step is
normally performed using profile-based search methods such
as PSI-BLAST, hidden Markov models or profile-profile
methods [2]. Once a fold has been assigned, a specialized
alignment method is used to optimally align the target
sequence with the template structure. Then, the target-tem-
plate alignment is used to build a structure model of the target
sequence. Finally, the model assessment step predicts
whether or not the correct template was assigned and at least
an approximately correct alignment was produced. Thus,
estimating the accuracy of a protein structure model is essen-
tial for determining the information that can be extracted
from it. In this work we describe the development and imple-
mentation of a new method for model assessment.
Physics and knowledge-based scoring functions, which com-
prise an essential tool for computationally predicting the
three-dimensional structure of a polypeptide, are now rou-
tinely applied in model assessment. Two fundamentally dif-
ferent approaches have been developed for deriving such
scoring functions. The first approach, which is of inductive
nature, uses simplified mathematical models for describing
the system without previous knowledge of its properties [3].
The second approach, which is of deductive nature, uses geo-
metrical descriptors derived from known protein structures
to score the interaction between two or more particles [4].
These types of scoring functions, which are often referred to
as statistical potentials, knowledge-based potentials or
potentials of mean force, have previously been applied in
many different assessment problems, including: determina-
tion of whether or not a model has the correct fold [5-8];
detection of localized errors in protein structures [9]; assess-
ment of the stability of mutant proteins [10]; discrimination
between native and near-native states [11-13]; and selection
Published: 8 April 2008
Genome Biology 2008, 9:R68 (doi:10.1186/gb-2008-9-4-r68)
Received: 13 March 2008
Revised: 2 April 2008
Accepted: 8 April 2008
The electronic version of this article is the complete one and can be
found online at />Genome Biology 2008, 9:R68
Genome Biology 2008, Volume 9, Issue 4, Article R68 Panjkovich et al. R68.2
of the most near-native model in a set of decoys that does not
contain the native structure [13-15]. In general, different
types of assessment problems can benefit from specialized
scoring functions or classifiers [16]. In this work, we focus on
the model assessment problem that assesses whether or not a
given model has the correct fold and was built using an
approximately correct alignment [17,18].
Standard knowledge-based potentials are derived by applying
the inverse of the Boltzmann's equation on distributions of
geometrical features calculated from a non-redundant set of
known protein structures [4]. Therefore, such potentials
effectively capture the general trends of atomic interactions
for average globular proteins. However, each protein struc-
ture may have specific features that are critical for its folding
and stability, which are either not captured or poorly repre-
sented by current knowledge-based potentials. In this work,
we describe a methodology to derive a new type of knowledge-
based potentials, here termed evolutionary potentials (EvPs),
which is designed to overcome such a limitation. EvPs are
specifically derived for a restricted structural space based on
a single experimental structure and all its detectable protein
sequence homologues. We propose that the incorporation of
a large amount of sequence information mapped onto a
restricted three-dimensional space allows EvPs to capture
and balance the specific key interactions occurring within a
given protein fold.
We begin this article by assessing the accuracy of the EvPs in
model assessment, comparing it to a representative potential
of identical parameterization as well as to other commonly
used knowledge-based potentials (Results). Next, we discuss
the key determinants in the implementation of EvPs as well as
their likely impact on protein structure prediction of genes
and genomes. Finally, we end by describing the proposed
methodology for the derivation of EvPs (Materials and
methods).
Results
EvPs are calculated using a single experimental structure and
the threaded models of its detectable homologous sequences,
which represent the space of protein sequences that may
adopt its fold. Thus, two major variables impact the deriva-
tion of EvPs: the stringency of the clustering process (that is,
the structural clustering cut-offs) and the deepness of the
multiple sequence alignments (MSAs) (that is, the sequence
identity cut-off for selecting homologous sequences). First,
we assess the impact of these two variables on the accuracy of
the EvPs for model assessment. Second, we assess the impact
of EvP selection in the same benchmark. Finally, we compare
the accuracy of EvPs to that obtained with a representative
distance-dependence potential derived using the same
parameters, and also with other potentials such as DFIRE
[19] and Prosa II [4,20,21].
Strict structural clustering results in more accurate
EvPs
The clustering of the structural space affects the selection and
specificity of EvPs for model assessment. Various combina-
tions of thresholds for structure similarity (that is, 80% and
90% of Cα atoms within 4 Å) and sequence identity (that is,
90%, 80%, 50%, 20%, and 10%) were applied to obtain 10 dif-
ferent sets of representative chains. EvPs calculated from the
strictest clustering corresponding to 90% sequence and struc-
tural identity resulted in the most accurate assessment of the
model accuracy as measured by their maximal accuracy
(ACC), the area under the curve (AUC), false positive rate
(FPR), and true positive rate (TPR) (that is, 99.5% AUC,
97.4% ACC, 2.3% FPR, and 97.0% TPR; Table 1). Variation of
sequence identity for clustering had a marginal impact on the
accuracy of the EvPs. However, a decrease of only 10% in the
cut-off for the structural similarity had a larger impact, reduc-
ing the ACC and the TPR of the EvPs up to approximately 2%
and 4%, respectively. Therefore, the accuracy of the EvPs for
model assessment decreases as more structural variability is
allowed within the clusters that represent the structure space
(Table ; Figure 1a; Table S1 in Additional data file 1).
Incorporation of more distantly related sequences
results in more accurate EvPs
The selected sequence space (that is, sequences in the MSA)
used for the derivation of EvPs affects their accuracy for
model assessment. EvPs derived using 20%, 40%, and 60%
cut-offs for homology detection were calculated for 88.2%,
59.5%, and 31.2% of all non-redundant chains, respectively
(Table S2 in Additional data file 1). The remaining EvPs were
not calculated because the input MSA at the respective
sequence identity cut-off contained less than 50 sequences. In
those cases, the number of sequences to thread is too small to
reliably derive a potential [18].
The accuracy of the EvPs upon the selected sequence space
shows an opposite trend to that observed for the structural
clustering (Table 2; Figure 1b; Table S3 in Additional data file
1). The filtering cut-off of 20% sequence identity results in
97.4% ACC and 99.5% AUC. Increasing the sequence identity
cut-off results in an accuracy decrease of the EvPs. Thus, the
amount and similarity of the input sequences to derive the
EvPs have an impact on their accuracy. The average sequence
identity between the template and its homologous sequences
in the MSAs used for deriving EvPs was approximately 30%
(Table S2 in Additional data file 1), which indicates that EvPs
are able to capture relevant information even from distantly
related sequences. The difference in the resulting accuracy
decreases as we approach the limits of homology detection
(Figure 1b). Thus, the increase in accuracy by lowering the
sequence identity cut-off from 60% to 40% is larger than that
observed when lowering it from 40% to 20%.
Genome Biology 2008, Volume 9, Issue 4, Article R68 Panjkovich et al. R68.3
Genome Biology 2008, 9:R68
Strict EvP selection results in more accurate model
assessment
The selection of EvPs has an impact on their accuracy for
assessing the fold of a structure model. We have used four dif-
ferent strategies for selecting a particular EvP, which con-
sisted of: selection of the EvP that corresponds to the
structural representative of the used template for model
building; selection of the EvP corresponding to the closest
BLAST match using the model sequence against a database of
sequences for the calculated EVPs; selection of the EvP corre-
sponding to the closest PSI-BLAST match of the model
sequence against a database of sequences for the calculated
EVPs; and random selection of an EvP. The first protocol is
suitable for a comparative modeling exercise, the second and
third protocols are suitable for models built from 'template-
free' protein structure prediction methods, and the fourth
protocol was used as a negative control for the impact of the
EvP selection process.
The maximal accuracy for model assessment of the EvPs
increases with the ability to select the closest EvP to the target
sequence (Figure 2; Table S4 in Additional data file 1). Using
PSI-BLAST or BLAST for selecting the EvP results in 3.2%
and 3.9% lower ACC, respectively, compared to a template-
based selection (Table 3). The TPR decreases approximately
10% if the selected EvPs are not structurally close to the real
structures of the target proteins. As expected, a random selec-
tion of EvPs results in low accuracy (that is, 42.3% TPR and
12.1% FPR), which results in AUC and ACC being 27.6% and
28.8% lower, respectively, than when selecting the EvPs
based on the template used for model building (Table 3).
EvPs result in the highest accuracy for model
assessment
EvPs outperform the representative potential (REP) with a
7.1% higher ACC, 3.8% lower FPR, and 11.7% higher TPR
(Table 4; Figure 3; Table S5 in Additional data file 1). This
demonstrates that, even though EvPs are derived for single
structures, the incorporation of evolutionary information in
the form of MSAs significantly increases the accuracy of dis-
tance-dependent potentials for model assessment. Moreover,
the use of specific EvPs also outperforms the consensus EvP
potential (CON) and other standard knowledge-based poten-
tials such as Prosa II and DFIRE Cβ potentials (Table 4; Fig-
ure 3; Table S5 in Additional data file 1). The ACC of EvPs is
approximately 7% higher than that of CON, REP, and Prosa II
potentials and approximately 11% higher than the DFIRE
potential. EvPs also result in a very small FPR (2.3%) and a
high TPR (97.3%), being the most sensitive and specific
classifier tested in our benchmark for model assessment. The
REP and Prosa II potentials, which have been derived using
the same principles and differ only in the set of experimental
proteins used to derive them, result in very similar accuracies
(that is, approximately 95% AUC and approximately 90%
ACC). The DFIRE Cβ potential, which not only uses a differ-
ent training set but is also derived with a different reference
state than the REP and Prosa II potentials, results in lower
accuracy than any of the other tested methods with a 77.6%
TPR and 6.8% FPR.
Discussion
Generally, the accuracy of a protein structure model (that is,
model assessment) can be assessed by physics-based, knowl-
edge-based or a combination of both types of scoring func-
tions. Knowledge-based potentials assess protein structure
models by their fitting to the statistical preferences of differ-
ent residues or atom types to be exposed to the solvent, or to
interact with each other in a pairwise or higher order fashion.
These statistical preferences are normally extracted from a
set of selected structures, which represent the known struc-
tural space for native proteins. In this work we have
described, implemented and benchmarked a new method for
deriving distance-dependent knowledge-based potentials
that relies on information from the sequence space of a given
structure or fold. The method was validated for model assess-
Table 1
EvP model assessment accuracy for different clustering parameters
EvP AUC (%) ACC (%) OT FPR (%) TPR (%)
CLS_90-90 MSA_20 99.5 97.4 -4.18 2.3 97.0
CLS_90-80 MSA_20 99.3 97.2 -4.18 2.1 96.2
CLS_90-50 MSA_20 99.0 97.0 -4.18 2.2 95.8
CLS_90-10 MSA_20 99.0 97.0 -4.18 2.1 95.8
CLS_80-80 MSA_20 98.8 96.5 -4.18 1.8 94.2
CLS_80-50 MSA_20 97.7 94.7 -3.99 2.2 90.4
CLS_80-10 MSA_20 97.6 94.4 -3.92 2.5 90.2
The sets of EvPs are named according to the clustering parameters (CLS_XX-YY) and the multiple sequence alignment filters (MSA_ZZ) used to
derive them (Materials and methods). XX is the minimal structural similarity and YY is the minimal sequence identity used for structural clustering.
ZZ is the minimal sequence identity shared between a sequence in the multiple sequence alignment and the sequence of the representative structure
of the cluster. AUC is the area under the ROC curve, ACC is the maximal accuracy, OT is the optimal classification threshold, FPR is the false
positive rate, and TPR is the true positive rate.
Genome Biology 2008, 9:R68
Genome Biology 2008, Volume 9, Issue 4, Article R68 Panjkovich et al. R68.4
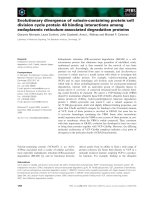
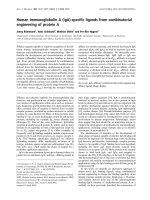
EvP accuracy at different structure and sequence clustering cut-offsFigure 1
EvP accuracy at different structure and sequence clustering cut-offs. (a) ROC curves for the different EvP sets depending on the structural clustering of
the PDB space. The inner panel zooms into the upper-left corner of the ROC curve to better show the differences between the curves. (b) ROC curves
for the different EvP sets derived using different cut-offs of sequence identity in the MSA. The inner panel zooms into the upper-left corner of the ROC
curve to better show the differences between the curves.
0.00 0.02 0.04 0.06 0.08 0.10
0.90
0.92
0.94
0.96
0.98
1.00
False positive rate
True positive rate
0.0 0.2 0.4 0.6 0.8 1.0
0.0
0.2
0.4
0.6
0.8
1.0
CLS_90-10 MSA_20
CLS_90-50 MSA_20
CLS_90-80 MSA_20
CLS_80-10 MSA_20
CLS_80-50 MSA_20
CLS_80-80 MSA_20
CLS_90-90 MSA_20
(a)
(b)
0.00 0.02 0.04 0.06 0.08 0.10
0.90
0.92
0.94
0.96
0.98
1.00
False positive rate
True positive rate
0.0 0.2 0.4 0.6 0.8 1.0
0.0
0.2
0.4
0.6
0.8
1.0
CLS_90-90 MSA_20
CLS_90-90 MSA_40
CLS_90-90 MSA_60
Genome Biology 2008, Volume 9, Issue 4, Article R68 Panjkovich et al. R68.5
Genome Biology 2008, 9:R68
ment using a large benchmark of 4,444 protein structure
models of varying accuracy [7,22]. The results show that the
use of homologous sequences for deriving specific knowl-
edge-based potentials increases the specificity and sensitivity
for model assessment (Figure 3; supplementary Tables in
Additional data file 1). The ACC of the EvPs is 7.1%, 8.0% and
10.8% higher than that of REP, Prosa II, and DFIRE Cβ
potentials, respectively. Moreover, EvPs result in very high
specificity (that is, a FPR of 2.3%) and sensitivity (that is, a
TPR of 97.0%) compared with those for REP, Prosa II, and
DFIRE Cβ (that is, FPR > 6%, TPR < 89%). This is particularly
relevant for large-scale protein structure prediction, where a
small improvement in the TPR and FPR can have a large
impact on the total number of models correctly selected and/
or wrongly discarded, respectively [17].
The benchmarking of the EvPs against two widely used model
assessment methods, Prosa II and DFIRE Cβ, provides a ref-
erence line for determining the difficulty of our test set of
comparative models. However, it is important to note that
neither Prosa II nor DFIRE Cβ were optimized against mod-
els generated with the MODELLER program. Both programs
were trained (that is, optimized) using sets of non-redundant
structures selected by their respective developers. The REP
potential, which was derived in a similar way to Prosa II, used
the same non-redundant structure space covered by the EvPs.
Thus, the results from the REP potential reflect the impact of
using a different structure space with respect to the results
from Prosa II. The accuracies of REP and Prosa II are statis-
tically indistinguishable at a 99% confidence cut-off (Table S5
in Additional data file 1). It is important to note that Prosa II,
DFIRE Cβ, and EvP were originally developed with the aim of
general applicability to any set of protein structure models.
Thus, we believe that comparing them using a test set that
mimics a large-scale comparative modeling setting is a fair
comparison.
The clustering of the structural space and the depth of the
MSAs affect the accuracy and coverage of the EvPs. Stricter
cut-offs for structural clustering and more permissive cut-offs
for MSAs result in more accurate EvPs. This indicates that
EvPs are very specific to the structure they represent. How-
ever, since a minimum number and diversity of sequences are
needed to derive an accurate potential, only those EvPs
derived for structures that had more than 50 sequences in the
MSA were used in our benchmark (that is, approximately
88% of the representative structures). Increasing the MSA
filtering cut-off dramatically lowered the coverage of our
method (that is, increasing the sequence identity cut-off from
20% to 40% decreased the coverage by approximately 30%).
The results indicate that the specificity to a given protein
structure rather than other properties of the EvPs is what
makes them more accurate with respect to other classically
Table 2
EvP model assessment accuracy for different MSA filtering parameters
EvP AUC (%) ACC (%) OT FPR (%) TPR (%)
CLS_90-90 MSA_20 99.5 97.4 -4.18 2.3 97.0
CLS_90-90 MSA_40 99.0 96.1 -4.05 2.0 93.4
CLS_90-90 MSA_60 97.6 93.1 -3.41 4.4 89.7
The sets of EvPs are named according to the clustering parameters (CLS_XX-YY) and the multiple sequence alignment filters (MSA_ZZ) used to
derive them (Materials and methods). XX is the minimal structural similarity and YY is the minimal sequence identity used for structural clustering.
ZZ is the minimal sequence identity shared between a sequence in the multiple sequence alignment and the sequence of the representative structure
of the cluster. AUC is the area under the ROC curve, ACC is the maximal accuracy, OT is the optimal classification threshold, FPR is the false
positive rate, and TPR is the true positive rate.
Table 3
EvP model assessment accuracy for different selection protocols
Selection protocol AUC (%) ACC (%) OT FPR (%) TPR (%)
EvP (CLUSTER) 99.5 97.4 -4.18 2.3 97.0
EvP (PSI-BLAST) 97.7 94.2 -1.86 2.2 89.2
EvP (BLAST) 97.5 93.5 -2.06 1.7 86.9
EvP (RND) 71.9 68.6 -1.82 12.1 42.3
EvPs in this table were generated using the CLS_90-90 clustering cut-offs and the MSA_20 MSA filtering cut-off. The sets of EvPs are named
according to the clustering parameters (CLS_XX-YY) and the multiple sequence alignment filters (MSA_ZZ) used to derive them (Materials and
methods). XX is the minimal structural similarity and YY is the minimal sequence identity used for structural clustering. ZZ is the minimal sequence
identity shared between a sequence in the multiple sequence alignment and the sequence of the representative structure of the cluster. AUC is the
area under the ROC curve, ACC is the maximal accuracy, OT is the optimal classification threshold, FPR is the false positive rate, and TPR is the
true positive rate.
Genome Biology 2008, 9:R68
Genome Biology 2008, Volume 9, Issue 4, Article R68 Panjkovich et al. R68.6
derived knowledge-based potentials. In other words, a more
specific potential results in more accurate model assessment.
However, as for any knowledge-based potential, the deriva-
tion of frequencies requires enough sampling for statistical
significance. In classically derived potentials, increasing the
number of non-redundant folds used during derivation solves
the problem. For EvPs, having a sufficient number of diverse
sequences in the MSA solves the problem. Thus, the accuracy
of the EvPs depends on a fine balance between structure
diversity and statistical reliability.
The optimal structure and sequence clustering parameters for
deriving reliable EvPs were 90% structural similarity, 90%
sequence similarity and a 20% cut-off for the identity between
the template sequence and the sequences in the MSA.
Although a 20% sequence identity may seem very low for
homology detection, all selected sequences for deriving an
EvP resulted in a significant PSI-BLAST alignment to the
query structure with an e-value smaller than 5 × 10
-4
. Thus,
the resulting alignments usually covered a substantial part of
the query structure and had short insertions/deletions. Opti-
mal EvPs thus represent a very restricted subset of the struc-
tural space covered by a diverse set of sequences, which most
probably adopt the fold corresponding to the selected struc-
tural space. This result agrees with the notion that protein
folding, at least for one-domain proteins, is largely deter-
mined by the topology of a protein's native structure rather
than its sequence-specific details [23,24]. We propose that
the use of homologous sequences for deriving an EvP capture
the conservation of sequence-unspecific features, such as the
solvent-accessible area or the folding φ-values (that is, the
effect of a mutation stabilizing the folding transition state
compared to stabilizing the native conformation). Thus, EvPs
may be able to effectively encode for both structure and
sequence based features when assessing the accuracy of pro-
tein structure models.
The results from the CON potential, which accounts for the
linear sum of all calculated frequencies used to derive
individual EvPs, show that the accuracy achieved by the EvPs
is not a simple and direct consequence of maximizing the
extraction of information from all available sequences and
structures, but rather a result of exploiting the information
from only those sequences that belong to a restricted struc-
tural space. Indeed, the use of less specific structure space
resulted in a 9.5% decrease in the TPR with respect to the
EvPs (Table 4). However, using the homologous sequence
space to all structures in the non-redundant set of structures
resulted in an accuracy increase with respect to other poten-
tials such as REP, Prosa II and DFIRE (Table 4). This suggests
that not only the thermodynamic features, important for pro-
tein structure stability, are captured by this methodology but
also key sequence determinants necessary for fast protein
folding.
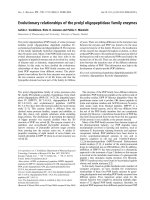
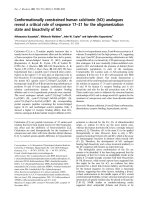
EvP accuracy using different assignment protocolsFigure 2
EvP accuracy using different assignment protocols. ROC curves for the
three EvP selection protocols: representative EvP of the template used in
the model building process (CLUSTER), closest EvP to the target sequence
based on a PSI-BLAST search (PSI-BLAST), closest EvP to the target
sequence based on a BLAST search (BLAST), and random selection of an
EvP (RND). EvP sets in this figure were generated using the CLS_90-90
clustering cut-offs and the MSA_20 MSA filtering cut-off.
False positive rate
True positive rate
0.0 0.1 0.2 0.3 0.4
0.6
0.7
0.8
0.9
1.0
EvP (CLUSTER)
EvP (BLAST)
EvP (PSI−BLAST)
EvP (RND)
Table 4
EvP model assessment accuracy compared to other potentials
Potential AUC (%) ACC (%) OT FPR (%) TPR (%)
EvP (CLUSTER) 99.5 97.4 -4.18 2.3 97.0
CON 97.1 92.8 -2.91 4.1 88.5
REP 95.9 90.3 -2.78 6.1 85.3
Prosa II 95.4 89.4 -2.52 6.3 83.6
DFIRE Cβ 92.7 86.6 -2.76 6.8 77.6
EvPs in this table were generated using the CLS_90-90 clustering cut-offs and the MSA_20 MSA filtering cut-off. The sets of EvPs are named
according to the clustering parameters (CLS_XX-YY) and the multiple sequence alignment filters (MSA_ZZ) used to derive them (Materials and
methods). XX is the minimal structural similarity and YY is the minimal sequence identity used for structural clustering. ZZ is the minimal sequence
identity shared between a sequence in the multiple sequence alignment and the sequence of the representative structure of the cluster. AUC is the
area under the ROC curve, ACC is the maximal accuracy, OT is the optimal classification threshold, FPR is the false positive rate, and TPR is the
true positive rate. For a detailed description of the CON and REP potentials see Materials and methods.
Genome Biology 2008, Volume 9, Issue 4, Article R68 Panjkovich et al. R68.7
Genome Biology 2008, 9:R68
EvPs are specially suited for the assessment of protein struc-
ture models based on comparative approaches where the
template used for modeling is known. Template-free methods
produce protein structure models based on small fragments
of known structure or without the use of templates. There-
fore, to apply our method in such cases, it is necessary to use
a sequence-based search method for selecting the most
appropriate EvP to assess the accuracy of a given model. The
results indicate that the use of BLAST or PSI-BLAST to select
an EvP decreases their AUC by 2.0% and 1.8%, respectively.
However, selecting a representative EvP by BLAST or PSI-
BLAST still results in more accurate assessment of models
than the REP potential (that is, 1.6% and 1.8% larger AUC,
respectively). Most importantly, compared to the REP poten-
tial, using the EvP potentials selected by BLAST or PSI-
BLAST reduced the FPR by 4.4 and 3.4%, respectively. This
demonstrates that EvPs are not limited to models built from
comparative approaches and can also be implemented in a
general pipeline for protein structure assessment and
prediction.
Conclusion
The results from our work indicate that the use of homolo-
gous sequences allows the derivation of specific knowledge-
based potentials for protein structure model assessment. In
contrast to standard knowledge-based potentials, which are
usually derived from a non-redundant set of native struc-
tures, the EvPs could also be capturing sequence features that
may affect the folding kinetics of a protein. EvPs outper-
formed other tested potentials with approximately 7-11%
higher accuracy, approximately 12-20% higher TPR, and
approximately 4% lower FPR. Such an increase in sensitivity
and specificity can have a significant impact on large-scale
automated protein structure prediction of genomes, which
could result in the correct assessment of the folds of more
than 500,000 extra models (that is, increase the TPR) and the
discarding of about 160,000 extra incorrect models (that is,
decrease the FPR). The novelty of EvPs and the conceptually
different approach for deriving them could have a broad
impact on protein structure prediction and design. Both fields
have now reached a mature state and comprise several meth-
ods that can produce fairly accurate models for about half of
the sequences of an average genome [25,26]. Thus, the devel-
opment of new methods that increase the accuracy and use-
fulness of models from widely used computational
approaches could prove very useful to thousands of research-
ers worldwide.
Materials and methods
Non-redundant set of protein structures
The redundancy in the PDB database (June 2005) was fil-
tered to a representative list such that the MAMMOTH align-
ment [27] of any two chains in the list fails at least one of the
following four cut-offs: a minimum of 90% sequence identity;
a minimum of 90% of Cα atoms aligned within 4 Å; a maxi-
mum of 1 Å Cα root mean square deviation; and a maximum
of a 50 residue difference in length. Each non-redundant
chain represents all other PDB chains in the initial list that
pass the cut-offs listed above for all pairwise comparisons
within the group; where possible, the representative was
picked by maximizing its resolution. Additionally, obsolete
PDB entries as well as entries with missing atoms were
removed from the initial set, resulting in a final list of 22,732
protein chains. To assess the impact of the PDB redundancy
on the accuracy of the EvPs in model assessment, the final
representative set of chains was further clustered by varying
the sequence identity and structure similarity cut-offs (Table
S1 in Additional data file 1).
Multiple sequence alignments
A MSA for each of the 22,732 non-redundant PDB chains was
built using PSI-BLAST (version 2.2.10) [28] to search against
the NCBI nr database (June 2005). The search was per-
formed without filtering out compositionally biased seg-
ments, running for up to 5 iterations, and including up to
100,000 sequence hits with an e-value smaller than 5 × 10
-4
.
All other PSI-BLAST parameters were set to their default val-
ues. Removing those protein chains that aligned with less
than 20%, 40% or 60% sequence identity to the query protein
further filtered the MSAs. Finally, all filtered MSAs with 50 or
more sequences were used for deriving EvPs (Table S1 in
Additional data file 1).
Sequence weighting
A position-based sequence weighting that assigns low weights
to over-represented sequences and high weights to unique
sequences was used to compensate for non-uniform distribu-
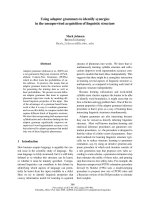
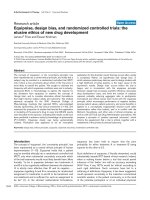
EvP accuracy tested against other knowledge-based potentialsFigure 3
EvP accuracy tested against other knowledge-based potentials. ROC
curves for the tested methods: EvP (CLUSTER), consensus EvP potential
(CON), representative potential (REP), Prosa potential (Prosa II), and
DFIRE potential (DFIRE Cβ). The EvP (CLUSTER) set in this figure was
generated using the CLS_90-90 clustering cut-offs and the MSA_20 MSA
filtering cut-off.
False positive rate
True positive rate
0.0 0.1 0.2 0.3 0.4
0.6
0.7
0.8
0.9
1.0
EvP (CLUSTER)
REP
Prosa II
DFIRE Cb
CON
Genome Biology 2008, 9:R68
Genome Biology 2008, Volume 9, Issue 4, Article R68 Panjkovich et al. R68.8
tion of the homologous protein sequences in a MSA [29]. The
sequence weights W
j
were calculated as:
where r
i
is the number of different residue types at position i,
and n
i,j
is the frequency of occurrence of the residue type in
position i and sequence j with respect to all residues in posi-
tion i.
Derivation of knowledge-based potentials
Two different types of knowledge-based potentials were
derived in this work: a representative distance-dependent
potential (REP), used as a baseline to benchmark the impact
of our new approach, and a series of structure specific dis-
tance-dependent potentials here termed EvPs. The unique
difference between the REP and the EvP potentials was the
input structural space selected for their derivation as well as
the use of sequence information. On the one hand, the REP
potential was calculated from a set of 22,732 non-redundant
protein structures (Figure 4a) following the approach com-
monly used to derive distance-dependent potentials [7,19,30-
35]. On the other hand, for 20,008 of the 22,732 non-redun-
dant protein structures (that is, structures with more than 50
homologous sequences in their MSA), an EvP was calculated
using the sequence variability in a set of homologous
sequences to the selected structure (Figure 4b). Each EvP was
derived by virtually threading all homologous sequences in
the MSA into the selected structure, which was used as a
guide for the replacement of the amino-acid type at each posi-
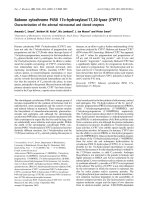
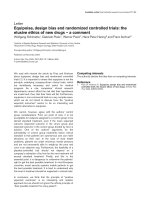
EvP and REP derivation protocolsFigure 4
EvP and REP derivation protocols. (a) The REP potential was built in a three-step process to: step 1, generate a non-redundant set of protein structures
from the PDB database; step 2, calculate all residue-residue distance frequencies within each of the representative chains from step 1; and step 3, derive a
knowledge-based potential using the inverse Boltzmann law to transform the raw frequencies into pseudo-energy terms. (b) The EvPs were built in a six-
step process to: step 1, generate a non-redundant set of protein structures from the PDB database; step 2, select each of the representative chains as
query structures; step 3, calculate a MSA using the PSI-BLAST program; step 4, thread all homologous sequences into the query structure using the
sequence-based alignment from the previous step; step 5, calculate all residue-residue distance frequencies; and step 6, derive a knowledge-based potential
using the inverse Boltzmann law to transform the raw frequencies into pseudo-energy terms.
EVOLUTIONARY POTENTIAL
(EvP)
PDB
1,0
PDB
(a) (b)
1
6
5
4
3
2
1
2
3
KNOWN PROTEIN
STRUCTURES
KNOWN PROTEIN
STRUCTURES
STRUCTURAL
CLUSTERS
STRUCTURAL
CLUSTERS
NON REDUNDANT SET
OF PROTEIN STRUCTURES
0,0
0,2
0,4
0,6
0,8
Residue distances
Frequency
0,0
0,2
0,4
0,6
0,8
1,0
Residue distances
Frequency
INVERSE
BOLTZMANN’s LAW
INVERSE
BOLTZMANN’s LAW
FOR EACH CLUSTER
PSI-BLAST MSA
MODELS FOR ALL
THREADED SEQUENCES
REPRESENTATIVE POTENTIAL
(REP)
W
r
i
n
ij
j
i
=
⋅
∑
1
,
Genome Biology 2008, Volume 9, Issue 4, Article R68 Panjkovich et al. R68.9
Genome Biology 2008, 9:R68
tion. Thus, one can say that the 20,008 EvPs encode the
sequence variation observed in the MSA for each of the non-
redundant structures. Briefly, the threading approach imple-
mented for deriving EvPs followed three steps: first, collect all
pairwise alignments between the selected structure and its
homologous sequences in the MSA; second, using each pair-
wise alignment as a guide, replace the amino-acid type in the
selected structure by the one in the homologous sequence;
and third, for a gapped position keep the original residue in
the selected structure. Two variations of this protocol were
also tested, which included the removal of residues in the
structure aligned to a gap and the renumbering of the tem-
plate residues (that is, affecting the sequence separation value
of the statistical potential). The tested protocols showed no
statistical differences between the resulting EvPs (Table S6 in
Additional data file 1). The counting of residue-residue inter-
actions for deriving an EvP was proportional to the sequence
weight that accounts for redundancy within the MSA.
In contrast to the REP, where the non-redundant set of pro-
tein structures constituted its training set, there was not a sin-
gle and unique training set for deriving an EvP. The training
sets used in EvPs were the actual multiple sequence align-
ments specific for each selected structure.
In addition to the REP and the EvPs, a single consensus
potential (CON) was derived using the sum of observed
interaction frequencies from each of the 20,008 individual
EvPs. Thus, the CON potential encodes the structural space
encompassed by the non-redundant set of structures as well
as the sequence space occupied by their homologous
sequences.
All potentials derived in this work were calculated using our
previously optimized parameters for model assessment [7].
Briefly, the potentials used Cα and Cβ atoms as interaction
centers, distinguished between all 20 standard residue types,
had a maximal distance range of 15 Å distributed in 30 bins of
0.5 Å each, and accounted for the sequence separation of the
interacting atom pairs. Local interactions were considered
independently using sequence separations of 2, 3, 4, 5, 6, 7
and 8 residues and non-local interactions were considered by
grouping into a single term the interactions with sequence
separations larger than or equal to 9 residues.
Z-scores
Energy Z-scores were calculated based on the protein model
energy, the mean and the standard deviation of the knowl-
edge-based potential energy of 1,000 random sequences with
the same amino acid composition and structure of the protein
model, as previously described [7].
Model assessment protocol
An EvP was calculated for each of the non-redundant chains
in the PDB and represented a given set of similar structures.
Thus, the selection of an EvP for assessing the accuracy of a
given model could have an impact on the final accuracy of our
method. Several protocols were implemented and tested to
assess such an impact.
Template-based selection
The template structure used to build the model was obtained
from the corresponding sequence-structure alignment used
during the modeling. Then, the EvP representing the tem-
plate's structural cluster was used to evaluate the accuracy of
the model.
Template-free selection
In order to assess the impact of the EvP selection for tem-
plate-free models, the PSI-BLAST and BLAST algorithms
were used with default values to detect the closest match
between the sequence of the model and our database of EvPs.
Random selection
The so-called random potential (RND) was calculated by ran-
domly selecting one of the 20,008 EvPs to assess the accuracy
of a given model.
To avoid biased results, the EvP derived for the target struc-
ture was removed prior to EVP selection in all three protocols.
However, it is important to note that it is not certain, even
conceptually, that rigorous testing of a method should not
rely on structures similar or identical to those from which the
potentials were derived. In practice, statistical potentials are
to be used in model assessment of comparative models that,
by construction, are similar to known protein structures.
Therefore, all of the known protein structures are legitimate
sources for deriving any of the statistical potentials used in
practical model assessment, including those known struc-
tures that happen to be related to the assessed model.
Test set of comparative models
The evaluation of the EvPs for model assessment was based
on an initial set of 9,645 structural models divided into 3,375
correct and 6,270 incorrect models [7,22]. A correct model
was defined as a model for which at least 30% of the Cα atoms
superimposed within 3.5 Å with those of the real structure,
and thus is based on proper fold assignment and a relatively
accurate sequence/structure alignment. Incorrect models
(that is, superimposing less than 15% of the Cα atoms within
3.5 Å) were built using a wrong fold or based on the correct
fold, but containing a large fraction of misalignments. Thus,
the test set of protein structure models, which was the result
of a large-scale comparative modeling of the complete PDB
[22], represented the known protein structural space. This set
of comparative models has been previously and extensively
used to benchmark methods of model assessment
[7,17,22,36,37].
To be able to fairly compare all potentials, the initial test set
was reduced to 1,877 correct and 2,567 incorrect models,
which corresponded to those for which an EvP could be
Genome Biology 2008, 9:R68
Genome Biology 2008, Volume 9, Issue 4, Article R68 Panjkovich et al. R68.10
derived for all clustering cut-offs (Table S1 in Additional data
file 1). Since an EvP cannot be reliably derived for represent-
ative structures with less than 50 homologous sequences [7],
a large fraction of models did not have a derived EvP for their
corresponding template structures in the CLS-90-90_MSA-
60 cluster. However, an EvP at CLS-90-90 and MSA-20,
which corresponds to the most accurate knowledge-based
potential (Results), could be calculated for 96.4% (3,253) and
94.8% (5,942) of correct and incorrect models in the test set,
respectively.
All potential scores, the models for the two datasets used in
this work as well as the EvPs are available for download at
[38].
Benchmarking criteria
The accuracy of the knowledge-based potentials was evalu-
ated by means of the maximal accuracy (ACC) and the AUC,
which were calculated from a receiver operating characteris-
tic (ROC) curve [39] using correct models as positive
instances and incorrect models as negative instances. A ROC
curve is obtained by plotting the FPR (that is, fraction of
incorrect models assessed as correct) against the correspond-
ing TPR (that is, fraction of correct models assessed as cor-
rect) for all possible cut-offs on the energy Z-score. The AUC,
a threshold independent measure, is considered a robust
indicator of a classifier quality given its independence from
the selected threshold and its correlation with the probability
of the classifier error [39]. The optimal classification
threshold leading to the maximal ACC is also reported for
each tested potential.
Other benchmarked methods
Two widely used knowledge-based potentials for error detec-
tion in protein structure models were also evaluated to
provide an additional and objective reference frame for eval-
uating the accuracy of the EvPs. First, the Prosa II program
[4,20,21], derived from a set of non-redundant structures,
calculates an energy score and a Z-score for an input model.
Second, the DFIRE program [19], derived by using a distance-
scaled finite ideal-gas as reference state, calculates an energy
score for a model. The final DFIRE Z-scores were calculated
using the procedure described above. Both programs, Prosa II
and DFIRE, were locally run using their respective default
parameters.
Statistical significance of the differences between the
evaluated potentials
The statistical significance of the observed differences
between two potentials used as binary classifiers was evalu-
ated by a non-parametric test that accounts for the correla-
tion of the ROC curves [40]. This test takes advantage of the
equality between the Mann-Whitney U-statistic and the AUC
when computed by the trapezoidal rule for comparing two
distributions. A chi-square statistic computes the significance
(p-value) of the difference between the AUC measured for the
two classifiers. The results corresponding to the statistical
comparisons are reported in the Additional data file 1 (Tables
S1, and S3-S5).
Abbreviations
ACC, accuracy; AUC, area under the curve; CON, consensus
EvP potential; EvP, evolutionary potential; FPR, false posi-
tive rate; MSA, multiple sequence alignment; OC, optimal
cut-off; REP, representative potential; ROC, receiver operat-
ing characteristic; TPR, true positive rate;.
Authors' contributions
MAM-R and FM conceived the idea and supervised the
project; AP, FM and MAM-R planned and performed the
research as well as analyzed its results; all authors wrote and
approved the final manuscript.
Additional data files
The following additional data are available with the online
version of this paper. Additional file 1 contains Tables S1-S6.
Additional data file 1Tables S1-S6Tables S1, S3, S4 and S5 show the results from a statistical analysis of the accuracy differences between the tested statistical potentials. Table S2 shows information about the tested EvPs. Table S6 shows the results of EvPs upon changes in the threading parameters.Click here for file
Acknowledgements
We are very grateful to Andrej Sali and MS Madhusudhan for helpful discus-
sions as well as to the Sali Lab for access to their computational resources.
MAM-R acknowledges the support from a Spanish Ministerio de Educación
y Ciencia grant (BIO2007/66670). AP and FM acknowledge the support
from a Chilean FONDECYT grant (1051112).
References
1. Marti-Renom MA, Stuart AC, Fiser A, Sanchez R, Melo F, Sali A:
Comparative protein structure modeling of genes and
genomes. Annu Rev Biophys Biomol Struct 2000, 29:291-325.
2. Marti-Renom MA, Madhusudhan MS, Sali A: Alignment of protein
sequences by their profiles. Protein Sci 2004, 13:1071-1087.
3. Mackerell AD Jr: Empirical force fields for biological macro-
molecules: overview and issues. J Comput Chem 2004,
25:1584-1604.
4. Sippl MJ: Boltzmann's principle, knowledge-based mean fields
and protein folding. An approach to the computational
determination of protein structures. J Comput Aided Mol Des
1993, 7:473-501.
5. Miyazawa S, Jernigan RL: Residue-residue potentials with a favo-
rable contact pair term and an unfavorable high packing den-
sity term, for simulation and threading. J Mol Biol 1996,
256:623-644.
6. Domingues FS, Koppensteiner WA, Jaritz M, Prlic A, Weichenberger
C, Wiederstein M, Floeckner H, Lackner P, Sippl MJ: Sustained per-
formance of knowledge-based potentials in fold recognition.
Proteins 1999:112-120.
7. Melo F, Sanchez R, Sali A: Statistical potentials for fold
assessment. Protein Sci 2002, 11:430-448.
8. McGuffin LJ, Jones DT: Improvement of the GenTHREADER
method for genomic fold recognition. Bioinformatics 2003,
19:874-881.
9. Melo F, Feytmans E: Assessing protein structures with a non-
local atomic interaction energy. J Mol Biol 1998, 277:1141-1152.
10. Zhou H, Zhou Y: Distance-scaled, finite ideal-gas reference
state improves structure-derived potentials of mean force
for structure selection and stability prediction. Protein Sci
2002, 11:2714-2726.
11. Tsai J, Bonneau R, Morozov AV, Kuhlman B, Rohl CA, Baker D: An
improved protein decoy set for testing energy functions for
Genome Biology 2008, Volume 9, Issue 4, Article R68 Panjkovich et al. R68.11
Genome Biology 2008, 9:R68
protein structure prediction. Proteins 2003, 53:76-87.
12. Zhu J, Zhu Q, Shi Y, Liu H: How well can we predict native con-
tacts in proteins based on decoy structures and their
energies? Proteins 2003, 52:598-608.
13. Lu H, Skolnick J: A distance-dependent atomic knowledge-
based potential for improved protein structure selection.
Proteins 2001, 44:223-232.
14. Wallner B, Elofsson A: Can correct protein models be
identified? Protein Sci 2003, 12:1073-1086.
15. Park B, Levitt M: Energy functions that discriminate X-ray and
near native folds from well-constructed decoys. J Mol Biol
1996, 258:367-392.
16. Park BH, Huang ES, Levitt M: Factors affecting the ability of
energy functions to discriminate correct from incorrect
folds. J Mol Biol 1997, 266:831-846.
17. Melo F, Sali A: Fold assessment for comparative protein struc-
ture modeling. Protein Sci 2007, 16:2412-2426.
18. Melo F, Sanchez R, Sali A: Statistical potentials for fold
assessment. Protein Sci 2002, 11:430-448.
19. Zhou H, Zhou Y: Distance-scaled, finite ideal-gas reference
state improves structure-derived potentials of mean force
for structure selection and stability prediction. Protein Sci
2002, 11:2714-2726.
20. Sippl MJ, Weitckus S: Detection of native-like models for amino
acid sequences of unknown three-dimensional structure in a
data base of known protein conformations. Proteins 1992,
13:258-271.
21. Sippl MJ: Knowledge-based potentials for proteins. Curr Opin
Struct Biol 1995, 5:229-235.
22. Sanchez R, Sali A: Large-scale protein structure modeling of
the Saccharomyces cerevisiae genome. Proc Natl Acad Sci USA
1998, 95:13597-13602.
23. Plaxco KW, Larson S, Ruczinski I, Riddle DS, Thayer EC, Buchwitz B,
Davidson AR, Baker D: Evolutionary conservation in protein
folding kinetics. J Mol Biol 2000, 298:303-312.
24. Zarrine-Afsar A, Larson SM, Davidson AR: The family feud: do
proteins with similar structures fold via the same pathway?
Curr Opin Struct Biol 2005, 15:42-49.
25. Pieper U, Eswar N, Davis FP, Braberg H, Madhusudhan MS, Rossi A,
Marti-Renom M, Karchin R, Webb BM, Eramian D, Shen MY, Kelly L,
Melo F, Sali A: MODBASE: a database of annotated compara-
tive protein structure models and associated resources.
Nucleic Acids Res 2006, 34:D291-D295.
26. Kopp J, Schwede T: The SWISS-MODEL Repository: new fea-
tures and functionalities. Nucleic Acids Res 2006, 34:D315-318.
27. Ortiz AR, Strauss CE, Olmea O: MAMMOTH (matching molec-
ular models obtained from theory): an automated method
for model comparison. Protein Sci 2002, 11:2606-2621.
28. Altschul SF, Madden TL, Schaffer AA, Zhang J, Zhang Z, Miller W, Lip-
man DJ: Gapped BLAST and PSI-BLAST: a new generation of
protein database search programs. Nucleic Acids Res 1997,
25:3389-3402.
29. Henikoff S, Henikoff JG: Position-based sequence weights. J Mol
Biol 1994, 243:574-578.
30. Sippl MJ: Calculation of conformational ensembles from
potentials of mean force. An approach to the knowledge-
based prediction of local structures in globular proteins. J
Mol Biol 1990, 213:859-883.
31. Jones DT: GenTHREADER: an efficient and reliable protein
fold recognition method for genomic sequences. J Mol Biol
1999, 287:797-815.
32. Samudrala R, Moult J: An all-atom distance-dependent condi-
tional probability discriminatory function for protein struc-
ture prediction. J Mol Biol 1998, 275:895-916.
33. Kihara D, Lu H, Kolinski A, Skolnick J: TOUCHSTONE: an ab ini-
tio protein structure prediction method that uses threading-
based tertiary restraints. Proc Natl Acad Sci USA 2001,
98:10125-10130.
34. Melo F, Feytmans E: Novel knowledge-based mean force poten-
tial at atomic level. J Mol Biol 1997, 267:207-222.
35. Shen MY, Sali A: Statistical potential for assessment and pre-
diction of protein structures. Protein Sci 2006, 15:2507-2524.
36. Ferrada E, Melo F: Nonbonded terms extrapolated from
nonlocal knowledge-based energy functions improve error
detection in near-native protein structure models. Protein Sci
2007, 16:1410-1421.
37. Melo F, Marti-Renom MA: Accuracy of sequence alignment and
fold assessment using reduced amino acid alphabets. Proteins
2006, 63:986-995.
38. Bioinformatics datasets from the Structural Genomics Unit
at CIPF [ />39. Fawcett T: ROC Graphs: Notes and Practical Considerations
for Data Mining Researchers. HP Labs Tech Report HPL-
2003-4 2003. [ />2003-4.pdf].
40. DeLong ER, DeLong DM, Clarke-Pearson DL: Comparing the
areas under two or more correlated receiver operating
characteristic curves: a nonparametric approach. Biometrics
1988, 44:837-845.