Báo cáo y học: "Perceiving molecular evolution processes in Escherichia coli by comprehensive metabolite and gene expression profiling" doc
Bạn đang xem bản rút gọn của tài liệu. Xem và tải ngay bản đầy đủ của tài liệu tại đây (3.86 MB, 18 trang )
Genome Biology 2008, 9:R72
Open Access
2008Vijayendranet al.Volume 9, Issue 4, Article R72
Research
Perceiving molecular evolution processes in Escherichia coli by
comprehensive metabolite and gene expression profiling
Chandran Vijayendran
*†
, Aiko Barsch
‡
, Karl Friehs
†
, Karsten Niehaus
‡
,
Anke Becker
‡
and Erwin Flaschel
†
Addresses:
*
International NRW Graduate School in Bioinformatics and Genome Research, Bielefeld University, D-33594 Bielefeld, Germany.
†
Fermentation Engineering Group, Bielefeld University, D-33594 Bielefeld, Germany.
‡
Faculty of Biology, Bielefeld University, D-33594
Bielefeld, Germany.
Correspondence: Chandran Vijayendran. Email:
© 2008 Vijayendran et al.; licensee BioMed Central Ltd.
This is an open access article distributed under the terms of the Creative Commons Attribution License ( which
permits unrestricted use, distribution, and reproduction in any medium, provided the original work is properly cited.
Bacterial transcript and metabolite evolution<p>Transcript and metabolite abundance changes were analyzed in evolved and ancestor strains of <it>Escherichia coli</it> in three dif-ferent evolutionary conditions</p>
Abstract
Background: Evolutionary changes that are due to different environmental conditions can be
examined based on the various molecular aspects that constitute a cell, namely transcript, protein,
or metabolite abundance. We analyzed changes in transcript and metabolite abundance in evolved
and ancestor strains in three different evolutionary conditions - excess nutrient adaptation,
prolonged stationary phase adaptation, and adaptation because of environmental shift - in two
different strains of bacterium Escherichia coli K-12 (MG1655 and DH10B).
Results: Metabolite profiling of 84 identified metabolites revealed that most of the metabolites
involved in the tricarboxylic acid cycle and nucleotide metabolism were altered in both of the
excess nutrient evolved lines. Gene expression profiling using whole genome microarray with 4,288
open reading frames revealed over-representation of the transport functional category in all
evolved lines. Excess nutrient adapted lines were found to exhibit greater degrees of positive
correlation, indicating parallelism between ancestor and evolved lines, when compared with
prolonged stationary phase adapted lines. Gene-metabolite correlation network analysis revealed
over-representation of membrane-associated functional categories. Proteome analysis revealed the
major role played by outer membrane proteins in adaptive evolution. GltB, LamB and YaeT
proteins in excess nutrient lines, and FepA, CirA, OmpC and OmpA in prolonged stationary phase
lines were found to be differentially over-expressed.
Conclusion: In summary, we report the vital involvement of energy metabolism and membrane-
associated functional categories in all of the evolutionary conditions examined in this study within
the context of transcript, outer membrane protein, and metabolite levels. These initial data
obtained may help to enhance our understanding of the evolutionary process from a systems
biology perspective.
Published: 10 April 2008
Genome Biology 2008, 9:R72 (doi:10.1186/gb-2008-9-4-r72)
Received: 10 September 2007
Revised: 25 October 2007
Accepted: 10 April 2008
The electronic version of this article is the complete one and can be
found online at />Genome Biology 2008, 9:R72
Genome Biology 2008, Volume 9, Issue 4, Article R72 Vijayendran et al. R72.2
Background
Most micro-organisms grow in environments that are not
favorable for their growth. The level of nutrients available to
them is rarely optimal. These microbes must adapt to envi-
ronmental conditions that consist of excess, suboptimal (lim-
iting) or fluctuating levels of nutrients, or famine. Evolution
can be studied by observing its processes and consequences in
the laboratory, specifically by culturing a micro-organism in
varying nutrient environments [1-4]. Extensively studied
microbial evolutionary processes include nutrient-limited
adaptive evolution [5-7] and famine-induced prolonged sta-
tionary phase evolution [8-10]. During prolonged carbon
starvation, micro-organisms can undergo rapid evolution,
with mutants exhibiting a 'growth advantage in stationary
phase' (GASP) phenotype [2]. These mutants, harboring a
selective advantage, out-compete their siblings and take over
the culture through their progeny [11-13]. Adaptive evolution
of micro-organisms is a process in which specific mutations
result in phenotypic attributes that are responsible for fitness
in a particular selective environment [1]. Laboratory studies
conducted under these evolutionary conditions can address
fundamental questions regarding adaptation processes and
selection pressures, thereby explaining modes of evolution.
In this study we used Escherichia coli K-12 strains (MG1655
and DH10B) subjected to the following processes: a serial
passage system (excess nutrient adaptive evolution studies),
constant batch culture (prolonged stationary phase evolution
studies), and culture with nutrient alteration after adaptation
to a particular nutrient (examining pleiotropic effects due to
environmental shift). During adverse conditions, micro-
organisms are known to exploit limited resources more
quickly and are observed to assimilate various metabolites.
Some of these residual metabolites comprise an alternative
resource that the organism can metabolize [2]. Continual
assimilation of metabolites and the various compounds
metabolized by the organism offer a specific niche that allows
the organism to evolve with genetic capacity to utilize those
assimilated metabolites [2]. Hence, a detailed metabolite
analysis of these evolved populations would enhance our
understanding of these evolutionary processes. Along with
data generated from transcriptomics approaches, metabo-
lomics data will be vital in obtaining a global view of an organ-
ism at a particular time point, during which metabolite
behavior closely reflects the actual cellular environment and
the observed phenotype of that organism.
We applied metabolome and gene expression profiling
approaches to elucidate excess nutrient adaptive evolution,
prolonged stationary phase evolution, and pleiotropic effects
due to environmental shift in two strains of differing geno-
type. To eliminate the possibility of the strain-dependent phe-
nomenon of evolution and to examine the parallelism of the
laboratory evolution process, we examined in two strains the
evolutionary processes referred to above. Hence, the groups
in which we compared the metabolite and gene expression
profiles were as follows (Table 1): MG and DH (MG1655 and
DH10B E. coli strains grown in glucose, respectively); MGGal
and DHGal (MG1655 and DH10B grown in galactose);
MGAdp and DHAdp (MG1655 and DH10B adapted about
1,000 generations in glucose); MGAdpGal and DHAdpGal
(MGAdp and DHAdp [the glucose evolved strains] grown in
galactose); and MGStat and DHStat (MG1655 and DH10B
grown in prolonged stationary phase; 37 days).
In this study we developed a picture of laboratory molecular
evolutionary processes in two different strains by integrating
multidimensional metabolome and gene expression data, in
order to identify metabolites and genes that are vital to the
evolutionary process.
Results
The Adp line cultures (MGAdp and DHAdp) were maintained
in prolonged exponential growth phase by daily passage into
fresh medium for about 1,000 generations, undergoing many
Table 1
Strains and their evolved conditions
Strain abbreviations Evolved condition
MG MG1655 grown in glucose (ancestor)
DH DH10B grown in glucose (ancestor)
MGGal MG1655 grown in galactose (ancestor)
DHGal DH10B grown in galactose (ancestor)
MGAdp MG1655 adapted about 1,000 generations in glucose (evolved)
DHAdp DH10B adapted about 1,000 generations in glucose (evolved)
MGAdpGal MGAdp (glucose evolved strains) grown in galactose (evolved)
DHAdpGal DHAdp (glucose evolved strains) grown in galactose (evolved)
MGStat MG1655 grown in prolonged stationary phase (37 days; evolved)
DHStat DH10B grown in prolonged stationary phase (37 days; evolved)
Genome Biology 2008, Volume 9, Issue 4, Article R72 Vijayendran et al. R72.3
Genome Biology 2008, 9:R72
rounds of exponential phase growth. The Stat line cultures
(MGStat and DHStat) were maintained in constant batch
culture for 37 days, during which no nutrients were added
after the initial inoculation and no cells were removed (unlike
the preceding setup). For the AdpGal line cultures (MGAdp-
Gal and DHAdpGal), Adp lines (glucose adapted) were grown
in medium containing galactose as carbon source, thus creat-
ing an environmental shift for the cells with respect to the
standard nutrient source. During this period of adaptation,
both Adp lines (evolved) exhibited increased fitness in their
growth, whereas Stat lines (evolved) exhibited growth behav-
ior similar to that of their ancestors. The samples of MG, DH,
MGGal, DHGal, MGAdp, DHAdp, MGAdpGal, DHAdpGal,
MGStat, and DHStat lines grown in the respective carbon
sources (Table 1) were harvested during the mid-exponential
phase of growth for both metabolome and transcriptome
analysis.
In the metabolome analysis, from about 200 peaks in each
chromatogram about 100 metabolites were identified by gas
chromatography-mass spectrometry. In the transcriptome
analysis a whole genome microarray consisting of 4,288 open
reading frames of Escherichia coli K-12 was used. To examine
the multivariate measures of variability of the metabolite and
gene expression profiles for the obtained data, and for clus-
tering the biological samples, we applied principal compo-
nents analysis (PCA). In order to identify parallel metabolite
accumulation and gene expression, we applied pair-wise cor-
relation plot analysis. To examine the extent of parallelism
among the evolved lines, gene-metabolite correlation net-
works were constructed and their topologic properties were
studied. By mapping the correlation networks to Gene Ontol-
ogy (GO) functional annotations, the functional relevance of
the networks was determined. Subsequently, the functional
modules that were statistically significantly over-represented
in respective evolution processes were identified.
Metabolome profiling
Metabolome profiling has frequently been applied to obtain
quantitative information on metabolites for studies on muta-
tional [14] or environmental effects [15], but not in an evolu-
tionary context. Here, for our evolutionary studies, we used
an approach that combined metabolomics and transcriptom-
ics that offers whole genome coverage. In total, 84 metabo-
lites of known chemical structure were quantified in every
chromatogram (see Additional data file 1). The full datasets
from the metabolite profiling study are presented in an over-
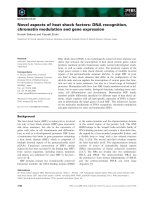
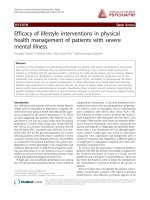
lay heat map (Figure 1). This map shows the averaged abso-
lute values of all indentified metabolites of the samples
analyzed. In most cases the levels of metabolites are signifi-
cantly changed in evolved lines, and their directional behav-
ior is more or less constant in both the ancestral strains and
in their evolved strains (Figure 2).
In the comparison between MGAdp and DHAdp strains, out
of 111 metabolites 50% (55 metabolites) and 55% (61 metabo-
lites) of them had score d
i
≥ 1 or ≤ -1 (significance analysis of
microarrays [SAM], T statistic value) [16], of which 27% (31)
of metabolites were common to both strains. The MGAdpGal
and DHAdpGal strains were observed to have 39% (43
metabolites) and 33% (37 metabolites), respectively, where
13% (10) of the metabolites were common to both of these
strains. Likewise, MGStat and DHStat exhibited differences
in 48% (53 metabolites) and 37% (41 metabolites) of the
cases, and 20% (19) of metabolites were common in both
strains (Table 2; also see Additional data file 2).
Those metabolites that exhibited differences between ances-
tral and evolved strains fell into groups of metabolites
involved in tricarboxylic acid (TCA) cycle, nucleotide metab-
olism, amino acids and their derivatives, and polyamine bio-
synthesis (Figure 1). For example, metabolites that are
involved in the nucleotide pathway were significantly differ-
ent between both ancestral and evolved strains (MG/MGAdp:
P= 0.007; DH/DHAdp: P = 0.038 [Wilcoxon rank sum test;
Benjamini-Hochberg corrected; a false discovery rate-con-
trolled P-value cutoff of ≤ 0.05]). Nucleic acids - adenine,
thymine and uracil - along with ribose-5-phosphate and oro-
tate (orotic acid) metabolite levels significantly differed in
both of the Adp evolved strains (Figure 2c). Orotate is an
intermediate in de novo biosynthesis of pyrimidine ribonu-
cleotides, levels of which were high in ancestor strains, which
was not the case for other metabolites that were not interme-
diates in this process (Figure 2a, b, c). Likewise, levels of
metabolites involved in the TCA cycle were significantly dif-
ferent for both ancestral and evolved strains (MG/MGAdp: P
= 3.70 × e
-06
; DH/DHAdp: P = 0.026 [Wilcoxon rank sum
test; Benjamini-Hochberg corrected; a false discovery rate-
controlled P-value cutoff of ≤ 0.05]). An overview of the TCA
cycle and the diversion of its key intermediates reveal clear
differences in metabolite levels among the Adp evolved
strains and their ancestors in both strains (Figure 3). Because
the TCA cycle is the first step in generating precursors for var-
ious biosynthesetic processes and is among the main energy-
producing pathways in a cell, changes in these metabolite lev-
els can be expected to play a vital role in the adaptive evolu-
tion of these evolved strains, which exhibited increased
fitness in growth compared with their ancestor strains.
Gene expression profiling
Several studies have used gene expression profiling to study
molecular evolution, but these studies were confined to a sin-
gle type of evolutionary process and were focused on a single
molecular aspect that characterizes a cell (transcript abun-
dance) [17-20]. In our study we focused on three evolutionary
conditions in two strains and two molecular aspects of a cell
(transcript and metabolite abundance). This approach
allowed us to integrate metabolome and transcriptome data-
sets to elucidate the process of adaptive evolution under lab-
oratory conditions.
Genome Biology 2008, 9:R72
Genome Biology 2008, Volume 9, Issue 4, Article R72 Vijayendran et al. R72.4
Overlay heat map of the metabolite profilesFigure 1
Overlay heat map of the metabolite profiles. Logarithmically transformed (to base 2) averaged absolute values were used to plot the heat map. Red or blue
color indicates that the metabolite content is decreased or increased, respectively. For each sample, gas chromatography/mass spectrometry was used to
quantify 84 metabolites (nonredundant), categorized into amino acids and their derivatives, polyamines, metabolites involved in nucleotide related
pathways, tricarboxylic acid (TCA) cycle, organic acids, phosphates, and sugar and polyols. The m/z values given for each metabolite in parentheses are the
selective ions used for quantification. Highlighted black boxes indicate significant changes in the metabolite level in the TCA cycle and the nucleotide
related pathways of the evolved lines. The internal standard ribitol metabolite level is also highlighted, which is shown as control.
Alanine (116)
Arginine (256)
Asparagine (216)
b-Alanine (248)
Cystathionine (128)
Glutamine (155)
Glycine (174)
Isoleucin (158)
L,L-Cystathionine (218)
L-Aspartate (232)
L-Cysteine (220)
Leucine (158)
L-Homocystein (234)
L-Homoserine (218)
Lysine (156)
Methionine (176)
N-Acetyl-Aspartate (274)
N-Acetyl-L-Serine (261)
o-acetyl-L-Homoserine (202)
o-acetyl-L-Serine (132)
Phenylalanine (192)
Proline (142)
Serine (204)
Threonine (101)
Tryptophan (202)
Tyrosine (218)
Valine (144)
4-Aminobutyrate (174)
5-Methyl-thioadenosine (236)
Ornithine (142)
Putrescine (142,174)
Spermidine (144)
Adenine (264)
Adenosine (236)
Glutamate (230,246)
Oroticacid (254)
Ribose (217)
Ribose-5-P (315,299)
Thymine (255)
Uracil (255,241)
a-Ketoglutarate (198)
Citrate (257)
Fumarate (245)
Isocitrate (245,319)
Malate (245,307)
Pyruvate (174)
Succinate (247,409)
2-Aminoadipate (260)
2-Hydroxyglutarate (203,247)
2-Isopropylmalate (275)
2-Ketoisocaproate (216)
2-Methylcitrate (287)
2-Methylisocitrate (259)
Gluconate (333)
Glucuronicacid (333)
Glycerate (189,192)
Lactate (191)
Maleicacid (245)
Panthotenic acid (201)
Salicylicacid (267)
Shikimate (204)
a-Glycerophosphate (357)
DHAP (400)
Erythrose-4-P (357)
Fructose-6-P (315)
Gluconate-6-P (387)
Glucose-6-P (387)
Glycerate-2-P (299,315,459)
Glycerate-3-P (227,299,459)
Myo-Inositol-P (318)
PEP (369)
Phosphate19.28 (299)
Arabinose (217)
Fructose (307)
Glucose (319)
myo-Inositol (305)
Pinitol (260)
Sucrose (361)
Trehalose (361)
Diaminopimelate (200,272)
Ribitol
Spermine (144)
Unknown14.80 (228)
Unknown32.96 (361)
Urea (189)
Nucleotide pathway
TCA cycle
MG
DH
MGGal
DHGal
MGAdp
DHAdp
MGAdpGal
DHAdpGal
MGStat
DHStat
MG
DH
MGGal
DHGal
MGAdp
DHAdp
MGAdpGal
DHAdpGal
MGStat
DHStat
Organic acids
Phosphates
Sugars and polyols
Others
Amino acids and its derivatives
Polyamines
Genome Biology 2008, Volume 9, Issue 4, Article R72 Vijayendran et al. R72.5
Genome Biology 2008, 9:R72
Using the whole genome microarray, consisting of 4,288
open reading frames, we compared expression levels of the
transcripts in all of the evolved conditions. The comparison of
MG/MGAdp and DH/DHAdp lines among 4,159 genes
revealed that 15% (633 genes) and 19% (814 genes), respec-
tively, had altered expression levels (score d
i
≥ 1 or ≤ -1; SAM,
T-statistic value [16]). Among these, 18% (263) of the genes
were common to both strains. In the MGGal/MGAdpGal ver-
sus DHGal/DHAdpGal comparison of 4,126 genes, we
observed there to be a 5% (206 genes) and 16% (674 genes)
change, respectively, and 4% (35 genes) of these genes were
common to both strains. Likewise, on comparing MG/
MGStat versus DH/DHStat, we observed that 14% (569
genes) and 20% (825 genes) of the 4,156 genes had altered
expression levels, of which 9% (120 genes) were common to
both strains (Table 3; also see Additional data file 3). In all
comparisons, statistically significant functional categories
(with P ≤ 0.05 [Wilcoxon rank sum test]) that did exhibit dif-
ferences between ancestral and the evolved strains fell into
broad groups of genes that are involved in transport, biosyn-
thesis, and catabolism (Figure 4). The gene expression
changes associated with these main and broad functional cat-
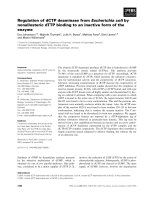
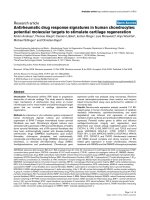
Typical examples of metabolite differential levels among the ancestral and evolved linesFigure 2
Typical examples of metabolite differential levels among the ancestral and evolved lines. (a) Sections of chromatograms showing orotate or orotic acid
(denoted by an arrow) abundance among all the lines. (b) Mass spectrum of orotate purified standard and mass spectrum of the identified peak as orotate
in both strains. (c) Box and Whisker plots of metabolites involved in nucleotide related pathways. 1 and 3 represent MG and DH lines (ancestors); 2 and
4 represent MGAdp and DHAdp lines (evolved). The top and bottom of each box represent the 25th and 75th percentiles, the centre square indicates the
mean, and the extents of the whiskers show the extent of the data. For each metabolite, the maximal measured peak area was normalized to a value of
100.
Relative abundance
m/z
Normalized peak area
Orotic acid
Adenine
Glutamate
Thymine
Ribose-5-P
Uracil
Time (min)
Time (min)
T
ime
(
min
)
m
/
z
DH_01
RT: 25.57
m/z
Relative intensity [%]
D
H
_
01
R
T: 25.57
/
/
m/
z
p
p
Orotic acid
Ad
en
i
n
e
G
lutamat
e
Thy
y
y
y
min
e
Ribose-5-P
U
rac
il
Orotate_STD
RT: 25.56
MG_01
RT: 25.57
m/z
(a)
(b)
(c)
Genome Biology 2008, 9:R72
Genome Biology 2008, Volume 9, Issue 4, Article R72 Vijayendran et al. R72.6
egories consist of groups emphasizing specific functions (see
Additional data file 4). For example, genes involved in the
pentose phosphate pathway were significantly differentially
expressed between ancestral and evolved strains of the Adp
lines (MG/MGAdp: P = 0.036; DH/DHAdp: P = 0.019; see
Additional data files 5 and 6). The pentose phosphate path-
way produces the precursors (pentose phosphates) for ribose
and deoxyribose in the nucleic acids. The accumulation of
nucleic acid metabolites (Figures 1 and 2) and over-expres-
sion of pentose phosphate pathway genes in the Adp lines
Table 2
Statistically significant metabolites involved in various evolved conditions
Evolved condition Total number of
metabolites taken
into account
Number of over-
abundant
metabolites (d
i
≥ 1)
Number of less
abundant
metabolites (d
i
≤ -1)
Total number of
differentially
abundant
metabolites
Number of
intersecting
metabolites
Total number of
intersecting
metabolites
MGAdp 111 48 7 55 27 (+) 31
DHAdp 111 39 22 61 4 (-)
MGAdpGal 111 37 6 43 7 (+) 10
DHAdpGal 111 18 19 37 3 (-)
MGStat 111 36 17 53 12 (+) 19
DHStat 111 20 21 41 7 (-)
Metabolites were assumed to be significant when their score d
i
≥ 1 or ≤ -1 (significance analysis of microarrays, T statistic value). (+), over-abundant/
expressed candidates; (-), less abundant/under-expressed candidates.
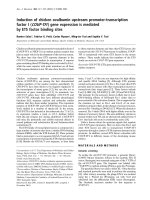
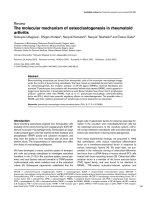
Levels of metabolites involved in TCA cycle and diversion of key intermediates to biosynthetic pathwaysFigure 3
Levels of metabolites involved in TCA cycle and diversion of key intermediates to biosynthetic pathways. In the box and whisker plots, 1 and 3 represent
MG and DH lines (ancestors), and 2 and 4 represent MGAdp and DHAdp lines (evolved). The top and bottom of each box represent the 25th and 75th
percentiles, the centre square indicates the mean, and the extents of the whiskers show the extent of the data. For each metabolite, the maximal
measured peak area was normalized to a value of 100.
Aspartate family
Aspartate
Asparagine
Threonine
Methionine
Isoleucine
Pyrimidine
Thymine
Uracil
Glutamate family
Glutamate
Glutamine
Arginine
Proline
Polyamines
5-methyl -thioadenosine
Ornithine
Putrescine
Oxaloacetate
Citrate
Cis-aconitate
Isocitrate
α
-Ketoglutarate
Succinyl -CoA
Succinate
Fumarate
Malate
Genome Biology 2008, Volume 9, Issue 4, Article R72 Vijayendran et al. R72.7
Genome Biology 2008, 9:R72
allow us to assume that the pentose phosphate pathway is
involved in adaptive evolution occurring in response to excess
nutrient.
Extent of changes
To examine the level of metabolite and gene expression
changes among all the evolutionary conditions, we applied
PCA, which is a technique for conducted multivariate data
Table 3
Statistically significant genes involved in various evolved conditions
Evolved condition Total number of
genes taken into
account
Number of over-
expressed genes
(d
i
≥ 1)
Number of under-
expressed genes
(d
i
≤ -1)
Total number of
differentially
expressed genes
Number of
intersecting genes
Total number of
intersecting genes
MGAdp 4,159 315 318 633 116 (+) 263
DHAdp 4,159 438 376 814 147 (-)
MGAdpGal 4,126 91 115 206 5 (+) 35
DHAdpGal 4,126 357 317 674 30 (-)
MGStat 4,156 306 263 569 69 (+) 120
DHStat 4,156 452 373 825 51 (-)
Genes were assumed to be significant when their score d
i
≥ 1 or ≤ -1 (significance analysis of microarrays, T statistic value). (+), over-abundant/
expressed candidates; (-), less abundant/under-expressed candidates.
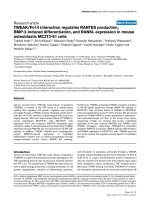
Broad functional annotations of the transcriptome profiling dataFigure 4
Broad functional annotations of the transcriptome profiling data. The pie charts of individual evolutionary experimental conditions show the distribution of
differentially regulated Gene Ontology (GO) functional modules consisting various functional categories, having P ≤ 0.05 (Wilcoxon rank sum test). The
values represent the number of GO functional categories associated with that GO functional module. For each evolutionary condition the details of GO
functional modules and its significant values are provided in Additional data file 4.
MGAdp
11.34%
7.22%
5.16%
9.28%
DHAdp
7.23%
10.33%
2.7%
11.37%
MGAdpGal
2.15%
4.31%
1.8%
6.46%
DHAdpGal
8.40%
6.30%
2.10%
4.20%
Transport Biosynthesis Catabolism Others
MGStat
13.54%
6.25%
2.8%
3.13%
DHStat
18.44%
6.15%
7.17%
10.24%
P- value ≤0.05
Genome Biology 2008, 9:R72
Genome Biology 2008, Volume 9, Issue 4, Article R72 Vijayendran et al. R72.8
The extent of changes in experimental evolution among the strainsFigure 5
The extent of changes in experimental evolution among the strains. (a-f) Principal components analysis (PCA) of the metabolome (panels a to c) and
transcriptome (panels d to f) data; each data point represents an experimental sample plotted using the first three principal components. PCA was carried
out on the log-transformed mean-centred data matrix using all identified metabolites and the genes with P ≤ 0.05 (Student's t-test) in at least one strain.
Values given for each component in parentheses represents the percentage of variance. (g-l) Pair-wise correlation maps of the metabolome (panels g to i)
and transcriptome (panels j to l) data among the strains, using Pearson correlation coefficient (r). All of the metabolites and the genes having a threshold
value of r ≤ -0.9 or ≥ 0.9 were plotted and color coded on both axes of a matrix containing all pair-wise metabolite or gene expression profile correlation.
Darker spots indicate greater degrees of negative correlation among the strains. Both the analyses were carried out using Matlab 6.5 (The MathWorks,
Inc., Natick, MA, USA).
(a)
(b)
(c)
(d)
(e)
(f)
(g)
(h)
(i)
(j)
(k)
(l)
Genome Biology 2008, Volume 9, Issue 4, Article R72 Vijayendran et al. R72.9
Genome Biology 2008, 9:R72
analysis that reduces the dimensionality and complexity of
the dataset without losing the ability to calculate accurate dis-
tance metrics. It transforms the metabolome and transcript
expression data into a more manageable form, in which the
number of clusters might be discriminated. When applied to
ancestor and Adp lines, both ancestors (MG and DH) cluster
together; Adp lines (MGAdp and DHAdp) cluster separately
from their ancestor lines, denoting substantial adaptive
changes. This pattern was observed in both the metabolite
and gene expression data, as summarized in Figure 5a, d.
When PCA was applied to MGGal, DHGal and AdpGal lines,
the MGGal and DHGal lines clustered together; AdpGal lines
clustered separately from their ancestor lines, denoting con-
siderable pleiotropic changes due to environmental shift in
both metabolite and gene expression data (Figure 5b, e).
Unlike Adp and AdpGal lines, Stat lines exhibited dissimilar
behaviors; Stat lines (MGStat and DHStat) clustered along
with their ancestor lines (MG and DH), denoting few changes
between ancestor and evolved strains or diverse changes
between the evolved strains in both metabolite and gene
expression data (Figure 5c, f). To determine the extent of
adaptation in these evolved lines, we examined whether the
media was the greatest determination of variance or whether
the adaptation was greater. To this end, we conducted PCA
analyses for both the ancestors and evolved lines of both the
strains grown in two different media (MG, MGAdp, DH,
DHAdp, MGGal, MGAdpGal, DHGal, and DHAdGal). Both
the ancestor strains grown in different media clustered
together, and both evolved strains grown in different medium
clustered together; this suggests that adaption was the great-
est determinant of variance (see Additional data file 7).
Direction of the observed extent of changes
To examine the level of observed change among the strains,
we calculated the pair-wise Pearson correlation coefficient (r;
PCC) for all of the metabolites and significantly correlating
genes. All genes having a threshold of r ≤ -0.9 or ≥ 0.9 and all
metabolites were plotted on both axes of a matrix containing
either all pair-wise metabolite or gene expression profile cor-
relations. When these correlations (r) are color coded, this
facilitates use of visual inspection to determine the degree of
positive and negative correlation among the samples in ques-
tion. The correlation map of Adp, AdpGal, and Stat line com-
parisons exhibited various degrees of negative correlation
(Figure 5g-l). Among these, Stat line comparisons (MG/
MGStat versus DH/DHStat) exhibited a high degree of nega-
tive correlation when compared with AdpGal and Adp line
comparisons in both metabolite and gene expression correla-
tion maps (Fig. 5i, l), suggesting elevated levels of variability
due to selection among the Stat lines. The correlation map of
the Adp line comparison (MG/MGAdp versus DH/DHAdp)
revealed a lower degree of negative correlation than did the
other line comparisons in both metabolite and gene expres-
sion correlation maps (Figure 5g, j), denoting a reduced level
of variability caused by selection among the Adp lines.
Gene-metabolite correlation network analysis
It has been demonstrated that functionally related genes are
preferentially linked in co-expression networks [21]. By
integrating and comparing the gene expression and metabo-
lite profile patterns, we were able to explore the connections
between the gene-gene and gene-metabolite links and associ-
ated functions (Figure 6a) by assuming that the more similar
the expression pattern is, the shorter is the distance between
genes and/or metabolites in the co-expression network. Rel-
ative transcript amounts of all genes and relative concentra-
tions of all nonredundant metabolites were combined to form
distance matrices, which were calculated by using the PCC to
build co-expression networks. In many cases there were strik-
ing relationships between network substructure, gene, or
metabolite function and co-expression (Figure 6a). The co-
expression network analysis provides a possibility to use it as
a quantifiable and analytical tool to unravel the relationships
among cellular entities that govern the cellular functions [22].
All-against-all metabolite and gene expression profile com-
parisons for Adp, AdpGal, and Stat matrices were used to gen-
erate evolution-specific co-expression networks constructed
using r (PCC). There was a significant, strong dependence
between co-expression and functional relevance of the net-
works, attesting to the potential of co-expression network
analysis (Figure 6a). In co-expression networks, nodes corre-
spond to genes or metabolites, and edges link two genes or
metabolites if they have a threshold correlation coefficient (r)
at or above which genes or metabolites are considered to be
changed differentially, exhibiting similar behavior. Correla-
tion networks as such inherently contain corresponding large
noise components, which were largely eliminated by setting
the threshold of r at 0.9. The correlation networks based on
the high threshold r of 0.9 reported here are less likely to
contain noise while being sufficiently dense for analyses of
topologic properties.
Evaluation of evolution-specific networks
With respect to a number of parameters describing their com-
mon topologic properties, all evolution-specific co-expression
networks (Adp: 4,170 nodes and 23,086 edges; AdpGal: 4,136
nodes and 20,501 edges; and Stat: 4,166 nodes and 54,028
edges) were found to be similar except for the average degree
(see Additional data file 8). The average degree (<k>) is the
average number of edges per node [22]. The Stat co-expres-
sion network exhibits higher <k> than do the Adp and Adp-
Gal networks, which is consistent with its greater numbers of
edges. The parameter <k> gives only a rough approximation
of how dense the network is. The average clustering coeffi-
cient (<C>) is a measure of network density and characterizes
the overall tendency of nodes to form clusters [22]. For all of
the evolution-specific coexpression networks, <C> was
approximately constant and high (about 0.05) when com-
pared with randomly generated networks of similar size, for
which the observed <C> was quite low (about 0.0008). The
average path length <l> is the average shortest path between
Genome Biology 2008, 9:R72
Genome Biology 2008, Volume 9, Issue 4, Article R72 Vijayendran et al. R72.10
all pairs of nodes [22]. For all of the evolution-specific co-
expression networks, the <l> was approximately constant
and low (about 6.97; Figure 6e). When analyzing the net-
works' generic features, the clustering coefficients C(k) of all
of the networks were more or less constant, implying that
they did not exhibit a hierarchical structure (Figure 6b). The
node degree (k) distribution of all of the networks appeared to
have an exponential drop-off in the tail, following a power law
(Figure 6c). Overall, these evaluations suggest that the global
properties of these evolution-specific co-expression networks
are indistinguishable.
Evolution-specific intersection networks
Strain-specific and evolution-specific networks were
screened for the set of nodes N, for which there is a link (r ≥
0.9) between two nodes a and b in both strains in the partic-
ular evolution type, in order to build evolution-specific inter-
section networks. By examining the intersection networks of
both strains, we found that the path length distribution varied
among networks. All intersection networks differed in <k>,
which is consistent with their varying numbers of edges. The
average clustering coefficient <C> was slightly higher in the
Adp intersection network (<C> Adp intersection = 0.113,
AdpGal intersection = 0.07, and Stat intersection = 0.089),
demonstrating high network density and tendency of nodes to
form clusters in the Adp intersection network (see Additional
data file 8). The average path length <l> was almost equal in
all cases, but its distribution in the Adp intersection network
differed, indicating high network navigability (Figure 6f, g).
Based on the observations of the global properties of the evo-
lution-specific intersection networks, the Adp intersection
network can be distinguished from other intersection net-
works, demonstrating its unique characteristics.
Parallelism and functional relevance of molecular
evolution
The generated networks were examined for functional coher-
ence by assigning GO functional annotations to the networks'
entities, and the level of parallelism in the representation of
these functional categories was elucidated. Parallel evolution
is the independent development of similar traits in distinct
but evolutionarily related lineages through similar selective
factors on both lines [23]. Parallel evolution of similar traits
across both lines are used as an indicator that the change is
adaptive [24]. Previous studies in E. coli and Saccharomyces
cerevisiae have demonstrated parallel changes in independ-
ently adapted lines of replicate populations by utilizing gene
expression profiling [17,19]. Here, we examined the parallel-
ism of metabolite and gene expression levels among the
evolved lines of different populations that exhibited similar
growth behavior.
To examine the functional coherence and parallelism among
the evolutionary processes, we mapped the GO functional
annotations to the corresponding evolution-specific co-
expression networks and we attempted to address the extent
to which these co-expressed entities represent functionally
related categories. By mapping GO functional categories to
the co-expression networks, statistically and significantly
over-represented functional categories were color coded
according to the hypergeometric test P value, which was cor-
rected by Benjamini & Hochberg false discovery rate (a false
discovery rate-controlled P value cutoff of ≤ 0.05; Figure 7a-
f). To examine the parallelism of evolutionary processes in
both of the strains within the context of GO functional catego-
ries, we mapped the GO functional annotations to the co-
expression networks (r ≥ 0.9) generated by merging the data
matrix of both strains, forming three evolution-specific co-
expression networks, namely Adp, AdpGal, and Stat networks
(Figure 7a, b, c). The level of parallelism differed among these
networks. In the Adp network, for example, membrane, cell
wall (sensu bacteria), inner membrane, transport activity,
catabolism, and cellular catabolism functional categories
were significantly over-represented (P ≤ 0.05; Figure 7a). In
the AdpGal network, membrane, cell wall (sensu bacteria),
inner membrane, transport, catabolism, and cellular catabo-
lism functional categories were over-represented (P ≤ 0.05;
Figure 7b). However, in the Stat network, none of the GO
functional categories was significantly over-represented,
denoting decreased level of parallelism among both strains
(Figure 7c). Further examination of parallelism of evolution-
ary processes was extended to intersection co-expression net-
works (Figure 7d, e, f), which were created by selecting the
nodes that are connected (r ≥ 0.9) in both the strains in the
particular evolutionary process in question. By examining the
parallelism in these intersection co-expression networks,
apart from other functional categories, we found that the
commonly observed distribution of statistically over-repre-
sented GO categories in all of the co-expression networks
belonged to membrane-associated GO functional categories
(Figure 7d, e, f).
Gene-to-metabolite correlation network analysesFigure 6 (see following page)
Gene-to-metabolite correlation network analyses. (a) Substructure extracted from Adp correlation network with MCODE algorithm, showing
preferentially linked functionally related metabolites. The m/z values of selective ions used for quantification are shown in parentheses for each metabolite.
In the box and whisker plots of the metabolites 1 and 3 represent MG and DH lines (ancestors), and 2 and 4 represent MGAdp and DHAdp lines
(evolved). (b-g) Topologic properties of all evolution-specific coexpression networks. Panel b shows the degree distribution of the clustering coefficients
of all of the evolution-specific network entities. The average clustering coefficient of all the nodes was plotted against the number of neighbours. Panel c
shows the degree distribution of the networks; the number of nodes with a given degree (k) in the networks approximates a power law (P [k] about k
γ
;
Adp γ = 1.70, AdpGal γ = 1.76, and Stat γ = 1.32). Distribution of the shortest path between pairs of nodes in the evolution specific (panels d and e) and
intersection (panels f and g) networks; constructed with principal components analysis thresholds of 0.8 (panels d and f) and 0.9 (panels e and g).
Genome Biology 2008, Volume 9, Issue 4, Article R72 Vijayendran et al. R72.11
Genome Biology 2008, 9:R72
Figure 6 (see legend on previous page)
10 100
0.1
0.2
0.3
0.4
0.5
0.6
0.7
0.8
0.9
1
Average clustering coefficient, C(k)
Number of neighbors
Adp
AdpGal
Stat
110100
1
10
100
1000
Number of nodes, P(k)
Degree, K
Adp
AdpGal
Stat
0 5 10 15 20 25
0
1x10
6
2x10
6
3x10
6
4x10
6
5x10
6
6x10
6
Frequency
Path length
Adp
AdpGal
Stat
0246810
0
1x10
6
2x10
6
3x10
6
4x10
6
5x10
6
6x10
6
7x10
6
8x10
6
9x10
6
Frequency
Path length
Adp
AdpGal
Stat
0 5 10 15 20 25
0
1x10
6
2x10
6
3x10
6
4x10
6
5x10
6
6x10
6
Frequency
Path length
Adp
AdpGal
Stat
12345678910
0
1x10
6
2x10
6
3x10
6
4x10
6
5x10
6
6x10
6
7x10
6
8x10
6
9x10
6
Frequency
Path length
Adp
AdpGal
Stat
(a)
(b)
(c)
(d)
(e)
(f)
(g)
Normalized peak area
Genome Biology 2008, 9:R72
Genome Biology 2008, Volume 9, Issue 4, Article R72 Vijayendran et al. R72.12
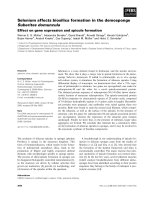
Parallelism in outer-membrane protein expression
To further examine the extent of parallel evolutionary
changes, we determined the expression levels of proteins
associated with the outer membrane (OM) of the ancestor
and evolved strains, whose membrane-related GO functional
categories were over-represented in the evolution-specific co-
expression networks (Figure 7a-f). OM protein levels revealed
substantial differential expression among the ancestor and
evolved strains (Figure 8). In Adp lines, GltB (glutamate
synthase [nicotinamide adenine dinucleotide phosphate
(NADPH)] large chain precursor), LamB (maltose high-affin-
ity receptor), and YaeT (polypeptide involved in outer-mem-
brane protein biogenesis) proteins were over-expressed;
whereas in Stat lines FepA (outer receptor for ferric entero-
bactin), CirA (outer membrane receptor for iron-regulated
colicin I receptor), OmpC (outer membrane porin), and
OmpA (outer-membrane porin) proteins were differentially
over-expressed (Figure 8). Significantly, we observed paral-
lelism in the level of protein expression patterns in these
evolved strains and involvement of the outer membrane pro-
teins in these evolutionary processes.
Discussion
In this study we examined the metabolome and transcrip-
tome profiles of excess nutrient adaptive evolution, pleio-
tropic environmental shift changes, and prolonged stationary
phase evolution in two strains of E. coli K-12. We found sig-
nificant influence of genes involved in transport and mem-
brane related functional categories in all evolutionary
conditions evaluated in this study. In earlier studies, during
prolonged nutrient limited chemostat culture of bacterial
populations, it was reported that the populations tend toward
mutational adaptation in transport systems in order to
increase the efficiency with which they utilize limited nutri-
ents [25-28]. For example, glucose limited chemostat evolved
strains attained diverse mutations at several loci in LamB
porin, which increased glucose permeability [27-29]. An ear-
Parallelism and functional relevance of molecular evolutionFigure 7
Parallelism and functional relevance of molecular evolution. Gene Ontology (GO) functional annotations were mapped to the corresponding evolution-
specific co-expression networks and examined for commonalities in the co-expressed entities representing functional related categories. Each node
represents a GO functional category, and the area of a node is proportional to the number of genes in the network matrix to the corresponding GO
category. Statistically and significantly over-represented categories are color coded based on the hypergeometric test P value, which was corrected by
Benjamini & Hochberg false discovery rate (a false discovery rate-controlled P value cutoff of ≤ 0.05). Gray nodes are not significantly over-represented.
(a-c) GO annotations were mapped to the evolution-specific co-expression networks, namely Adp (panel a), AdpGal (panel b), and Stat (panel c). (d-f)
GO annotations mapped evolution-specific intersection co-expression networks, namely (d) Adp intersection, (e) AdpGal intersection, and (f) Stat
intersection. Not all over-represented categories are labeled because of the interdependency of functional categories in the GO hierarchy. Definitions of
numbers: 1, membrane; 2, cell wall (sensu bacteria); 3, inner membrane; 4, transporter activity; 5, transport; 6, catabolism; 7, cellular catabolism; 8, amino
acid metabolism; 9, nitrogen compound metabolism; 10, carbohydrate metabolism; 11, energy derivation by oxidation of organic compounds.
1
2
3
1
2
3
5
6
1
2
3
4
6
8
9
11
1
2
3
4
6
7
8
9
11
1
2
3
5
6
7
10
1
2
3
Adp
AdpGal
Stat
Adp intersection
AdpGal intersection
Stat intersection
Genome Biology 2008, Volume 9, Issue 4, Article R72 Vijayendran et al. R72.13
Genome Biology 2008, 9:R72
lier study of adaptation of Ralstonia in selective environ-
ments [30] resulted in morphologic changes in the outer cell
envelope in all of the lineages examined.
In adaptation to excess nutrient resources, the Adp lines
exhibited higher levels of metabolites that are involved in the
nucleotide pathway and TCA cycle and its intermediates (Fig-
ures 1, 3, and 8). In line with these observations, the expres-
sion levels of genes involved in these pathways were also over-
expressed in the Adp lines (Figure 9; also see Additional data
file 5). Specifically, the pentose phosphate pathway (produces
pentose phosphates for nucleic acid synthesis) was differen-
tially regulated, along with the histidine biosynthesis path-
way, which shares metabolites with the purine and nucleotide
biosynthesis pathways (see Additional data files 6 and 9). For
example, glutamate, which is involved in the de novo biosyn-
thesis of purine nucleotides and various other pathways as a
reactant, was accumulated in higher amounts in the Adp
lines. In accordance with this observation, the genes that are
involved in the glutamate biosynthesis and the protein gluta-
mate synthase (GltB) were upregulated in the Adp lines (Fig-
ure 8). Taken together, the increased growth fitness in Adp
lines, relative to their ancestor lines, can be presumed to be
due to the differential levels of TCA cycle components (the
first step in generating precursors for several biosynthetic
pathways) and components involved in pentose phosphate
pathway (the main source of precursor metabolites for bio-
synthesis and the main producer of NADPH, which is utilized
in several biosynthesis pathways). However, the involvement
of these pathways in growth fitness requires confirmation in
additional studies. Our finding that central metabolism is
altered in excess nutrient and famine conditions (Figure 9) is
consistent with a previously reported study focusing on adap-
tive evolution in yeast in glucose-limited chemostat
experiments, which demonstrated gene expression variation
in glycolysis, the TCA cycle, and metabolite transport [17].
In long-term stationary phase cultures, cells lose their integ-
rity and release their cellular components into the medium as
cells enter the death phase [2]. For cell maintenance and
growth, the surviving cells scavenge nutrient sources from the
cellular debris (amino acids from proteins, carbohydrates
from the cell wall, and lipids from cell membrane material
and DNA) of their dead siblings [2]. This nutrient scavenging
process due to nutrient limitation enhances the availability of
carbon sources by reconstruction of the OM composition
(glycerophospholipids, lipopolysaccharides and proteins)
and there by improving the permeability of the OM [31]. The
Parallelism and functional significance in the outer membrane protein expressionFigure 8
Parallelism and functional significance in the outer membrane protein expression. SDS gel electrophoresis of the protein samples obtained from the outer
membrane of the ancestor and evolved lines showing the identified proteins by peptide mass fingerprinting.
GltB
YaeT
To lC
LamB
OmpC
OmpA
MetQ
Marker
MG
MGAdp
MGStat
DH
DHAdp
DHStat
KDa
170
130
100
70
55
40
35
FepA
CirA
Genome Biology 2008, 9:R72
Genome Biology 2008, Volume 9, Issue 4, Article R72 Vijayendran et al. R72.14
OM of E. coli consists of a lipid bilayer structure composed of
an outer layer consisting of lipopolysaccharide and an inner
layer consisting of phospholipids [32]. The genes involved in
the biosynthetic pathways of fatty acids (key building blocks
for the phospholipid components of cell membranes) and lip-
ids were over-expressed in Stat lines (see Additional data file
10). Other major components of the OM are proteins; these
largely consist of porins, which co-exist with lipopolysaccha-
ride [33]. The OM of the cell is the first point of contact with
the external environment, and therefore its cellular constitu-
ents may be the most sensitive to the external environment.
Consistent with this hypothesis, OM proteins FepA, CirA,
OmpC, and OmpA were differentially over-expressed in Stat
lines (Figure 8), and the genes belonging to the membrane-
associated GO functional categories were significantly over-
represented in the corresponding evolutionary networks as
well (Figure 7f). This demonstrates the reliability of the corre-
lation network analysis, which was sufficiently robust to iden-
tify significant changes in the integrated metabolite and gene
profiling dataset.
Mutation rates in stationary phase are known to be influenced
by the genetic background of the strain [10]. Initial isogenic
long-term stationary phase cultures are highly dynamic and
are known to yield different 'growth advantage in stationary
phase' mutations due to significant genotypic diversity in
these cultures [2]. Consistent with this hypothesis, when we
applied PCA (Figure 5c, f) and correlation plot analysis (Fig-
ure 5i, l), the metabolite and gene expression levels of Stat
lines exhibited low degrees of parallelism when compared
with their ancestor lines. Likewise, when GO functional anno-
tations were mapped onto the Stat co-expression network, we
found that none of the GO functional categories was
significantly over-represented, denoting a low level of paral-
lelism (Figure 7c). However, when applied to the Stat inter-
section co-expression network, membrane-associated GO
functional categories were significantly over-represented
(Figure 7f). These observations demonstrate the parallelism
in membrane-associated categories in the Stat intersection
co-expression network but not in the Stat co-expression net-
work. It suggests the existence of parallelism in membrane-
associated categories but not in similar membrane-associated
genes in Stat lines. From this we can conclude that distinct
but functionally related genes are involved in the parallelism
in the Stat intersection co-expression network.
Conclusion
We analyzed two different strains under three different evo-
lutionary conditions. Integration of metabolome and gene
expression data within the context of evolution facilitated
investigation of the path of evolution and their degree of par-
allelism. Classifying microarray data according to signifi-
cantly over-represented GO functional categories showed
that the transport related categories had the greater overall
representation. Similarly, by mapping the GO annotation to
the correlation networks, we found that the membrane
associated functional categories were significantly over-rep-
resented. The OM of the cell is the first point of contact with
the external environment, which acts as a barrier that is quite
resistant to insult and acts as a channel for nutrient transport.
Components of the OM may therefore be the cellular constit-
uents that are most sensitive to the external environment.
Analyses of the OM proteins of the ancestor and evolved
strains revealed clear differential regulation of the OM
proteins.
In summary, all of the evolutionary experiments reported in
this study demonstrate the vital role played by the involve-
ment of the membrane associated components in the
evolutionary process. These studies show that adaptive evolu-
tion in excess nutrient conditions are appropriate for
examining the extent of parallelism in the evolutionary proc-
ess of the evolved populations, whereas the prolonged sta-
tionary phase conditions are useful in understanding the
evolution of microbial diversity among evolved populations
and the dynamic state of the evolved condition. Such studies
will certainly advance our understanding of the process of
evolution immensely and, along with constructed models
[34], will be an ideal initial source of data for systems biology
study of microbial evolution.
Materials and methods
Strain and culture conditions
Both the bacterial strains MG1655 and DH10B used in this
study are derivatives of E. coli K-12. All of the experiments
were conducted in 250 ml of M9 minimal medium supple-
mented with 4 g/l glucose or galactose in covered 1 l Erlen-
meyer flasks at 37°C. Adaptation to excess nutrient
experiments were carried out in the presence of 4 g/l glucose
through serial passage at exponential phase for about 1,000
generations. The cells were grown overnight and were diluted
by passage into fresh medium. Passage of each culture into
fresh medium was conducted in a laminar flow station using
Gene and metabolite levels in the central metabolic routes and the diversion of key intermediates to biosynthetic pathwaysFigure 9 (see following page)
Gene and metabolite levels in the central metabolic routes and the diversion of key intermediates to biosynthetic pathways. Genes are represented in
green text, and metabolites in orange text. Ancestor and evolved strain-specific gene expression comparisons are denoted in green boxes (M, MG1655; D,
DH10B). Ancestor and evolved strain-specific metabolite abundance comparisons are denoted in orange boxes (m, MG1655; d, DH10B). Logarithmically
transformed (to base 2) response ratios were utilized for each comparison according to the log
2
ratio scale on the upper right inset.
Genome Biology 2008, Volume 9, Issue 4, Article R72 Vijayendran et al. R72.15
Genome Biology 2008, 9:R72
Figure 9 (see legend on previous page)
Glucose -6-P
Fructose -6-P
Fructose- 1,6-bis-P
Dihydroxyacetone -PGlyceraldehyde -3-P
1,3-Di-P-Glycerate
3- P-Glycerate
Phosphoenolpyruvate
Pyruvate
Acetyl - CoA
Citrate
Isocitrate
α -Ketoglutarate
Succinyl CoA
Succinate
2- P-Glycerate
fumarate
Malate
Oxaloacetate
Gluconolactone -6-P6-P-Gluconate
Ribulose-5-P
Xylulose -5-P Ribose-5-P
Sedoheptulose -7-P
Erythrose-4-P
Cis-aconitate
Glyoxylate
Fructose-6-P
Serine family
Serine
Cysteine
Glycine
Purine nucleotides
Adenine
Aspartate family
Aspartate
Asparagine
Threonine
Methionine
Isoleucine
Pyrimidine nucleotides
Thymine
Uracil
Glutamate family
Glutamate
Glutamine
Arginine
Proline
Polyamines
Pyruvate family
Alanine
Valine
Leucine
Isoleucine
Chorismate Aromatic family
Tyrosine
Phenylalanine
Tryptophan
pgi
pfkA
fbaBfbaA
tpiA
gapA
pgk
pgmI
ytjC
pgmA
eno
pykF
pykA
lpdA
aceF
aceE
pfkB
prpC
gltA
acnB
acnA
acnB
acnA
icd
lpdA
sucB
sucA
sucC
sucD
mdh
mqo
sdhA
sdhB
sdhD
sdhC
fumA
fumB
fumC
zwf
pgl
gnd
rpe
rpiA
alsI
tktB tktA
talA talB
tktB tktA
aceA
glcB
aceB
4-Aminobutyrate 5-Methyl -thioadenosine Ornithine Putrescine Spermidine
DH10B
DH/
DHAdp
DH/
DHStat
DHGal / DHAdpGal
MG /
MGAd p
MG /
MGSta t
MGGal / MGAdpGal
MG 1655
Gene profiling data
DH10B
DH/
DHAdp
DH/
DHStat
DHGal / DHAdpGal
MG /
MGAd p
MG /
MGSta t
MGGal / MGAd p Gal
MG1655
Metablite profiling data
Genome Biology 2008, 9:R72
Genome Biology 2008, Volume 9, Issue 4, Article R72 Vijayendran et al. R72.16
standard sterile technique practices. Serial passage was
conducted for 37 days at exponential phase for about 1,000
generations. For adaptation due to environmental shift
experiments, the strains that were adapted to excess nutrient
(glucose) condition for about 1,000 generations were grown
in 4 g/l galactose. For prolonged stationary phase adaptation
experiments, both the strains were incubated for 37 days in
M9 minimal medium with 4 g/l glucose as initial source of
carbon. The evolved populations were frozen using liquid
nitrogen and stored in a freezer at -80°C.
Metabolite profiling
Approximately equal numbers of cells (7 × 10
9
) were taken
from the exponential phase of growth for all of the experi-
ments. Cells were disrupted using acid washed glass beads at
maximum speed in a Ribolyser (Q-BIOgene, Heidelberg, Ger-
many) at a setting of 6.5 m/second, twice for 45 seconds in the
presence of 80% methanol. Subsequently, metabolites were
derived using methoxylamine hydrochloride and N-methyl-
N-(trimethylsilyl)trifluoroacetamide in the presence of ribitol
as the internal standard. Sample volumes of 1 μl were ana-
lysed using a TraceGC gas chromatograph coupled to a Polar-
isQ ion trap mass spectrometer (Thermo Finnigan, Dreieich,
Germany). Derived metabolites were evaporated at 250°C in
splitless mode and separated on a 30 m × 0.25 mm Equity-5
column with 0.25 μm coating (Supelco, Bellefonte, California,
USA). Metabolites were identified by comparison with
purified standards, the NIST 2005 database (NIST) and the
Golm Metabolome Database [35]. Selected metabolite peak
areas were automatically quantified using the processing
setup implemented in the Xcalibur 1.4 software (Thermo
Finnigan, Dreieich, Germany). The relative response ratios
calculated from the peak areas were normalized by the inter-
nal standard ribitol and dry mass of the sample. For both the
strains in all the biologic experiments, six replicates were
used, which consisted of three independent biologic repli-
cates and three technical replicates. The variation among the
biological replicates was estimated to be relatively low (see
Additional data file 11 [part a]).
Gene expression profiling
E. coli K12 V2 OciChip™ arrays containing 4,288 gene spe-
cific oligonucleotide probes representing the complete E. coli
K-12 genome were utilized in this study (Ocimum
Biosolutions, Hyderabad, India). Total RNA was isolated
using RNeasy kit (Qiagen, Hilden, Germany), in accordance
with the manufacturer's instructions. Reverse transcription,
labeling, and scanning were performed as described previ-
ously [36]. Hybridization was carried out in accordance with
the manufacturer's instructions (Ocimum Biosolutions,
Hyderabad, India).
Microarray data analysis
Mean signal and mean local background intensities were
determined for each spot of the microarray images, by using
the ImaGene 6.0 software for spot detection, image segmen-
tation, and signal quantification (Biodiscovery, Los Angeles,
California, USA). After subtraction of the local background
intensities from the signal intensities, the average intensity in
both channels was subsequently normalized using the LOW-
ESS (locally weighted scatterplot smoothing) method using
the GeneSight 4.0 software package (Biodiscovery, Los Ange-
les, California, USA). The normalized log
2
ratios were used to
represent the data graphically and to calculate Wilcoxon rank
sum test P value using MapMan software [37], with functional
classifications based on MultiFun and GO terms, a cell func-
tion assignment scheme, with slight modification [38,39].
The SAM add-in to Microsoft Excel was used for comparisons
of replicate array experiments [16]. For both of the strains in
all of the biologic experiments, three or more replicates were
used, which consisted of three biologic replicates. The
variation among the biologic replicates was estimated to be
relatively low (see Additional data file 11 [part b]). The
ArrayExpress repository [40] accession number for the
microarray data is E-MEXP-1166, which consists of 29
hybridizations.
Network analysis
All of the networks reported in this study were constructed
based on PCC r ≥ 0.9 measure (nodes that correspond to
genes or metabolites with r ≥ 0.9 were linked by an edge). All-
against-all metabolite and gene expression profile r values of
evolution-specific matrices were used to generate evolution-
specific co-expression network. Strain-specific and evolution-
specific matrices were used to generate evolution-specific
intersection co-expression network. Intersection co-expres-
sion networks are the network over the set of nodes N, where
there is a link (r ≥ 0.9) between two nodes i and j if they are
connected in both of the strains in the particular evolutionary
condition in context. Topologic properties of the networks
were analyzed using the Pajek program [41].
Network functional analysis
Network visualization and functional analysis was achieved
using Cytoscape [42]. Networks were screened for highly
linked clusters of genes or metabolites using MCODE [43].
Genes in the networks were functionally categorized using
their GO biologic process annotation terms [44], and the
over-represented GO terms were identified with BINGO [45].
The hypergeometric test was used for this purpose, with the
Benjamini and Hochberg false discovery rate correction (a
false discovery rate-controlled P value cutoff of ≤ 0.05).
Outer membrane protein analysis
Approximately equal numbers of extracted cells (7 × 10
9
)
were disrupted by ultrasonication with 5 ml of 50 mmol/l
Tris/HCl (pH 7.3), containing 0.7 mg of DNase I (Sigma,
Taufkirchen, Germany) and 0.5 mmol/l protease inhibitor
(Pefabloc SC; Centerchem, Inc., Norwalk, CT, USA). After the
unbroken cells were removed by centrifugation, the superna-
tant was treated with ice-cold 0.1 mol/l sodium carbonate
(pH 11). Eventually, the carbonate treated membranes were
Genome Biology 2008, Volume 9, Issue 4, Article R72 Vijayendran et al. R72.17
Genome Biology 2008, 9:R72
collected and subsequently analysed by SDS one-dimensional
gel electrophoresis. Excised protein bands were subjected to
tryptic digestion and mass spectra were obtained on a
Ultraflex MALDI-TOF/TOF (Bruker Daltonics, Bremen,
Germany). Peptide masses were searched against the E. coli
database located on our local server using MASCOT search
engine (Matrix Science Ltd., London, U.K) with a mass cutoff
of 100 ppm.
Abbreviations
<C>, clustering coefficient; GO, Gene Ontology; <k>, average
degree; <l>, average path length; NADPH, nicotinamide ade-
nine dinucleotide phosphate; OM, outer membrane; PCA,
principal components analysis; PCC, Pearson correlation
coefficient; SAM, significance analysis of microarrays; TCA,
tricarboxylic acid.
Authors' contributions
CV conducted all the experiments cited in this study, analyzed
the results, and wrote this manuscript. A Barsch was involved
in metabolomics experiments. KF was involved in experimen-
tal guidance. KN was involved in experimental design. A
Becker is the scientist in whose laboratory microarray exper-
iments were conducted. EF is the scientist in whose
laboratory all of the experiments were conducted and was
involved in the experimental design.
Additional data files
The following additional data are available with the online
version of this paper. Additional data file 1 is a table listing the
identified metabolites of the ancestral and evolved strains by
gas chromatography-mass spectrometry. Additional data file
2 is a table listing significantly altered metabolites in all of the
evolved conditions. Additional data file 3 is a table listing sig-
nificantly altered genes in all of the evolved conditions. Addi-
tional data file 4 is a table listing significant GO functional
categories involved in all of the evolved conditions. Addi-
tional data file 5 is a figure showing the integration of tran-
scriptome and metabolome data during the comparison of
ancestral and evolved strains in excess nutrient adaptive evo-
lution. Additional data file 6 is a figure showing the gene
expression and metabolite abundance level in the pentose
phosphate pathway in excess nutrient adapted strains. Addi-
tional data file 7 is a figure showing PCA analyses for both the
ancestor and evolved lines of both the strains grown in two
different media. Additional data file 8 is a table listing com-
mon topologic properties of all evolution co-expression net-
works. Additional data file 9 is a figure showing the gene
expression and metabolite abundance level in histidine bio-
synthesis pathway in excess nutrient adapted strains. Addi-
tional data file 10 is a figure showing the integration of
transcriptome and metabolome data during the comparison
of ancestral and evolved strains in prolonged stationary phase
evolution. Additional data file 11 is a figure showing metabo-
lite abundance level and gene expression level among the bio-
logic replicates.
Additional data file 1Identified metabolites of the ancestral and evolved strainsPresented is a table listing the identified metabolites of the ances-tral and evolved strains by gas chromatography-mass spectrometry.Click here for fileAdditional data file 2Significantly altered metabolitesPresented is a table listing significantly altered metabolites in all of the evolved conditions.Click here for fileAdditional data file 3Significantly altered genesPresented is a table listing significantly altered genes in all of the evolved conditions.Click here for fileAdditional data file 4Significant GO functional categoriesPresented is a table listing significant GO functional categories involved in all of the evolved conditions.Click here for fileAdditional data file 5Integration of transcriptome and metabolome dataPresented is a figure showing the integration of transcriptome and metabolome data during the comparison of ancestral and evolved strains in excess nutrient adaptive evolution.Click here for fileAdditional data file 6Gene expression and metabolite abundance level in the pentose phosphate pathway in excess nutrient adapted strainsPresented is a figure showing the gene expression and metabolite abundance level in the pentose phosphate pathway in excess nutri-ent adapted strains.Click here for fileAdditional data file 7PCA analyses for both the ancestor and evolved lines of both strains grown in two different mediaPresented is a figure showing PCA analyses for both the ancestor and evolved lines of both strains grown in two different media.Click here for fileAdditional data file 8Common topologic properties of all evolution co-expression networksPresented is a table listing common topologic properties of all evo-lution co-expression networks.Click here for fileAdditional data file 9Gene expression and metabolite abundance level in histidine bio-synthesis pathway in excess nutrient adapted strainsPresented is a figure showing the gene expression and metabolite abundance level in histidine biosynthesis pathway in excess nutri-ent adapted strains.Click here for fileAdditional data file 10Integration of transcriptome and metabolome data during the comparison of ancestral and evolved strains in prolonged station-ary phase evolutionPresented is a figure showing the integration of transcriptome and metabolome data during the comparison of ancestral and evolved strains in prolonged stationary phase evolution.Click here for fileAdditional data file 11Metabolite abundance level and gene expression level among bio-logic replicatesPresented is a figure showing metabolite abundance level and gene expression level among the biologic replicates.Click here for file
Acknowledgements
We thank Steven E Finkel (University of Southern California), Rashmi
Prasad (University of Bielefeld), and Rileen Sinha (Fritz Lipmann Institute)
for helpful comments and critical reading of the manuscript. We should like
to thank Manuela Meyer and Eberhard Wünsch for their technical assist-
ance. The work was supported by a scholarship from the NRW Interna-
tional Graduate School in Bioinformatics and Genome Research.
References
1. Elena SF, Lenski RE: Evolution experiments with microorgan-
isms: the dynamics and genetic bases of adaptation. Nat Rev
Genet 2003, 4:457-469.
2. Finkel SE: Long-term survival during stationary phase: evolu-
tion and the GASP phenotype. Nat Rev Microbiol 2006,
4:113-120.
3. Wright BE: Stress-directed adaptive mutations and evolution.
Mol Microbiol 2004, 52:643-650.
4. Zinser ER, Kolter R: Escherichia coli evolution during stationary
phase. Res Microbiol 2004, 155:328-336.
5. Lenski RE, Travisano M: Dynamics of adaptation and diversifica-
tion: a 10,000-generation experiment with bacterial
populations. Proc Natl Acad Sci USA 1994, 91:6808-6814.
6. Sniegowski PD, Gerrish PJ, Lenski RE: Evolution of high mutation
rates in experimental populations of E. coli. Nature 1997,
387:703-705.
7. Papadopoulos D, Schneider D, Meier-Eiss J, Arber W, Lenski RE, Blot
M: Genomic evolution during a 10,000-generation
experiment with bacteria. Proc Natl Acad Sci USA 1999,
96:3807-3812.
8. Finkel SE, Kolter R: Evolution of microbial diversity during pro-
longed starvation. Proc Natl Acad Sci USA 1999, 96:4023-4027.
9. Loewe L, Textor V, Scherer S: High deleterious genomic muta-
tion rate in stationary phase of Escherichia coli. Science 2003,
302:1558-1560.
10. Bjedov I, Tenaillon O, Gerard B, Souza V, Denamur E, Radman M,
Taddei F, Matic I: Stress-induced mutagenesis in bacteria. Sci-
ence 2003, 300:1404-1409.
11. Lombardo MJ, Aponyi I, Rosenberg SM: General stress response
regulator RpoS in adaptive mutation and amplification in
Escherichia coli. Genetics 2004, 166:669-680.
12. Zinser ER, Kolter R:
Prolonged stationary-phase incubation
selects for lrp mutations in Escherichia coli K-12. J Bacteriol
2000, 182:4361-4365.
13. Zinser ER, Kolter R: Mutations enhancing amino acid catabo-
lism confer a growth advantage in stationary phase. J Bacteriol
1999, 181:5800-5807.
14. Raamsdonk LM, Teusink B, Broadhurst D, Zhang N, Hayes A, Walsh
MC, Berden JA, Brindle KM, Kell DB, Rowland JJ, Westerhoff HV, van
Dam K, Oliver SG: A functional genomics strategy that uses
metabolome data to reveal the phenotype of silent
mutations. Nat Biotechnol 2001, 19:45-50.
15. Fernie AR, Trethewey RN, Krotzky AJ, Willmitzer L: Metabolite
profiling: from diagnostics to systems biology. Nat Rev Mol Cell
Biol 2004, 5:763-769.
16. Tusher VG, Tibshirani R, Chu G: Significance analysis of micro-
arrays applied to the ionizing radiation response. Proc Natl
Acad Sci USA 2001, 98:5116-5121.
17. Ferea TL, Botstein D, Brown PO, Rosenzweig RF: Systematic
changes in gene expression patterns following adaptive evo-
lution in yeast. Proc Natl Acad Sci USA 1999, 96:9721-9726.
18. Riehle MM, Bennett AF, Lenski RE, Long AD: Evolutionary changes
in heat-inducible gene expression in lines of Escherichia coli
adapted to high temperature. Physiol Genomics 2003, 14:47-58.
19. Cooper TF, Rozen DE, Lenski RE: Parallel changes in gene
expression after 20,000 generations of evolution in
Escherichia coli. Proc Natl Acad Sci USA 2003, 100:1072-1077.
20. Fong SS, Joyce AR, Palsson BO: Parallel adaptive evolution cul-
tures of Escherichia coli lead to convergent growth pheno-
Genome Biology 2008, 9:R72
Genome Biology 2008, Volume 9, Issue 4, Article R72 Vijayendran et al. R72.18
types with different gene expression states. Genome Res 2005,
15:1365-1372.
21. Wolfe CJ, Kohane IS, Butte AJ: Systematic survey reveals gen-
eral applicability of 'guilt-by-association' within gene coex-
pression networks. BMC Bioinformatics 2005, 6:227.
22. Barabasi AL, Oltvai ZN: Network biology: understanding the
cell's functional organization. Nat Rev Genet 2004, 5:101-113.
23. Schluter D: Parallel evolution and inheritance of quantitative
traits. Am Nat 2004, 163:809-822.
24. Bull JJ, Badgett MR, Wichman HA, Huelsenbeck JP, Hillis DM, Gulati
A, Ho C, Molineux IJ: Exceptional convergent evolution in a
virus. Genetics 1997, 147:1497-1507.
25. Helling RB, Vargas CN, Adams J: Evolution of Escherichia coli dur-
ing growth in a constant environment. Genetics 1987,
116:349-358.
26. Sonti RV, Roth JR: Role of gene duplications in the adaptation
of Salmonella typhimurium to growth on limiting carbon
sources. Genetics 1989, 123:19-28.
27. Notley-McRobb L, Ferenci T: Adaptive mgl-regulatory muta-
tions and genetic diversity evolving in glucose-limited
Escherichia coli populations. Environ Microbiol 1999, 1:33-43.
28. Notley-McRobb L, Ferenci T: The generation of multiple co-
existing mal-regulatory mutations through polygenic evolu-
tion in glucose-limited populations of Escherichia coli. Environ
Microbiol 1999, 1:45-52.
29. Notley-McRobb L, Ferenci T: Experimental analysis of molecu-
lar events during mutational periodic selections in bacterial
evolution. Genetics 2000, 156:1493-1501.
30. Riley MS, Cooper VS, Lenski RE, Forney LJ, Marsh TL: Rapid pheno-
typic change and diversification of a soil bacterium during
1000 generations of experimental evolution. Microbiology 2001,
147:995-1006.
31. Liu X, Ferenci T: An analysis of multifactorial influences on the
transcriptional control of ompF and ompC porin expression
under nutrient limitation. Microbiology 2001, 147:2981-2989.
32. Nikaido H, Nakae T: The outer membrane of Gram-negative
bacteria. Adv Microb Physiol 1979, 20:163-250.
33. Nikaido H: Molecular basis of bacterial outer membrane per-
meability revisited. Microbiol Mol Biol Rev 2003, 67:593-656.
34. Covert MW, Knight EM, Reed JL, Herrgard MJ, Palsson BO: Inte-
grating high-throughput and computational data elucidates
bacterial networks. Nature 2004, 429:92-96.
35. Kopka J, Schauer N, Krueger S, Birkemeyer C, Usadel B, Bergmuller
E, Dormann P, Weckwerth W, Gibon Y, Stitt M, Willmitzer L, Fernie
AR, Steinhauser D: : the Golm Metabolome
Database. Bioinformatics 2005, 21:1635-1638.
36. Ruberg S, Tian ZX, Krol E, Linke B, Meyer F, Wang Y, Puhler A, Wei-
dner S, Becker A: Construction and validation of a Sinorhizo-
bium meliloti whole genome DNA microarray: genome-wide
profiling of osmoadaptive gene expression. J Biotechnol 2003,
106:255-268.
37. Thimm O, Blasing O, Gibon Y, Nagel A, Meyer S, Kruger P, Selbig J,
Muller LA, Rhee SY, Stitt M: MAPMAN: a user-driven tool to dis-
play genomics data sets onto diagrams of metabolic path-
ways and other biological processes. Plant J 2004, 37:914-939.
38. Serres MH, Riley M: MultiFun, a multifunctional classification
scheme for Escherichia coli K-12 gene products. Microb Comp
Genomics 2000, 5:
205-222.
39. Serres MH, Goswami S, Riley M: GenProtEC: an updated and
improved analysis of functions of Escherichia coli K-12
proteins. Nucleic Acids Res 2004:D300-D302.
40. Parkinson H, Kapushesky M, Shojatalab M, Abeygunawardena N,
Coulson R, Farne A, Holloway E, Kolesnykov N, Lilja P, Lukk M, Mani
R, Rayner T, Sharma A, William E, Sarkans U, Brazma A: ArrayEx-
press: a public database of microarray experiments and gene
expression profiles. Nucleic Acids Res 2007:D747-D750.
41. Batagelj V, Mrvar A: PAJEK: program for large network
analysis. Connections 1998, 21:47-57.
42. Shannon P, Markiel A, Ozier O, Baliga NS, Wang JT, Ramage D, Amin
N, Schwikowski B, Ideker T: Cytoscape: a software environment
for integrated models of biomolecular interaction networks.
Genome Res 2003, 13:2498-2504.
43. Bader GD, Hogue CW: An automated method for finding
molecular complexes in large protein interaction networks.
BMC Bioinformatics 2003, 4:2.
44. Ashburner M, Ball CA, Blake JA, Botstein D, Butler H, Cherry JM,
Davis AP, Dolinski K, Dwight SS, Eppig JT, Harris MA, Hill DP, Issel-
Tarver L, Kasarskis A, Lewis S, Matese JC, Richardson JE, Ringwald M,
Rubin GM, Sherlock G: Gene ontology: tool for the unification
of biology. The Gene Ontology Consortium. Nat Genet 2000,
25:25-29.
45. Maere S, Heymans K, Kuiper M: BiNGO: a Cytoscape plugin to
assess overrepresentation of gene ontology categories in
biological networks. Bioinformatics 2005, 21:3448-3449.