Báo cáo y học: " Gene expression profiling of human prostate cancer stem cells reveals a pro-inflammatory phenotype and the importance of extracellular matrix interactions" pps
Bạn đang xem bản rút gọn của tài liệu. Xem và tải ngay bản đầy đủ của tài liệu tại đây (1.34 MB, 13 trang )
Genome Biology 2008, 9:R83
Open Access
2008Birnieet al.Volume 9, Issue 5, Article R83
Research
Gene expression profiling of human prostate cancer stem cells
reveals a pro-inflammatory phenotype and the importance of
extracellular matrix interactions
Richard Birnie
*
, Steven D Bryce
†
, Claire Roome
‡
, Vincent Dussupt
*
,
Alastair Droop
§
, Shona H Lang
†
, Paul A Berry
†
, Catherine F Hyde
†
,
John L Lewis
†
, Michael J Stower
¶
, Norman J Maitland
†
and Anne T Collins
†
Addresses:
*
Pro-Cure Therapeutics Ltd, The Biocentre, Innovation Way, York Science Park, Heslington, York YO10 5NY, UK.
†
YCR Cancer
Research Unit, Department of Biology, University of York, York YO10 5YW, UK.
‡
Hull York Medical School, University of York, Heslington,
York YO10 5DD, UK.
§
York Centre for Complex Systems Analysis, Department of Biology, University of York, York YO10 5YW, UK.
¶
Department
of Urology, York Hospital, Wigginton Road, York YO31 8HE, UK.
Correspondence: Anne T Collins. Email:
© 2008 Birnie et al.; licensee BioMed Central Ltd.
This is an open access article distributed under the terms of the Creative Commons Attribution License ( which
permits unrestricted use, distribution, and reproduction in any medium, provided the original work is properly cited.
Prostate cancer stem cell signature<p>An expression signature of human prostate cancer stem cells identifies 581 differentially expressed genes and suggests that the JAK-STAT pathway and focal adhesion signaling are important.</p>
Abstract
Background: The tumor-initiating capacity of many cancers is considered to reside in a small
subpopulation of cells (cancer stem cells). We have previously shown that rare prostate epithelial
cells with a CD133
+
/α
2
β
1
hi
phenotype have the properties of prostate cancer stem cells. We have
compared gene expression in these cells relative to their normal and differentiated (CD133
-
/
α
2
β
1
low
) counterparts, resulting in an informative cancer stem cell gene-expression signature.
Results: Cell cultures were generated from specimens of human prostate cancers (n = 12) and
non-malignant control tissues (n = 7). Affymetrix gene-expression arrays were used to analyze total
cell RNA from sorted cell populations, and expression changes were selectively validated by
quantitative RT-PCR, flow cytometry and immunocytochemistry. Differential expression of
multiple genes associated with inflammation, cellular adhesion, and metastasis was observed.
Functional studies, using an inhibitor of nuclear factor κB (NF-κB), revealed preferential targeting
of the cancer stem cell and progenitor population for apoptosis whilst sparing normal stem cells.
NF-κB is a major factor controlling the ability of tumor cells to resist apoptosis and provides an
attractive target for new chemopreventative and chemotherapeutic approaches.
Conclusion: We describe an expression signature of 581 genes whose levels are significantly
different in prostate cancer stem cells. Functional annotation of this signature identified the JAK-
STAT pathway and focal adhesion signaling as key processes in the biology of cancer stem cells.
Published: 20 May 2008
Genome Biology 2008, 9:R83 (doi:10.1186/gb-2008-9-5-r83)
Received: 20 December 2007
Revised: 5 March 2008
Accepted: 20 May 2008
The electronic version of this article is the complete one and can be
found online at />Genome Biology 2008, 9:R83
Genome Biology 2008, Volume 9, Issue 5, Article R83 Birnie et al. R83.2
Background
The concept of a cancer stem cell within a more differentiated
tumor mass, as an aberrant form of normal differentiation, is
now gaining acceptance over the current stochastic model of
oncogenesis, in which all tumor cells are equivalent both in
growth and tumor-initiating capacity [1,2]. For example, in
leukaemia, the ability to initiate new tumor growth resides in
a rare phenotypically distinct subset of tumor cells [3] that are
defined by the expression of CD34
+
CD38
-
surface antigens
and have been termed leukemic stem cells. Similar tumor-ini-
tiating cells have also been found in 'solid' cancers, such as
prostate [4], breast [5], brain [6], lung [7] colon [8,9] and gas-
tric cancers [10]. We have recently shown that a rare cell pop-
ulation in human prostate cancer, defined by the phenotype
CD133
+
/α
2
β
1
hi
(high expression of α
2
β
1
integrin) and com-
prising less than 0.1% of the tumor mass, has many of the
properties of cancer stem cells [4]. In particular, self renewal,
extended lifespan (compared to normal stem cells), a high
invasive capacity, a primitive epithelial phenotype and an
ability to differentiate to recapitulate the phenotypes seen in
prostate tumors. The cancer stem cell content was not, how-
ever, dependent on prostate tumor clinical stage or grade.
Numerous groups have profiled prostate cancer using DNA
microarrays (reviewed in [11]). Despite this, the genetic
changes associated with initiation and progression of this dis-
ease remains undefined. Traditionally, expression profiling
has focused on sampling the tumor cell mass, but this does
not take into account the genetic and phenotypic heterogene-
ity of tumors. Moreover, individual genes are identified
rather than sets of genes that share a biological function. Here
we report the first expression profile of a stem cell population
from human prostate cancers. By further analyzing this
expression signature in the context of biological function, key
pathways have been identified that are associated with
inflammation, extracellular matrix interactions and stem cell
self-renewal.
Results
Identification of gene products associated with a
cancer stem cell phenotype
By comparing RNA expression patterns from stem and com-
mitted cells, independent of their disease status, 287
probesets showed significantly elevated expression in stem
cells (Welch t test, p < 0.035). Comparison of the expression
patterns from normal stem cells with those from malignant
stem cells (Gleason score >7) identified 333 probesets with
significantly increased expression in malignant cells. (Welch
t test, p < 0.1). These were combined to give a 620 probeset
'cancer stem cell signature'. The occurrence of multiple
probes for the same gene in our dataset gave us a final signa-
ture of 581 genes when we translated probe IDs to gene
names. We used hierarchical clustering to demonstrate that
the genes identified in our cancer stem cell signature could be
used to distinguish between different phenotypic groups
within our data set. The combined cancer stem cell signature
successfully separated benign from malignant samples.
Within the different disease states we found that samples
with the same differentiation state clustered together (Figure
1a). Using the separated differentiation and malignancy sig-
natures we were able to cluster samples according to their dif-
ferentiation or disease states, respectively (Figure 1b,c).
However, if data from Gleason 6 tumors or a single Gleason 7
patient, on hormone-deprivation therapy, were included in
the clustering analysis, then we were unable to distinguish
between benign and malignant samples, as well as differenti-
ation state (Figure 1d). For this reason Gleason 6 samples and
hormone refractory samples were excluded from subsequent
analyses. We also noted that in one stem cell sample a clear
differentiation signature was evident (Figure 1b, asterisk),
which was most likely due to contamination of the CD133
+
/
α
2
β
1
hi
fraction with more differentiated cells.
Although there was a clear distinction between malignant and
benign samples we used an RT-PCR based approach to screen
for the presence of the fusion transcript TMPRSS2:ERG
(transmembrane protease, serine 2:v-ets erythroblastosis
virus E26 oncogene homolog fusion product) as a further test
for tumorigenicity [12]. We found that 62% or 5 out of 8 cul-
tures (Gleason score 7 and above) expressed TMPRSS2:ERG
(Figure 2). Interestingly, a culture derived from a lymph node
metastasis of the prostate did not express the transcript
(PE704), yet expression was detected in one culture derived
from a Gleason 6 tumor.
Cancer stem cells express known prostate cancer-
associated genes
The cancer phenotype was validated by confirming the
expression levels of several established prostate cancer mark-
ers from the Affymetrix dataset by real time PCR (Figure 3a).
For example, alpha-methylacyl-CoA racemase, a phenotypic
marker identified in the first microarray experiments on
prostate cancer [13], was significantly over-expressed in
malignant samples, but under-expressed in stem cells relative
to committed cells. Similarly, matrix metalloproteinase
(MMP)9 and WNT5A were also over-expressed in malignant
samples, but not in the stem cell population. As expected,
PTEN (phosphatase and tensin homolog) showed a modest
down-regulation in malignant and stem populations as did
Cytokeratin-15, which has been shown to be associated with
the benign prostatic hyperplasia (BPH) cell type [14].
A panel of genes was selected to confirm the reproducibility of
the array data by real time PCR. Comparison of stem versus
committed populations demonstrated expression changes in
the same direction as the array data, in 10 out of the 12 genes
studied (83%), but variations in magnitude were observed
(Figure 3b). Similar results were obtained when comparing
benign and malignant samples, although some genes (4 out of
12; 33%) did display inconsistencies between microarray and
PCR assays (Figure 3c).
Genome Biology 2008, Volume 9, Issue 5, Article R83 Birnie et al. R83.3
Genome Biology 2008, 9:R83
Gene expression signature associated with the cancer
stem cell phenotype
Following the definition of the cancer stem cell signature, we
proceeded to explore the different functional groups present
in the dataset. Genes associated with inflammation were par-
ticularly prominent in this set of over-expression products. In
particular, nuclear factor κB (NF-κB) and interleukin (IL)6
were up-regulated in the cancer stem cell population, as were
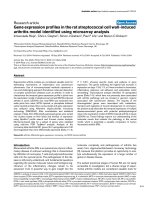
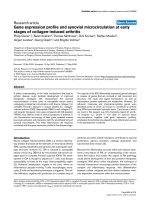
Distinctive stem cell and tumor signatures are found in human prostate cancers containing a minimum Gleason score 7 pathologyFigure 1
Distinctive stem cell and tumor signatures are found in human prostate cancers containing a minimum Gleason score 7 pathology. Clustering analysis
(derived from the Pearson correlation) using the expression data for the probesets (from 28 samples) define a cancer stem cell signature. Blue tiles
indicate down-regulated genes, and red tiles indicate up-regulated genes. (a) The combined signature clustered samples as benign (blue bar) and malignant
(red bar). Cell type (stem, CD133
+
/α
2
β
1
hi
; and committed, CD133
-
/α
2
β
1
low
) was also defined within each disease state. (b) The differentiation signature.
One sample in which a clear differentiation signature 'breakthrough' was evident in the combined signature is indicted by an asterisk. (c) Sample clustering
according to the malignancy signature. (d) Hierarchical clustering with the Gleason 6 samples and a single hormone treated sample included in the analysis.
Note that the clear distinction between non-malignant and malignant biopsies is lost by including this data.
Stem
cells
Committed
basal
Stem cells Committed
basal
Combined signature
Differentiation signature
Stem
cells
Committed
basal
Tumour Benign
Malignancy signature Gleason 6 included
(a) (b)
(c) (d)
Genome Biology 2008, 9:R83
Genome Biology 2008, Volume 9, Issue 5, Article R83 Birnie et al. R83.4
multiple genes associated with cell-cell communication and
adhesion (for example tight junction protein (TJP)2/ZO2 and
integrin alpha V). The gene showing the highest differential
expression in the cancer stem cell population, by up to four-
fold (Table 1 and Figure 3b), was that encoding the secreted
metallo-protease Pappalysin A (PAPPA) [15].
Further validation of differential expression was carried out
at the protein level using a combination of flow cytometry and
immunocytochemistry (Figure 4). Using antibodies to CD133
and NF-κB on primary tumor cultures demonstrated that
both progenitor and stem cells expressed NF-κB protein (Fig-
ure 4a). Nuclear localization of NF-κB was evident by immu-
nocytochemistry on CD133-selected tumor cells treated with
tumor necrosis factor (TNF)α (Figure 4b). This confirmed
that the active form of the protein was present in the stem cell
population. TJP1 (ZO-1) and TJP2 (ZO-2) proteins were also
expressed by the majority of progenitor and stem cells from
tumor cell cultures (Figure 4c,d), whereas only a minority of
the total cell population expressed PAPPA (Figure 4e). Never-
theless, this protein was present in a majority of the CD133
+
/
α
2
β
1
hi
population.
Parthenolide treatment affects cancer stem cells but
not normal progenitor and stem cell activity
To functionally assess the effects of blocking NF-κB signaling,
cells were treated with the sesquiterpene lactone partheno-
lide (PTL). As NF-κB is known to promote cell survival [16],
we determined whether its inhibition by PTL could preferen-
tially induce cell death in primary tumor cells while sparing
normal cells. Figure 5 shows an example of annexin V staining
of cancer and normal prostate cells in response to an 18 hour
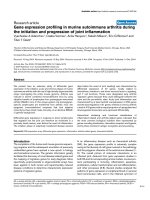
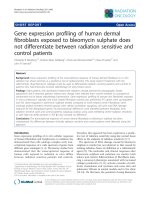
Nested RT-PCR for the detection of the TMPRSS2:ERG fusionFigure 2
Nested RT-PCR for the detection of the TMPRSS2:ERG fusion. Samples
from the microarray data set, where sufficient material was available, were
subjected to nested RT-PCR to detect the presence of the TMPRSS2:ERG
fusion product. The fusion product was detected in 6 of 10 samples and
undetectable in the remainder (samples marked ND). cDNA from the
fusion positive cell line VCaP was used as a positive control, water was
substituted in place of cDNA for the negative control.
Gleason 7+
PE434 ND
NDPE484
PE563
PE569
PE665
PE704
PE687
PE605
ND
Gleason 6
PE661
PE667
ND
Controls
VCaP
Negative
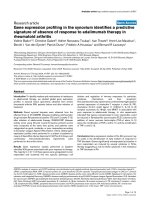
Validation of selected genes by quantitative real time PCRFigure 3
Validation of selected genes by quantitative real time PCR. (a) RT-PCR
confirmation of Affymetrix array data on genes associated with prostate
cancer (all changes in expression were significant at p < 0.05). Changes
between stem and committed cells are indicated in blue, while malignant
versus benign changes are indicated in red. (b) Validation of average
changes in gene expression between stem and committed basal
populations detected by Affymetrix array (red bars) and RT-PCR
techniques (blue bars). (c) Validation of average changes in gene
expression between malignant and benign stem cell populations detected
by Affymetrix (red bars) and RT-PCR techniques (blue bars).
-5
-3
-1
1
3
5
-6
-4
-2
0
2
4
6
(a)
Fold change in expression
AMACR MMP9 WNT5A PTEN KRT15
(b)
Fold change in expression
CSF2
EP400
ID2
IL6
ITPR2
LOXL2
MMP9
NKX3.1
PAPPA
TCF4
TIMP2
WNT5A
Stem versus committed Malignant versus benign
RT-PCR Array
-5
-3
-1
1
3
5
CSF2
EP400
ID2
IL6
ITPR2
LOXL2
MMP9
NK
X3.1
PAPPA
TCF4
TIMP2
WNT5A
(c)
Fold change in expression
Genome Biology 2008, Volume 9, Issue 5, Article R83 Birnie et al. R83.5
Genome Biology 2008, 9:R83
treatment with PTL. Although normal CD133
+
cells show
almost no loss of viability in the presence of PTL, the cancer
CD133
+
cells were strongly induced to undergo apoptosis
(from 88% to 22% viability after treatment) as were the pro-
genitor cells from cancer and normal cultures.
Functional annotation of the cancer stem cell signature
We used annotation data from the Gene Ontology (GO) [17] to
identify key functional categories within the gene expression
signature. The cancer stem cell signature was subjected to
gene set enrichment analysis (GSEA) to identify over-repre-
sented GO terms [18]. We identified 22 GO terms that were
significantly over-represented (p < 0.01) in cancer samples
within the stem cell population (Figure 6a) and 25 GO terms
significantly over-represented (p < 0.01) in cancer samples
within the committed basal population (Figure 6b). We found
17 functional concepts that were common to both stem and
committed basal populations. Mapping these 17 GO terms
against our cancer stem cell signature identified 28 genes.
Searching these 28 genes against the Kyoto Encyclopedia of
Genes and Genomes (KEGG) pathway database [19] high-
lighted 4 main pathways (Figure 6c). These pathways were
dominated by the signaling of inflammatory cytokines
through the JAK-STAT (Janus activated kinase-signal trans-
ducer and activator of transcription) pathway and the interac-
tion of cell surface receptors with the extracellular matrix and
associated downstream signaling. Our cancer stem cell signa-
ture also contained several other genes that might reasonably
be considered part of this system, but are not currently anno-
tated to known pathways in the KEGG database [19], for
example, those encoding collagens 8A1, 12A1, 16A1 and 27A1.
We then extended our search to look for components of these
pathways that were present in our gene expression signature,
but were not identified by GSEA. This search returned a total
of 8 members of the JAK-STAT pathway, 7 components of the
extracellular matrix-receptor system and 15 components of
the focal adhesion signaling pathway. It is worth noting that
five members of the focal adhesion pathway and the extracel-
lular matrix-receptor system overlap, as the focal adhesion
pathway is activated by extracellular matrix-receptor
interaction.
Discussion
Despite advances in both screening and in surgical treatment,
the long-term prognosis for patients with hormone relapsed
prostate cancer remains disappointingly poor [20]. Current
Table 1
Candidate genes whose expression is altered in the cancer stem cell population
Gene description Symbol Stem versus committed* Malignant versus benign*
Pregnancy-associated plasma protein A, pappalysin 1 PAPPA 3.83 3.26
Nuclear factor of kappa light polypeptide gene enhancer in B-cells 1 (p105) NFKB1 2.30 1.86
Tight junction protein 2 (zona occludens 2) TJP2 2.51 1.72
Abl-interactor 1 ABI1 3.41 1.84
B-cell translocation gene 1, anti-proliferative BTG1 3.95 1.53
Interleukin 6 (interferon, beta 2) IL6 1.93 5.18
CASP8 and FADD-like apoptosis regulator CFLAR 1.90 1.41
Smu-1 suppressor of mec-8 and unc-52 homolog (C. elegans) SMU1 1.90 1.63
S100 calcium binding protein A3 S100A3 1.92 1.55
Chromosome 17 open reading frame 27 C17orf27 1.63 1.80
RAS and EF-hand domain containing RASEF 2.31 1.71
Integrin, alpha V (vitronectin receptor, alpha polypeptide, antigen CD51) ITGAV 2.55 1.62
Interferon gamma receptor 1 IFNGR1 1.70 1.46
Insulin growth factor-like family member 1 IGFL1 -1.17 -28.61
Microseminoprotein, beta- (PSP94) MSMB -27.78 -2.84
Prostate stem cell antigen PSCA -20.11 -2.27
Carcinoembryonic antigen-related cell adhesion molecule 5 CEACAM5 -19.12 -1.77
S100 calcium binding protein A7 (psoriasin 1) S100A7 -11.48 2.28
Hydroxyprostaglandin dehydrogenase 15-(NAD) HPGD -8.54 -2.41
Carcinoembryonic antigen-related cell adhesion molecule 7 CEACAM7 -19.22 2.95
Trefoil factor 1 (breast cancer, estrogen-inducible sequence expressed in) TFF1 -11.74 -2.25
Prolactin-induced protein PIP -17.42 1.04
*Values are mean fold expression changes abstracted from Affymetrix datasets. Positive values (top half) indicate over expression in the cancer stem
cell samples. Negative values (bottom half) indicate genes over-expressed in the committed cell or benign cell fractions.
Genome Biology 2008, 9:R83
Genome Biology 2008, Volume 9, Issue 5, Article R83 Birnie et al. R83.6
Validation of selected genes by flow cytometry and immunocytochemistryFigure 4
Validation of selected genes by flow cytometry and immunocytochemistry. (a) Flow cytometry analysis of prostate cancer cells co-stained with antibodies
to CD133 and the NF-κB p65 subunit. (b) Confocal image of sorted CD133
+
cancer cells stained with an antibody to the NF-κB p65 subunit (green)
counterstained with DAPI (blue). Nuclear concurrence of two signals is indicated by a cyan colour. (c-e) Flow cytometry analysis of prostate cancer cells
co-stained with antibodies to CD133 and ZO1/TJP1 (c) or ZO2/TJP2 (d) or PAPPA (e).
0.01 0.16
0.33
1
0
10
0
10
1
10
2
10
3
10
4
NFκB
10
1
10
2
10
3
10
4
10
0
CD133
10
1
10
2
10
3
10
4
10
0
10
0
10
1
10
2
10
3
10
4
0.43
0.01 0.24
ZO -1
CD133
10
1
10
2
10
3
10
4
10
0
10
0
10
1
10
2
10
3
10
4
10
0
10
1
10
2
10
3
10
4
0.41
0.03 0.31
ZO -2
10
1
10
2
10
3
10
4
10
0
0.01
0.03
0.11
PAPPA
CD133
AB
CD
E
0.01 0.16
0.33
1
0
10
0
10
1
10
2
10
3
10
4
NFκκB
10
1
10
2
10
3
10
4
10
0
CD133
10
1
10
2
10
3
10
4
10
0
10
0
10
1
10
2
10
3
10
4
0.43
0.01 0.24
ZO -1
CD133
10
1
10
2
10
3
10
4
10
0
10
0
10
1
10
2
10
3
10
4
10
0
10
1
10
2
10
3
10
4
0.41
0.03 0.31
ZO -2
10
1
10
2
10
3
10
4
10
0
0.01
0.03
0.11
PAPPA
CD133
0.01 0.16
0.33
0.01 0.160.01 0.16
0.33
10
0
10
1
10
2
10
3
10
4
10
0
10
1
10
2
10
3
10
4
NF-κB
10
1
10
2
10
3
10
4
10
0
10
1
10
2
10
3
10
4
10
0
CD133
10
1
10
2
10
3
10
4
10
0
10
1
10
2
10
3
10
4
10
0
10
0
10
1
10
2
10
3
10
4
10
0
10
1
10
2
10
3
10
4
0.43
0.01 0.24
0.43
0.01 0.240.01 0.24
ZO -1
CD133
10
1
10
2
10
3
10
4
10
0
10
1
10
2
10
3
10
4
10
0
10
0
10
1
10
2
10
3
10
4
10
0
10
1
10
2
10
3
10
4
10
0
10
1
10
2
10
3
10
4
10
0
10
1
10
2
10
3
10
4
0.41
0.03 0.310.03 0.31
ZO -2
10
1
10
2
10
3
10
4
10
0
10
1
10
2
10
3
10
4
10
0
0.01
0.03
0.11
PAPPA
CD133
(a) (b)
(c) (d)
(e)
Genome Biology 2008, Volume 9, Issue 5, Article R83 Birnie et al. R83.7
Genome Biology 2008, 9:R83
tumor targeting strategies for therapy are largely based on
differentiation antigens, such as prostate specific antigen and
androgen receptor, but our previous studies have shown that
the cells that self-renew are a population of primitive cells
with the phenotype α
2
β
1
hi
/CD133
+
, which are most likely
unaffected by current chemotherapeutic regimes [4]. Accord-
ingly, previous expression array studies of prostate have been
dominated by androgen receptor-regulated gene products
derived from more abundant differentiated cells and the
higher average gene expression in these cells is likely to have
masked more subtle expression changes in rare cancer stem
cells.
Recent advances in microarray technology and target labeling
methods have opened up the possibility of performing whole
genome transcription profiling experiments from small
amounts of starting material, such as rare stem cells [21].
Dumur and colleagues [21] showed that the GeneChip Two-
cycle sample labeling method produced similar results to the
standard One-cycle method on 11 out of 12 quality control
parameters tested. There was a small bias in the 3'/5' ratio of
some genes caused by the generation of shorter products
from the Two-cycle labeling method. However, hierarchical
clustering showed that each Two-cycle labeled sample was
most closely associated with its One-cycle counterpart.
The most striking conclusion from studying highly purified
subpopulations from human prostate cancers was the ability
of the combined tumor/differentiation cancer stem cell 'sig-
nature' to distinguish benign epithelium from tumors with a
Gleason 4 morphology [22]. Interestingly, not all Gleason
score 7+ cultures expressed the TMPRSS2:ERG fusion [12],
including one lymph node metastasis, yet they clearly clus-
tered away from Gleason 6 cultures (one of which expressed
TMPRSS2:ERG). Recently, expression array analysis of
micro-dissected prostate tumors has confirmed the hypothe-
sis that the transition to Gleason pattern 4 is associated with
significant shifts in gene expression patterns [23]. Lymph
node metastases segregated with primary tumors based on
the expression signature, but preliminary results indicated
that hormone-refractory tumors form a distinct (and possibly
more heterogeneous) subgroup in terms of gene expression,
as do the Gleason 6 tumors. As the TMPRSS2:ERG gene
fusion was detected in one out of two Gleason 6 cultures
tested, and is associated with lethal prostate cancer [24], fur-
ther study of larger samples of prostate cancer stem cells from
different classes of therapy-resistant and Gleason 6 tumors is
warranted.
Despite short-term culturing, to expand the stem cell popula-
tion, the cancer signature was validated by confirming the
expression levels of several established prostate cancer mark-
ers. Alpha-methylacyl-CoA racemase, a phenotypic marker
identified in the first microarray experiments on prostate
cancer [13], was significantly over-expressed in cancer sam-
ples, as was MMP9. High MMP expression is consistent with
matrix degradation and high invasive capacity previously
reported in cancer stem cell cultures [4]. As expected, PTEN
showed a modest down-regulation in malignant and stem
populations, consistent with the haplo-insufficiency pro-
posed on the basis of transgenic mouse experiments [25] and
in recent studies of hematopoetic tumor stem cells [26].
Several studies have investigated the differences in gene
expression profiles between samples isolated directly from
tissue and those from cells cultured in vitro [27-29]. Wick et
al. [28] compared transcriptional profiles from ex vivo and in
vitro cultured samples of human dermal lymphatic endothe-
lial cells and blood endothelial cells. These authors found that
2.1% and 4.0% of transcripts were affected by culture in lym-
phatic endothelial cells and blood endothelial cells, respec-
tively. It is worth noting that this study employed different
labeling methods for in vitro and ex vivo samples, which may
partially account for the discrepancy. A similar study on
hepatic stellate cells highlighted the importance of culture
microenvironment and the appropriate use of feeder cells in
co-culture. Comparison of transcriptional profiles from
hepatic stellate cells cultured in vitro or from cells isolated
directly from tissues found substantial differences in the lists
of genes found to be differentially expressed. It was shown
that co-culture of hepatic stellate cells with Kupffer cells in
vitro (acting as feeders) shifted the gene expression profile to
a pattern that was consistent with that found in vivo [29].
This suggests that the use of feeder cells in our cultures of
cancer stem cells is likely to be important for maintaining
gene expression patterns similar to cancer stem cells in vivo.
PTL induces apoptosis in primitive cancer cellsFigure 5
PTL induces apoptosis in primitive cancer cells. Percent viability of
prostate cancer cells and cells from a patient with BPH treated with
increasing concentrations of PTL. Cells were cultured for 1 h with 100 ng/
ml TNFα prior to treatment with PTL for 18 h. Cells were subsequently
labeled with CD133-APC, Annexin-V-FITC and DAPI. Viability was defined
as annexin-V
-
/DAPI
-
on total cells. Three prostate cancer patients' samples
were analyzed and a representative profile is shown of normal CD133
+
(open circles), cancer CD133
+
(filled squares), normal progenitor (filled
circles) and cancer progenitor (open squares).
101 100
PTL (µM)
Percentage viable
120
100
80
60
40
20
0
Genome Biology 2008, 9:R83
Genome Biology 2008, Volume 9, Issue 5, Article R83 Birnie et al. R83.8
Functional annotation of the cancer stem cell expression signatureFigure 6
Functional annotation of the cancer stem cell expression signature. (a,b) Functional concepts over-represented in cancer relative to BPH within the stem
cell population (a) or within the committed basal population (b) derived from the GO. Over-represented terms are shown in red, and under-represented
terms are shown in blue. (c) Examples of key pathways and related genes involved in over represented gene ontology functions.
BPH
Cancer
GO:0005126 Hematopoietin/interferon-class (D200-domain) cytokine receptor
GO:0005581 Collagen
GO:0005605 Basal lamina
GO:0007259 JAK-STAT cascade
GO:0007565 Pregnancy
GO:0008305 Integrin complex
GO:0008483 Transaminase activity
GO:0009306 Protein secretion
GO:0009615 Response to virus
GO:0010033 Response to organic substance
GO:0015085 Calcium ion transporter activity
GO:0016032 Viral life cycle
GO:0016570 Histone modification
GO:0016769 Transferase activity, transferring nitrogenous groups
GO:0018108 Peptidyl-tyrosine phosphorylation
GO:0018212 Peptidyl-tyrosine modification
GO:0030308 Negative regulation of cell growth
GO:0030880 RNA polymerase complex
GO:0031072 Heat shock protein binding
GO:0043280 Positive regulation of caspase activity
GO:0043281 Regulation of caspase activity
GO:0044463 Cell projection part
GS
(a)
BPH
Cancer
GO:0004114 3',5'-cyclic-nucleotide phosphodiesterase activity
GO:0005126 Hematopoietin/interferon-class (D200-domain) cytokine receptor
GO:0005581 Collagen
GO:0005605 Basal lamina
GO:0005665 DNA-directed RNA polymerase II, core complex
GO:0007259 JAK-STAT cascade
GO:0007565 Pregnancy
GO:0007586 Digestion
GO:0008483 Transaminase activity
GO:0009615 Response to virus
GO:0010033 Response to organic substance
GO:0016032 Viral life cycle
GO:0016570 Histone modification
GO:0016769 Transferase activity, transferring nitrogenous groups
GO:0018108 Peptidyl-tyrosine phosphorylation
GO:0018212 Peptidyl-tyrosine modification
GO:0030155 Regulation of cell adhesion
GO:0030880 RNA polymerase complex
GO:0031072 Heat shock protein binding
GO:0043280 Positive regulation of caspase activity
GO:0043281 Regulation of caspase activity
GO:0044463 Cell projection part
GO:0045792 Negative regulation of cell size
GO:0045926 Negative regulation of growth
GO:0051345 Positive regulation of hydrolase activity
GS
(b)
(c)
KEGG ID Pathway Key genes
hsa04630 JAK-STAT signaling IFNK, IFNGR, IL6, CSF2, STAT1
hsa04512 ECM-receptor interaction COL5A1, LAMA1, LAMC1
hsa04510 Focal adhesion COL5A1, LAMA1, LAMC1
WNT signaling WNT5A, PPA2, CtBP
hsa04310
Genome Biology 2008, Volume 9, Issue 5, Article R83 Birnie et al. R83.9
Genome Biology 2008, 9:R83
Expression of multiple genes associated with cell-cell com-
munication and adhesion was associated with the cancer
stem cell population. These expression products have been
implicated in tissue integrity [30] and the normal stem cell
'niche' [31,32]. The gene showing the highest differential
expression in the cancer stem cell population was that encod-
ing PAPPA [15]. This pregnancy-associated plasma protein
specifically cleaves insulin-like growth factor binding protein
(IGFBP)-4 and IGFBP-5. Proteolysis of IGFBPs regulates the
bioavailability of IGFs, and because of the association
between IGF levels and prostate cancer [33], strategies for the
direct inhibition of IGF signaling, by inhibiting proteolytic
activity, is a potential therapeutic strategy and would likely
not interfere with insulin signaling [34].
We used a panel of genes, based on their known association
with prostate biology and cancer, to confirm the reproducibil-
ity of the array data. Most genes were consistent, but we did
note discrepancies, particularly between the malignant and
benign RT-PCR results, which may be due to patient variabil-
ity. In all cases where discrepancy exists, the fold change in
expression as measured by RT-PCR was less than two and
these small differences are difficult to reproduce accurately.
In some cases the absolute expression levels of the genes were
quite low, which makes them more sensitive to small fluctua-
tions. The discrepancy could also be caused by the use of
probes targeted to different regions of the transcript. Real-
time PCR probes are commonly designed against the consen-
sus sequence of the known transcripts for the target gene.
Microarrays carry multiple probes against the same gene dis-
tributed throughout the length of the transcript, some of
which detect only a subset of the known transcripts for the
target gene.
Despite this, our data suggest that the transcription factor
NF-κB may be a promising therapeutic target as PTL, which
acts directly on NF-κB and prevents it entering the nucleus,
appeared to promote selective cell death of the cancer-specific
CD133 population. Similar results have been demonstrated
for leukemic CD34
+
stem cells, with normal CD34 cells spared
from apoptosis [35].
Functional annotation of the cancer stem cell signature by
GSEA led us to four main pathways: JAK-STAT signaling; cell
adhesion and extracellular matrix-interactions; focal adhe-
sion signaling; and WNT signaling. There is a substantial
body of work linking Wnt signaling with stemness and malig-
nant behavior (reviewed in [36]). With respect to prostate
cancer, Wnt signaling has been linked to progression to
androgen-independence and bone metastasis [37,38].
Extracellular matrix-receptor signaling and the focal adhe-
sion pathway can be considered part of the same system, as
the focal adhesion pathway is activated by extracellular
matrix-receptor interaction. Changes in extracellular matrix
and associated proteins have been reported in the metastatic
progression of prostate cancer [39], and activation of Focal
adhesion kinase through α
5
β
1
integrin/fibronectin has previ-
ously been implicated in regulating the invasiveness of pros-
tate cancer cells via activation of phosphatidylinositol-3,4,5-
trisphosphate kinase [40]. The JAK-STAT pathway could also
be considered to overlap with this system since focal adhesion
signaling, as defined in the KEGG database, can be activated
by cytokine-cytokine receptor interaction, which is also the
major activation method of the JAK-STAT pathway. In addi-
tion, JAK-STAT and focal adhesion signaling share several
common components, such as the GRB-SOS (growth factor
receptor-bound protein 2-son of sevenless) complex and the
phosphatidylinositol-3,4,5-trisphosphate kinase/Akt axis.
The involvement of IL6 and the JAK-STAT pathway in
advanced prostate cancer is well known [41,42]. More
recently, STAT1 has emerged as a potential mediator of drug
resistance in prostate cancer [43] and may present a potential
therapeutic target.
Conclusion
Our ability to select and culture stem cell populations will
now allow us to determine the genotype of these cells for per-
manent (mutagenic) changes, such as characteristic translo-
cations [12] and the presence of epigenetic control [44]. We
should also now be able to monitor the effects of novel thera-
peutics on the cancer stem cell population. Advances in viable
cell separation technology and the first detailed expression
signature reported here now provide the means to update and
ultimately test the cancer stem cell hypothesis in a common
non-hematological tumor.
Materials and methods
Tissue collection, isolation, and culture of tumor stem
cells
Human prostate tissue was obtained, with patient consent,
from 12 patients undergoing radical prostatectomy and
transurethral resection for prostate cancer and 7 patients
undergoing transurethral resection of the prostate for benign
prostatic hyperplasia (age range 52-79 years; Table 2). Pros-
tate cancer was confirmed by: histological examination of
representative adjacent fragments; in vitro invasion [4]; and
expression of the fusion product TMPSS2:ERG [12] (Figure
2). To preclude the need for extensive enzymatic amplifica-
tion cycles prior to Affymetrix analysis, cultures were gener-
ated from isolated stem cells (CD133
+
/α
2
β
1
hi
), as described
previously [4]. In some cases, cultures were derived initially
from the more abundant α
2
β
1
hi
population (which contains
the CD133
+
fraction), usually from small biopsies (lymph
node metastasis and core biopsies of the prostate).
Nested RT-PCR for the detection of the TMPRSS2:ERG
fusion
RNA was extracted from prostate tissue using the Qiagen
RNeasy kit (Qiagen, Crawley, UK) following the manufac-
Genome Biology 2008, 9:R83
Genome Biology 2008, Volume 9, Issue 5, Article R83 Birnie et al. R83.10
turer's instructions. The RNA was reverse transcribed using
random hexamers and reverse transcriptase (Superscript III,
Invitrogen, Paisley, UK).
Specific primers were used to detect the presence of the
TMPRSS2:ERG fusion by nested RT-PCR (first step, forward
5'-CGC GAG CTA AGC AGG AGG C-3' and reverse 5'-GGC
GTT GTA GCT GGG GGT GAG-3'; 2nd step, forward 5'-GGA
GCG CCG CCT GGA G-3' and reverse 5'-CCA TAT TCT TTC
ACC GCC CAC TCC-3'; Invitrogen). Each PCR reaction con-
tained 1 μM of the respective forward and reverse primers, 1.5
mM MgCl
2
, 0.2 mM dNTPs and 1 U Taq polymerase (GoTaq,
Promega, Southampton, UK). The PCR conditions were
adapted from those of Clarke et al. [45]. Briefly, the first step
PCR conditions were 94°C for 30 s followed by 35 cycles of
94°C for 20 s and an extension step of 68°C for 1 minute.
There was no annealing step as the region amplified is very
GC rich. The second step conditions were 94°C for 30 s, 35
cycles of 94°C for 20 s, 66°C for 10 s and 68°C for 1 minute fol-
lowed by 68°C for 7 minutes.
PCR products were separated by electrophoresis through a
1.5% agarose GelRed (Invitrogen) stained gel for 1 h at 80 V.
PCR products were visualized using a Gene Genius bio-imag-
ing system.
Array sample and data processing
Total RNA extraction
Total RNA was extracted from up to 1 × 10
4
CD133
+
/α
2
β
1
hi
selected cells from malignant and non-malignant cultures
using Qiagen RNeasy micro-columns according to the manu-
facturer's protocol. For CD133
-
/α
2
β
1
low
cells, total RNA was
extracted from between 1 × 10
5
and 1 × 10
6
selected cells using
Qiagen RNeasy mini-columns. RNA yields were determined
spectrophotometrically at 260 nm and RNA integrity checked
by capillary electrophoresis using an Agilent 2100 bioana-
lyzer (Agilent, South Queensferry, UK).
Production of fragmented labeled cRNA
Total RNA (10-50 ng) was amplified using two rounds of
cDNA synthesis and in vitro transcription, and biotin labeled
by following the Affymetrix small scale labeling protocol VII
[46], omitting the T4 DNA polymerase steps in the two sec-
ond strand cDNA synthesis reactions and using the Affyme-
trix GeneChip in vitro transcription labeling kit for the
second cycle in vitro transcription for cRNA amplification
and labeling. The Affymetrix eukaryotic sample and array
processing standard protocol was followed at this stage and
the quality of first and second round cRNA products and
fragmented cRNA was checked by capillary electrophoresis
using an Agilent 2100 bioanalyzer.
Table 2
Summary of patient population and invasive characteristics of corresponding stem cell cultures in vitro
Patient number Age (years) Origin Gleason score % Invasion in vitro*
228 - LN metastasis 7 101 ± 21
434 59 Prostate 8/9 99 ± 56
484 69 Prostate 7 105 ± 29
512 74 Prostate BPH -
561 72 Prostate BPH -
563 64 Prostate 7 35 ± 9.5
569 64 Prostate 8 75 ± 9
574 74 Prostate BPH/G6 (5%) -
605 56 LN metastasis 7 119 ± 21
661 78 Prostate 6 -
627 79 Prostate BPH -
662 66 Prostate BPH -
665 53 Prostate 7 63 ± 18.4
667 47 Prostate 6 61 ± 4.2
687 63 Prostate 7 74
690 79 Prostate BPH -
693 75 Prostate BPH -
704 64 Prostate 7 (HR) -
003/06 52 Prostate 6 -
*Invasion assays were carried out on total epithelial cell populations before fractionation according to [4]. Positive controls for invasive capacity
were cell lines MCF7 and PC3M whose invasion score was 18-36%, whereas normal cell lines PNT2 and PNT1a and BPH/primary normal prostate
invasion scores ranged from 3-6%. Patient 704 was being treated (hormone refractory (HR)) by androgen blockade therapy.
Genome Biology 2008, Volume 9, Issue 5, Article R83 Birnie et al. R83.11
Genome Biology 2008, 9:R83
Array hybridization
Labeled fragmented cRNA (10 μg) was hybridized to oligonu-
cleotide probes on an Affymetrix HG-U133plus2 GeneChip,
according to the hybridization, washing, staining and scan-
ning procedure in the Affymetrix eukaryotic sample and array
processing standard protocol (Affymetrix Fluidics Station
450 using the EukGE-WS2v5 protocol). Final scanning of the
arrays was carried out with an Affymetrix Gene Scanner
3000. The raw data are available in the ArrayExpress Data-
base (accession E-MEXP-993).
Data processing
Scanned GeneChip images were processed using Affymetrix
GCOS 1.2 software to derive an intensity value and flag
(present, marginal or absent) for each probe. Probe intensi-
ties were derived using the MAS5.0 algorithm. Comparisons
between different sample datasets were conducted using
Agilent GeneSpring GX software. Datasets to be compared
were first normalized using three steps (consecutively applied
in the order given): by transforming values <0.01 to 0.01;
normalizing each chip to the median of the measurements
taken for that chip; and finally normalizing each probe to the
median of the measurements for that probe. Low quality or
uninformative data were removed using three selections
(consecutively applied as follows): probes flagged 'absent' in
all samples; probes with standard deviation within a parame-
ter class of >1 in at least three of the four conditions; and
probes with less than a two-fold overall change in normalized
expression value between all four of the conditions.
Statistical analysis
The gene expression profile of CD133
+
/α
2
β
1
hi
and CD133
-
/
α
2
β
1
low
prostate cancer cells were compared with benign
CD133
+
/α
2
β
1
hi
and CD133
-
/α
2
β
1
low
prostate epithelial cells.
Statistical analysis of the transcription profiles was derived
from patients with Gleason score 7 cancers and above.
Gleason score 6 biopsies, and one Gleason score 7 biopsy
(from a patient who had received hormone therapy) were
excluded (Table 1).
Following removal of low quality or uninformative data (see
'Data processing') samples were subjected to a two-way
ANOVA test to identify significant (p < 0.05) changes
between malignant and benign populations and between
stem (CD133
+
/α
2
β
1
hi
) and committed (CD133
-
/α
2
β
1
low
) popu-
lations. Gene expression changes in benign versus malignant
cells (within the stem cell population) was compared using a
Welch t test. A second Welch t test was used to compare stem
and committed populations independent of their disease sta-
tus. To define signature probesets for the cancer stem cell
population, the Benjamini and Hochberg false discovery rate
multiple testing correction was applied to the results of Welch
t tests between the cell populations, resulting in a corrected
critical value of p < 0.035. This value was used in the compar-
ison of stem and committed populations, independent of
their disease status, to define a stem cell-specific expression
signature. When comparing malignant against benign sam-
ples very few probesets were significantly different at p <
0.035, resulting in a combined cell type/malignancy signa-
ture that was biased in favor of cell differentiation character-
istics. To compensate for this, the critical value was adjusted
to p < 0.1 for the comparison of benign and malignant com-
ponents within the stem cell population. Those genes found to
be significantly over-expressed in stem cells were combined
with genes significantly over-expressed in malignant samples
to generate a malignant stem cell signature.
Quantitative reverse transcriptase PCR
Reverse transcription was carried out on cDNA generated
from 50 ng of fractionated cell RNA purified as described
above. This was either prepared freshly from RNA or taken
from the second round cDNA synthesis for Affymetrix arrays
(see above) where starting material was limiting. cDNA gen-
erated from the cell lines P4E6 [47] and PC346C (kindly pro-
vided by Nefkens Institute, Erasmus University, Rotterdam)
was combined in a 1:1 ratio and used to generate the standard
curve for each assay. Real time PCR was carried out using
TaqMan gene expression pre-synthesized reagents and
master mix (Applied Biosystems, Warrington, UK). Reactions
were prepared following the manufacturers protocol except
that a reduced total volume of 25 μl was used. All reactions
were carried out in triplicate on 96-well PCR plates (ABgene,
Epsom, UK) in an ABI PRISM 7000 sequence detection
system (Applied Biosystems). Standard thermal cycling con-
ditions included a hot start of 5 minutes at 50°C, 10 minutes
at 95°C, followed by up to 50 cycles of: 95°C 15 s, 60°C for 1
minute. Data analysis was carried out using ABI SDS software
and Microsoft Excel. Expression values are presented relative
to the geometric mean of the measurements for three endog-
enous control genes (GAPDH, ITGB1 and PPIA) in the corre-
sponding samples.
Functional annotation of the prostate cancer stem cell
signature
Genes found to be differentially expressed were analyzed for
over representation of GO terms to identify important func-
tional categories for further study [17]. Analysis was per-
formed using the PGSEA package for the R environment
available through the Bioconductor project [18,48,49]. Our
analysis was designed to identify GO terms that were signifi-
cantly over-represented (p < 0.01) in cancer versus benign
samples within the stem cell population or within the com-
mitted population. We then mapped significant GO terms
back to the cancer stem cell signature to identify the individ-
ual genes involved. These genes were then searched against
the KEGG pathway database [19] to identify the critical
pathways.
Validation by immunocytochemistry and flow
cytometry
CD133
+
/α
2
β
1
hi
cells were selected from cultured cells before
processing for dual-color imaging under confocal microscopy
Genome Biology 2008, 9:R83
Genome Biology 2008, Volume 9, Issue 5, Article R83 Birnie et al. R83.12
by fixation in a 50:50 mix of ice-cold methanol/acetone or 4%
paraformaldehyde in phosphate-buffered saline. After block-
ing with 20% normal serum in Tris buffered saline, cells were
incubated with monoclonal antibodies against the NF-κB p65
subunit (Chemicon International, Hampshire, UK) or a non-
specfic isotype control. Appropriate positive control cells
were stained in parallel for each antibody. After washing (3 ×
Tris buffered saline), cells were labeled with Alexa Fluor
®
488-tagged secondary antibody (Invitrogen). Cells were
mounted in the anti-photobleaching medium Vectashield
containing 4',6-diamino-2-phenylindole (DAPI; Vector Labo-
ratories, Peterborough, UK). Cultured cells were processed
for dual-color staining flow cytometry as described previously
[4]. Cells were co-stained with CD133 (clone 293C; Miltenyi
Biotec Ltd, Bisley, UK) and antibodies to Pappalysin 1A (a
kind gift from Dr Claus Oxvig, University of Aarhus, Den-
mark) or ZO-1 (clone ZO1-1A12), ZO-2 (clone 3E8D9; Zymed
Laboratories Inc., San Franscisco, CA, USA) and the NF-κB
p65 subunit (Chemicon International). Cells were separated
on a DakoCytomation CyAn high-performance flow cytome-
ter and analyzed using DakoCytomation Summit version 3.3
software.
Apoptosis assay
Unselected cells were treated for 18 h with increasing concen-
trations of PTL in the presence of TNFα. Cells were subse-
quently stained with anti-CD133-APC (anti-CD133-
allophycocyanin; Miltenyi Biotec Ltd) for 10 minutes on ice.
Cells were then washed in cold magnetic assisted cell sorting
(MACS) buffer and resuspended in annexin binding buffer
(10 mM HEPES/NaOH, pH 7.4, 140 mM NaCl, 2.5 mM
CaCl
2
). Annexin V-FITC (Pharmingen, Oxford, UK) and 0.25
μg/ml DAPI were then added for 15 minutes before analysis
by flow cytometry. The percent viable cells was defined as
annexin-V
-
/DAPI
-
cells on total (ungated) cells and on gates
set for CD133
+
populations. The total number of events col-
lected was between 1 × 10
5
to 1 × 10
6
depending on the CD133
content of the sample.
Abbreviations
BPH, benign prostatic hyperplasia; DAPI, 4',6-diamino-2-
phenylindole; GO, Gene Ontology; GSEA, gene set enrich-
ment analysis; IGF, insulin-like growth factor; IGFBP, IGF
binding protein; IL, interleukin; JAK, Janus activated kinase;
KEGG, Kyoto Encyclopedia of Genes and Genomes; MMP,
matrix metalloproteinase; NF-κB, nuclear factor κB; PAPPA,
Pappalysin A; PTEN, phosphatase and tensin homolog; PTL,
parthenolide; STAT, signal transducer and activator of tran-
scription; TJP, tight junction protein; TMPRSS2:ERG, trans-
membrane protease, serine 2:v-ets erythroblastosis virus E26
oncogene homolog fusion product; TNF, tumor necrosis
factor.
Authors' contributions
RB performed microarray functional data analysis and
drafted the manuscript. SDB carried out the microarray
experiments and intital data analysis. CR performed the NF-
κB inhibitor studies. VD carried out qRT-PCR assays. AD was
involved in data analysis and design. SL performed the stem
cell isolations from benign samples. PB performed stem cell
isolations from tumors. CH performed culturing and isolation
of stem cells, and NF-κB experiments. JLL performed the RT-
PCR detection of the TMPRSS:ERG fusion product. MS is the
surgeon who provided the patient samples, pathology results
and other clinical data. NJM participated in the study design
and co-ordination. AC participated in study design, analysis
of experiments, writing of the manuscript and coordination of
the study.
Acknowledgements
This research was supported by program support from Yorkshire Cancer
Research and the UK National Cancer Research Institute (NCRI). Further
program support was provided by the US Department of Defense (New
ideas grant W81xWH-06-1-0082). We would also like to thank Dr Claus
Oxvig, University of Aarhus, Denmark, for his gift of antisera against the
PAPPA protein and the staff of the Biology Technology Facility, University
of York.
References
1. Hamburger AW, Salmon SE: Primary bioassay of human tumor
stem cells. Science 1977, 197:461-463.
2. Pardal R, Clarke MF, Morrison SJ: Applying the principles of
stem-cell biology to cancer. Nat Rev Cancer 2003, 3:895-902.
3. Bonnet D, Dick JE: Human acute myeloid leukemia is organ-
ized as a hierarchy that originates from a primitive hemat-
opoietic cell. Nat Med 1997, 3:730-737.
4. Collins AT, Berry PA, Hyde C, Stower MJ, Maitland NJ: Prospective
identification of tumorigenic prostate cancer stem cells. Can-
cer Res 2005, 65:10946-10951.
5. Al-Hajj M, Wicha MS, Benito-Hernandez A, Morrison SJ, Clarke MF:
Prospective identification of tumorigenic breast cancer cells.
Proc Natl Acad Sci USA 2003, 100:3983-3988.
6. Singh SK, Hawkins C, Clarke ID, Squire JA, Bayani J, Hide T, Henkel-
man RM, Cusimano MD, Dirks PB: Identification of human brain
tumor initiating cells. Nature 2004, 432:396-401.
7. Kim CF, Jackson EL, Woolfenden AE, Lawrence S, Babar I, Vogel S,
Crowley D, Bronson RT, Jacks T: Identification of bronchioalve-
olar stem cells in normal lung and lung cancer. Cell 2005,
121:823-835.
8. O'Brien CA, Pollett A, Gallinger S, Dick JE: A human colon cancer
cell capable of initiating tumor growth in immunodeficient
mice. Nature 2007, 445:106-110.
9. Ricci-Vitiani L, Lombardi DG, Pilozzi E, Biffoni M, Todaro M, Peschle
C, De Maria R: Identification and expansion of human colon-
cancer-initiating cells. Nature 2007, 445:111-115.
10. Houghton J, Stoicov C, Nomura S, Rogers AB, Carlson J, Li H, Cai X,
Fox JG, Goldenring JR, Wang TC: Gastric cancer originating
from bone marrow-derived cells. Science 2004, 306:1568-1571.
11. Nelson PS: Predicting prostate cancer behavior using tran-
script profiles. J Urol 2004, 172(Suppl):S28-S32.
12. Tomlins SA, Rhodes DR, Perner S, Dhanasekaran SM, Mehra R, Sun
X-W, Varambally S, Cao X, Tchinda J, Kuefer R, Lee C, Montie JEB,
Shah RB, Pienta KJ, Rubin MA, Chinnaiyan AM: Recurrent fusion of
TMPRSS2 and ETS transcription factor genes in prostate
cancer. Science 2005, 310:644-648.
13. Rubin MA, Zhou M, Dhanasekaran SM, Varambally S, Barrette TR,
Sanda MG, Pienta KJ, Ghosh D, Chinnaiyan AM: α-Methylacyl coen-
zyme A racemase as a tissue biomarker for prostate cancer.
JAMA 2002, 287:1662-1670.
14. Stuart RO, Wachsman W, Berry CC, Wang-Rodriguez J, Wasserman
L, Klacansky I, Masys D, Arden K, Goodison S, McClelland M, Wang
Genome Biology 2008, Volume 9, Issue 5, Article R83 Birnie et al. R83.13
Genome Biology 2008, 9:R83
Y, Sawyers A, Kalcheva I, Tarin D, Mercola D: In silico dissection of
cell-type-associated patterns of gene expression in prostate
cancer. Proc Natl Acad Sci USA 2004, 101:615-620.
15. Oxvig C, Sand O, Kristensen T, Gleich GJ, Sottrup-Jensen L: Circu-
lating human pregnancy-associated plasma protein-A is
disulfide-bridged to the proform of eosinophil major basic
protein. J Biol Chem 1993, 268:12243-12246.
16. Luo J-L, Kamata H, Karin M: IKK/NF-κB signaling: balancing life
and death - a new approach to cancer therapy. J Clin Invest
2005, 115:2625-2632.
17. Ashburner M, Ball CA, Blake JA, Botstein D, Butler H, Cherry JM,
Davis AP, Dolinski K, Dwight SS, Eppig JT, Harris MA, Hill DP, Issel-
Tarver L, Kasarskis A, Lewis S, Matese JC, Richardson JE, Ringwald M,
Rubin GM, Sherlock G: Gene Ontology: tool for the unification
of biology. Nature Genet 2000, 25:25-29.
18. Furge KA, Chen J, Koeman J, Swiatek P, Dykema K, Lucin K, Kahnoski
R, Yang XJ, Teh BT: Detection of DNA copy number changes
and oncogenic signaling abnormalities from gene expression
data reveals MYC activation in high-grade papillary renal cell
carcinoma. Cancer Res 2007, 67:3171-3176.
19. Kanehisa M, Goto S, Hattori M, Aoki-Kinoshita KF, Itoh M,
Kawashima S, Katayama T, Araki M, Hirakawa M: From genomics
to chemical genomics: new developments in KEGG. Nucleic
Acids Res 2006, 34(Database issue):D354-D357.
20. Tannock IF, de Wit R, Berry WR, Horti J, Pluzanska A, Chi KN,
Oudard S, Théodore C, James ND, Turesson I, Rosethal MA, Eisen-
berger MA, TAX 327 Investigators: Docetaxel plus prednisone or
mitoxantrone plus prednisone for advanced prostate cancer.
N Engl J Med 2004, 351:1502-1512.
21. Dumur CI, Garrett CT, Archer KJ, Nasim S, Wilkinson DS, Ferreira-
Gonzalez A: Evaluation of a linear amplification method for
small samples used on high-density oligonucleotide microar-
ray analysis. Anal Biochem 2004, 331:314-321.
22. Gleason D:
Classification of prostate carcinomas. Cancer Chem-
other Rep 1996, 50:125-128.
23. True L, Coleman I, Hawley S, Huang C-Y, Gifford D, Coleman R, Beer
TM, Gelmann E, Datta M, Mostaghel E, Knudsen B, Lange P, Vessella
R, Lin D, Hood L, Nelson PS: A molecular correlate to the
Gleason grading system for prostate adenocarcinoma. Proc
Natl Acad Sci USA 2006, 103:10991-10996.
24. Demichelis F, Fall K, Perner S, Andrén O, Schmidt F, Setlur SR, Hosh-
ida Y, Mosquera J-M, Pawitan Y, Lee C, Adami H-O, Mucci LA, Kantoff
PW, Andersson S-O, Chinnaiyan AM, Johansson J-E, Rubin MA:
TMPRSS2:ERG gene fusion associated with lethal prostate
cancer in a watchful waiting cohort. Oncogene 2007,
26:4596-4599.
25. Trotman LC, Niki M, Dotan ZA, Koutcher JA, Cordon-Cardo C, Pan-
dolfi PP: Pten dose dictates cancer progression in the
prostate. PLoS Biol 2003, 1:e59.
26. Yilmaz OH, Valdez R, Theisen BK, Guo W, Ferguson DO, Wu H,
Morrison SJ: Pten dependence distinguishes haematopoietic
stem cells from leukaemia-initiating cells. Nature 2006,
441:475-482.
27. Liu XS, Zhang ZG, Zhang RL, Gregg SR, Meng H, Chopp M: Com-
parison of in vivo and in vitro gene expression profiles in sub-
ventricular zone neural progenitor cells from the adult
mouse after middle cerebral artery occlusion. Neuroscience
2007, 146:1053-1061.
28. Wick N, Saharinen P, Saharinen J, Gurnhofer E, Steiner CW, Raab I,
Stokic D, Giovanoli P, Buchsbaum S, Burchard A, Thurar S, Alitalo K,
Kerjaschki D: Transcriptomal comparison of human dermal
lymphatic endothelial cells ex vivo and in vitro. Physiol Genomics
2007, 28:179-192.
29. De Menicis S, Seki E, Uchinami H, Kluwe J, Zhang Y, Brenner DA,
Schwabe RF: Gene expression profiles during hepatic stellate
cell activation in culture and in vivo. Gastroenterology 2007,
132:1937-1946.
30. Matter K, Balda MS: Signalling to and from tight junctions. Nat
Rev Mol Cell Biol 2003,
4:225-236.
31. Jones PH, Harper S, Watt FM: Stem cell patterning and fate in
human epidermis. Cell 1995, 80:83-93.
32. Shinohara T, Avarbock MR, Brinster RL: β
1
- and α
6
-integrin are
surface markers on mouse spermatogonial stem cells. Proc
Natl Acad Sci USA 1999, 96:5504-5509.
33. Chan JM, Stampfer MJ, Giovannucci E, Gann PH, Ma J, Wilkinson P,
Hennekens CH, Pollak M: Plasma insulin-like growth factor-I
and prostate cancer risk: a prospective study. Science 1998,
279:563-566.
34. Gyrup C, Oxvig C: Quantitative analysis of insulin-like growth
factor-modulated proteolysis of insulin-like growth factor
binding protein-4 and -5 by pregnancy-associated plasma
protein-A. Biochemistry 2007, 46:1972-1980.
35. Guzman ML, Rossi RM, Karnischky L, Li X, Peterson DR, Howard DS,
Jordan CT: The sequesterpene lactone parthenolide induces
apoptosis of human acute myelogeneous leukaemia stem
and progenitor cells. Blood 2005, 105:4163-4169.
36. Fodde R, Brabletz T: Wnt/beta-catenin signaling in cancer
stemness and malignant behavior. Curr Opin Cell Biol 2007,
19:150-158.
37. Verras M, Sun Z: Roles and regulation of Wnt signaling and
beta-catenin in prostate cancer. Cancer Lett 2006, 237:22-32.
38. Hall CL, Kang S, MacDougal OA, Keller ET: Role of Wnts in pros-
tate cancer bone metastases. J Cell Biochem 2006, 97:661-672.
39. Stewart DA, Cooper CR, Sikes RA: Changes in extracellular
matrix (ECM) and ECM-associated proteins in the meta-
static progression of prostate cancer. Reprod Biol Endocrinol
2004, 2:2.
40. Zeng ZZ, Jia Y, Hahn NJ, Markwart SM, Rockwood KF, Livant DL:
Role of focal adhesion kinase and phosphatidylinositol 3'-
kinase in integrin fibronectin receptor-mediated matrix
metalloproteinase-1-dependent invasion by metastatic pros-
tate cancer cells. Cancer Res 2006, 66:8091-8099.
41. Culig Z, Steiner H, Bartsch G, Hobisch A: Interleukin-6 regulation
of prostate cancer cell growth. J Cell Biochem 2005, 95:497-505.
42. Mora LB, Buettner R, Seigne J, Diaz J, Ahmad N, Garcia R, Bowman
T, Falcone R, Fairclough R, Cantor A, Muro-Cacho C, Livingston S,
Karras J, Pow-Sang J, Jove R:
Constitutive activation of Stat3 in
human prostate tumors and cell lines: direct inhibition of
Stat3 signaling induces apoptosis of prostate cancer cells.
Cancer Res 2002, 62:6659-6666.
43. Patterson SG, Wei S, Chen X, Sallman DA, Gilvary DL, Zhong B, Pow-
Sang J, Yeatman T, Djeu JY: Novel role of Stat1 in the
development of docetaxel resistance in prostate tumor cells.
Oncogene 2006, 25:6113-6122.
44. Feinberg AP, Ohlsson R, Henikoff S: The epigenetic progenitor
origin of human cancer. Nat Rev Genet 2006, 7:21-33.
45. Clark J, Merson S, Flohr P, Edwards S, Foster CS, Eeles R, Martin FL,
Phillips DH, Crundwell M, Christmas T, Thompson A, Fisher C,
Kovacs G, Cooper CS: Diversity of TMPRSS2-ERG fusion tran-
scripts in the human prostate. Oncogene 2007, 26:2667-2673.
46. Affymetrix GeneChip Expression Analysis Technical Manual
VII [ />expression_manual.affx]
47. Maitland NJ, Macintosh CA, Hall J, Sharrard M, Quinn G, Lang S: In
vitro models of study cellular differentiation and function in
human prostate cancers. Radiat Res 2001, 155:133-142.
48. R Development Core Team: R: a Language and Environment for Statis-
tical Computing. Vienna, Austria: R Foundation for Statistical
Computing; 2006.
49. Gentleman RC, Carey VJ, Bates DM, Bolstad B, Dettling M, Dudoit S,
Ellis B, Gautier L, Ge Y, Gentry J, Hornik K, Hothorn T, Huber W,
Iacus S, Irizarry R, Leisch F, Li C, Maechler M, Rossini AJ, Sawitzki G,
Smith C, Tierney L, Yang JY, Zhang J: Bioconductor: open soft-
ware development for computational biology and
bioinformatics. Genome Biol 2004, 5:R80.