Báo cáo y học: " Sequence-based prediction of protein-protein interactions by means of codon usage" doc
Bạn đang xem bản rút gọn của tài liệu. Xem và tải ngay bản đầy đủ của tài liệu tại đây (439.39 KB, 9 trang )
Genome Biology 2008, 9:R87
Open Access
2008Najafabadi and SalavatiVolume 9, Issue 5, Article R87
Method
Sequence-based prediction of protein-protein interactions by
means of codon usage
Hamed Shateri Najafabadi
*†
and Reza Salavati
*†‡
Addresses:
*
Institute of Parasitology, McGill University, Lakeshore Road, Ste. Anne de Bellevue, Montreal, Quebec H9X 3V9, Canada.
†
McGill
Centre for Bioinformatics, McGill University, University Street, Montreal, Quebec H3A 2B4, Canada.
‡
Department of Biochemistry, McGill
University, Promenade Sir William Osler, Montreal, Quebec H3G 1Y6, Canada.
Correspondence: Reza Salavati. Email:
© 2008 Najafabadi and Salavati; licensee BioMed Central Ltd.
This is an open access article distributed under the terms of the Creative Commons Attribution License ( which
permits unrestricted use, distribution, and reproduction in any medium, provided the original work is properly cited.
Predicting protein-protein interactions<p>A new approach based on similarity in codon usage is used to predict protein-protein interactions.</p>
Abstract
We introduce a novel approach to predict interaction of two proteins solely by analyzing their
coding sequences. We found that similarity in codon usage is a strong predictor of protein-protein
interactions and, for high specificity values, is as sensitive as the most powerful current prediction
methods. Furthermore, combining codon usage with other predictors results in a 75% increase in
sensitivity at a precision of 50%, compared to prediction without considering codon usage.
Background
The need to transform the growing amount of biological
information into knowledge has involved several disciplines
that, by means of experimental and computational
approaches, aim to decipher functional linkages and interac-
tions between proteins [1,2]. Current computational methods
for predicting protein-protein interactions demand data that,
compared to the huge amount of available genomic
sequences, are scarce. Only in a few organisms have features
such as essentiality, biological function and mRNA co-expres-
sion of genes been partially determined. Also, a combination
of different homology-based predictors, including phyloge-
netic profiles [3], Rosetta stone [4] and interolog mapping
[5], has provided incomplete information about interactions
of only one-third of all Saccharomyces cerevisiae proteins.
Hence, a method to identify protein-protein interactions
solely on the basis of gene sequences would significantly
expand the ability to predict interaction networks.
A few studies have been performed on the prediction of pro-
tein-protein interactions based only on amino acid sequence
information [6-8]. However, the highest specificity reported
in these studies is 86%. Considering the number of possible
protein pairs in a genome consisting of no more than 6,000
protein-coding genes, this level of specificity results in the
unacceptable number of 2.5 × 10
6
false positives. These stud-
ies consider protein sequences, and ignore the plethora of
information that exists in their coding sequences. The still-
unsatisfied demand for reliable sequence-based prediction of
protein-protein interactions encourages exploration of rele-
vant sequence features in the genome instead of the
proteome.
It has been widely acknowledged that codon usage is corre-
lated with expression level [9]. In addition, it has been shown
that codon usage is structured along the genome [10], with
near neighbor genes having similar codon compositions.
Some function-specific codon preferences have also been
hypothesized based on selective charging of tRNA isoaccep-
tors [11] and have been confirmed experimentally [12]. Based
on these premises and considering that similarity in mRNA
expression pattern and biological function, along with physi-
cal gene proximity, are powerful predictors of protein-protein
interactions [13], codon usage can be considered as a
Published: 23 May 2008
Genome Biology 2008, 9:R87 (doi:10.1186/gb-2008-9-5-r87)
Received: 6 February 2008
Revised: 1 April 2008
Accepted: 23 May 2008
The electronic version of this article is the complete one and can be
found online at />Genome Biology 2008, 9:R87
Genome Biology 2008, Volume 9, Issue 5, Article R87 Najafabadi and Salavati R87.2
potential candidate for analysis. The coevolution of codon
usage of functionally linked genes has been explicitly
reported before [14,15]. These studies suggest that the codon
adaptation index (CAI) [16] of functionally related proteins
changes in a coordinated fashion over different unicellular
organisms. However, identification of this coordination
between two genes needs the presence of orthologues in sev-
eral organisms; hence, many species-specific genes, which
are usually the hot spots of attraction for biologists, are
excluded. Also, there are genes with very low variation in the
CAI over different organisms [14], for which this kind of anal-
ysis is unreliable.
In this paper, we show that codon usage of functionally and/
or physically linked proteins in an organism contain enough
information to enable us to detect these proteins, even in the
absence of homologues in other organisms. Furthermore, we
show that our method is several times more sensitive than
tracking the coordinated changes of codon usage over differ-
ent organisms, and in fact is one of the best methods for iden-
tification of protein-protein interactions.
Results and discussion
Here we consider three different organisms: S. cerevisiae,
Escherichia coli and Plasmodium falciparum. S. cerevisiae is
a eukaryote with moderate coding G+C content (39.77%),
while the genome of P. falciparum has an extremely low cod-
ing G+C content (23.8%), and E. coli is a prokaryote with
moderate coding G+C content (52.35%). For each organism,
a positive and a negative gold standard set of protein pairs
were defined, where a positive gold standard set comprises
open reading frame (ORF) pairs that, based on previous
reports, encode proteins that interact with each other (either
as members of the same protein complex or as functionally
linked proteins), and a negative set consists of ORF pairs
whose products do not interact with each other (Table 1). It
should be noted that the highest resolution of our gold stand-
ard positive datasets is the protein complex. Given each ORF
pair, we calculated for each codon the value:
d
ij
(c) = |f
i
(c) - f
j
(c)|
where f
i
(c) and f
j
(c) are relative frequencies of codon c in ORF
i and ORF j, respectively (Σ
k
f
i
(c
k
) = 1 and Σ
k
f
j
(c
k
) = 1;
k = 1,2, 64 indicates all 64 codons). Therefore, d
ij
demon-
strates the distance of two ORFs in terms of usage of codon c.
We found that for almost all codons, distribution of d differed
between positive and negative gold standard sets (Additional
data file 1). Generally, distribution of d shifts to smaller values
for ORFs within the gold standard positive set, indicating that
interacting ORFs are more similar in codon usage profile than
non-interacting ORFs. However, this shift is marginal for
each codon individually, which means that single codons are
weak predictors of protein-protein interactions.
We divided the distribution of d for each codon into 50 inter-
vals, for each of which we calculated the likelihood ratio, that
is, the fraction of positive gold standards occurring in that
interval divided by the fraction of negatives occurring in that
interval. Since the mutual information of d for each pair of
codons was negligible, we combined these likelihood ratios
using a naïve Bayes approach (see Additional data files 2 and
3 for a graphical representation). Although obviously not all
features were independent from each other (with statistical
tests suggesting 10 to 16 independent components; see Addi-
tional data file 4), we found that a naïve Bayesian network is
more effective than a Bayesian network in which each varia-
ble node has one other parent node, perhaps because the
increase of the parameters in the latter case causes partial
Table 1
Gold standard sets
Organism GSTD References No. of ORFs No. of ORF pairs Comments/details
S. cerevisiae P [13, 22] 732 3,400 Derived from MIPS [42] complex catalog. We excluded ribosomal proteins
to avoid bias towards extreme codon usage similarity of their genes
N [13, 22] 2,760 1,442,691 Pairs of proteins that are not localized in the same cell compartment. We
excluded ribosomal proteins
P. falciparum P [43] 352 7,689 Protein pairs within the same KEGG [19] pathway
N [43] 354 27,367 Protein pairs with KEGG information, excluding pairs in the gold standard
positive set
E. coli P [44] 2,196 7,063 Pull-down assay using a His-tagged ORF library
N - 3,703 4,437,833 We compiled a set of protein pairs that are not in the gold standard positive
set, given that at least one protein from each pair is copurified with an
associate protein by Arifuzzaman et al. [44]
Each set comprises only ORFs that could be associated with their genomic sequences using the names that were provided in the original references.
Self interactions were considered in neither the training nor the testing process. GSTD, gold standard dataset; N, negative; P, positive.
Genome Biology 2008, Volume 9, Issue 5, Article R87 Najafabadi and Salavati R87.3
Genome Biology 2008, 9:R87
overfitting of the network. Using a tenfold cross-validation
method, we evaluated the performance of this naïve Bayesian
network in predicting protein-protein interactions. To do so,
we divided the gold-standard set into ten random segments;
each time we used nine segments as the training set and cal-
culated the combined likelihood ratios for each ORF pair in
the remaining segment. We designate the method 'PIC' (for
probabilistic-interactome using codon usage).
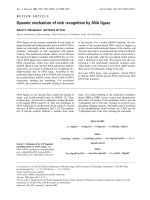
Figure 1a summarizes the performance of PIC in S. cerevisiae,
P. falciparum and E. coli. For all three organisms, codon
usage is a strong predictor of protein-protein interactions. As
an extremely G+C poor parasite with a highly biased codon
usage [17], the case of P. falciparum is of special interest,
showing that codon usage is a powerful tool for prediction of
interactomes within a wide range of G+C compositions. Fig-
ure 1b compares the performance of PIC in yeast with three
widely used predictive methods: interolog mapping [5], phyl-
ogenetic profiles [3] and Rosetta stone [4,18]. At low rates of
false positives, PIC is the most sensitive method, up to seven
times more sensitive than the next best method, interolog
mapping. Also, for higher rates of false positives, PIC is still
more sensitive than interolog mapping and the Rosetta stone
approach. Figure 1b also compares PIC with a previous report
on identification of protein-protein interactions based on CAI
coevolution [14], illustrating up to eight times higher sensitiv-
ity for PIC (see Materials and methods for the details of the
analysis). Finally, for the sake of comparison, the predictive
power of the absolute difference of CAI (see [16] for the defi-
nition of CAI and to compare it with PIC) between two genes
is investigated, showing a very poor performance (Figure 1b).
It should be noted that the gold standard negative set that we
used for S. cerevisiae is made of protein pairs that do not co-
localize. Therefore, it may be possible that PIC recognizes
subcellular localization of proteins instead of protein-protein
interactions. To examine this, we compiled a set of protein
pairs that localize within the same subcellular compartment.
Then, we assessed the enrichment of interacting protein pairs
and co-localized protein pairs in the positive predictions of
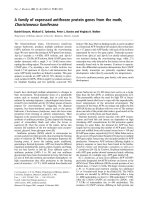
PIC at different thresholds. As Figure 2 shows, the PIC predic-
tions are rapidly enriched by true interacting proteins rather
than proteins that are localized in the same subcellular com-
partment. We also compiled an alternative standard negative
set by using pairs of proteins that have Kyoto Encyclopedia of
Genes and Genomes (KEGG) information [19], but do not
share any KEGG pathway. Although this negative set is not as
reliable as the main gold standard negative set that we used
for the training and testing of PIC, it allows pairs of proteins
that reside within the same subcellular compartment. The
performance of PIC over this negative set was essentially the
same as over the main gold standard negative set. For the
Results of protein-protein interaction prediction by PICFigure 1
Results of protein-protein interaction prediction by PIC. (a) Receiver operating characteristic (ROC) curves of PIC for S. cerevisiae (red), P. falciparum
(green) and E. coli (blue). (b) Comparison of ROC curves in yeast for PIC (red), interolog mapping (INT, green), phylogenetic profiles (PGP, blue), Rosetta
stone (ROS, dark blue), CAI coevolution (co-CAI, blue dotted line) and absolute CAI value (CAI, red dotted line). The dashed line shows the diagonal. The
same comparison is shown using the precision-recall curves in Additional data file 10. For interolog mapping, phylogenetic profiles and Rosetta stone, data
were retrieved from [41]. FP, false positive; N, negative; P, positive; TP, true positive. Positive and negative test sets are as indicated in Table 1.
0
0.1
0.2
0.3
0.4
0.5
0.6
0.7
0.8
0.9
1
0 0.1 0.2 0.3 0.4 0.5 0.6 0.7 0.8 0.9 1
TP/P = sensitivity
FP/N = 1-s pecificity
S . cerevisiae
P . falciparum
E . coli
Diagonal
1.E-05
1.E-04
1.E-03
1.E-02
1.E-01
1.E+00
1.E-05 1.E-04 1.E -03 1.E-02 1.E-01 1.E+00
FP/N = 1- specificity
PIC
INT
PGP
ROS
co-CAI
CAI
Diagonal
(a) (b)
Genome Biology 2008, 9:R87
Genome Biology 2008, Volume 9, Issue 5, Article R87 Najafabadi and Salavati R87.4
other two studied organisms, E. coli and P. falciparum, the
gold standard negative sets already contained co-localizing
protein pairs.
Although PIC considers the relative frequencies of codons in
ORF pairs, it reflects not only synonymous codon usage, but
also amino acid frequencies and ORF lengths. ORF length is
reflected in PIC since stop codons are not omitted, and each
ORF has only one stop codon. Therefore, the relative fre-
quency of a stop codon in long ORFs is smaller than in short
ORFs. We created three other probabilistic interaction net-
works of S. cerevisiae using RSCU [20], relative frequencies
of amino acids, and ORF length in order to examine the effect
of each factor. We named these probabilistic networks PI-
RSCU, PI-A and PI-L, respectively. RSCU is a measure of syn-
onymous codon usage that is independent of amino acid com-
position (see reference [20] for the definition of RSCU and to
compare it with the relative frequency of codon. RSCU as well
as many other measures of synonymous codon usage are
dependent on gene length, and result in biased values when
the corresponding coding sequences are short [21]. In the
worst case, when an amino acid is absent from a gene, it is
impossible to calculate the RSCU for its corresponding
codons. In the latter case, we treated the RSCU values of these
codons as missing data, which can be easily handled by naïve
Bayesian networks. In comparable sensitivities, the descend-
ing order of accuracy was PIC > PI-RSCU > PI-A > PI-L
(Additional data file 5). This suggests a synergistic effect of
each of these factors on the strength of PIC, with synonymous
codon usage being the most important one. It should be men-
tioned that the length of the protein (PI-L) has a very mar-
ginal ability to distinguish interacting from non-interacting
pairs, and even this observed marginal prediction may be due
to the bias of the gold standard positive set towards a certain
range of protein lengths, as the length of a protein affects
many experimental procedures, such as successful cloning,
and so on.
PIC can easily be combined with other probabilistic
approaches, such as PIP (PI-predicted) and PIT (PI-total)
[22] (see Materials and methods for combining two probabi-
listic interactomes). PIP is a probabilistic predicted network
of S. cerevisiae in which four datasets of genomic features are
integrated: two datasets of biological functions, a dataset of
mRNA expression correlation and a dataset of essentiality
[22]. Jansen et al. [22] showed that, at comparable levels of
sensitivity, PIP is even more accurate than PIE (PI-experi-
mental), a probabilistic network constructed by integration of
four experimental datasets of the yeast interactome. They
also combined PIP and PIE into PIT as one of the most com-
prehensive probabilistic networks of known and putative pro-
tein complexes in yeast. We integrated the results of yeast PIC
and PIP to see how their combination improves our power in
de novo prediction of interactions.
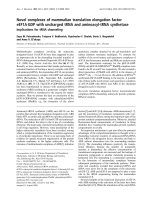
PIC, PIP [22] and their combination are compared in Figure
3. For false positive rates <10
-5
, PIC is as sensitive as PIP,
although in general PIP is far superior to PIC. More strikingly,
combining PIP and PIC results in a four-fold increase in sen-
sitivity when the false positive rate is <10
-5
(after adding
ribosomal proteins to the test set, a six-fold increase was
observed). The combination of PIP and PIC remains the supe-
rior predictor for all false positive rates, and gets to a sensitiv-
ity of about 1.75 times that of PIP at a precision of 50%.
Jansen et al. [22] used a likelihood threshold of 600 to cut an
interaction network of S. cerevisiae out of PIP, referred to
here as PIP-Lcut
600
. For comparable specificity, the combina-
tion of PIP and PIC is 1.5 times more sensitive than PIP-
Lcut
600
(considering ribosomal proteins in the test set, the
combination of PIP and PIC is 1.6 times more sensitive than
PIP-Lcut
600
; Additional data file 6). We also calculated the
per-complex sensitivity of predictions for either PIP or the
combination of PIP and PIC, and observed that the combina-
tion of PIP and PIC outperforms PIP in every single complex
as well (Additional data file 7). Furthermore, we found that,
compared to PIP, PIC in yeast is less biased towards certain
biological functions (Additional data file 8) as well as highly
expressed genes (Additional data file 9). However, it is evi-
dent that at least in the case of P. falciparum (Additional data
file 14), PIC top-scoring interactions mainly belong to the
ribosomal proteins. This reflects the very similar codon usage
profiles of ribosomal proteins, most likely optimized for their
efficient translation.
Enrichment of PIC predictions by interacting protein pairs versus protein pairs that co-localizeFigure 2
Enrichment of PIC predictions by interacting protein pairs versus protein
pairs that co-localize. The horizontal axis shows the fraction of co-
localizing protein pairs that match PIC predictions, and the vertical axis
shows the fraction of the gold standard interacting protein pairs that
match PIC predictions. Rapid enrichment of PIC with interacting protein
pairs indicates that it detects protein-protein interactions rather than
localization.
1.E-06
1.E-04
1.E-02
1.E+00
1.E-06 1.E-04 1.E-02 1.E +00
Interacting protein pairs
Co-localizing protein pairs
Genome Biology 2008, Volume 9, Issue 5, Article R87 Najafabadi and Salavati R87.5
Genome Biology 2008, 9:R87
Finally, we combined PIT [22] and PIC to generate 'PICT',
which we propose as one of the most reliable probabilistic
interactomes of S. cerevisiae (see Additional data file 11 for
precision-recall curves of PIT and PICT. PICT, accompanied
by PIC for the whole genome of S. cerevisiae, is available
online [23]). At a likelihood cutoff of 2 × 10
3
, PICT has the
same specificity as PIT-Lcut
600
, while, after excluding pro-
miscuous nodes (that is, nodes each of which has ≥100 edges),
it includes 1,306 more ORFs compared to PIT. Analysis of
PICT-Lcut
2000
reveals many interesting interactions not
present in PIT-Lcut
600
. Some examples are represented
below. We specifically consider complexes that were also
examined by Jansen et al. [22] in order to provide a more
detailed comparison between PIT and PICT. Note that the fol-
lowing interactions should be considered as complex co-
memberships rather than direct physical interactions, since
all the components of PICT are trained on protein complexes
and not one-to-one physical interactions of proteins. How-
ever, a direct physical interaction is also possible based on the
closeness of proteins within the same complex.
While mammalian Pob3, an interacting partner of the nucle-
osome, has a high mobility group (HMG) for interaction with
histones, yeast Pob3 lacks this domain [22]. Instead, in yeast,
the HMG protein Nhp6 interacts with the nucleosome. PIT-
Lcut
600
suggests that Nhp6A, an isoform of Nhp6, interacts
with all nucleosome histones H2A, H2B, H3 and H4, which is
highly unlikely considering the structure of the nucleosome.
In addition, it has been shown that Nhp6 does not influence
nucleosome reassembly; thus, it is unlikely for Nhp6 to inter-
act with the H2A-H2B dimer [22]. In contrast to PIT-Lcut
600
,
PICT-Lcut
2000
only suggests an interaction between Nhp6A
and HHT1 (H3), which is more congruent with the current
models of nucleosome structure and assembly. PICT-Lcut
2000
also predicts a novel interaction between Nhp2, another
HMG related protein, and H3 (Figure 4). Recently, affinity
capture of Nhp2 has been shown to result in co-purification of
histone proteins [24], corroborating the interaction of this
protein with the nucleosome. PICT-Lcut
2000
also predicts the
interaction of an uncharacterized ORF, YDL085C-A, with the
nucleosome as well as with Nhp6A, which is consistent with
previous reports showing the presence of GFP-fused
YDL085C-A in the nucleus [25]. This example shows the
potential of PICT, and codon usage in particular, to predict
interactions of uncharacterized proteins, which should pro-
vide new insights into their probable functions.
Another example is the case of translation initiation/elonga-
tion factors. PIT-Lcut
600
fails to predict an interaction involv-
ing elongation factor 2 (EF-2). It also predicts only two
interactions for EF-1α, with EF-1β and EF-1γ. Although PIT-
Lcut
300
suggests some more interactions for these proteins, a
higher rate of false positives in PIT-Lcut
300
renders them
unreliable. PICT-Lcut
2000
predicts several interactions
involving different elongation factors as well as initiation fac-
tors 4A and 5A, many of which have been recently confirmed
Comparison of performance in yeast for PIC, PIP and their combinationFigure 3
Comparison of performance in yeast for PIC, PIP and their combination. PIC is shown in red, PIP [22] in green and the combination of PIP and PIC (PIP ×
PIC) in blue. (a) Receiver operating characteristic (ROC) curves. Both axes are on log-scale. The dashed line shows the diagonal. (b) Precision-recall
curves. FP, false positive; N, negative; P, positive; TP, true positive. Positive and negative test sets are as indicated in Table 1.
1.E-03
1.E-02
1.E-01
1.E+00
1.E-07 1.E-06 1.E-05 1.E-04 1.E-03 1.E- 02 1.E- 01 1.E+00
TP/P = sensitivity
FP/N = 1-specificity
PIPxPIC
PIP
PIC
Diagonal
0
0.1
0.2
0.3
0.4
0.5
0.6
0.7
0.8
0.9
1
0 0.1 0.2 0.3 0.4 0.5 0.6 0.7 0.8 0.9 1
TP/(TP+FP) = Precision
TP/P = Sensitivity
PIPxPIC
PIP
PIC
(a) (b)
Genome Biology 2008, 9:R87
Genome Biology 2008, Volume 9, Issue 5, Article R87 Najafabadi and Salavati R87.6
by tandem-affinity purification experiments [22,26-29]]. Fig-
ure 4 shows a subgraph of PICT-Lcut
2000
representing
interactions among translation initiation/elongation factors
that are not present in PIT-Lcut
600
. A recent study [27] has
shown that Poly(A)-binding protein Pab1 interacts with EF-
1α. Based on PICT-Lcut
2000
, we anticipate that Pab1 interacts
with EF-2 and EF-1γ as well. Also, we found an interesting
interaction between the ribosome-associated molecular
chaperone Ssb1 and eIF4A. Interaction of Ssb1 and eIF4G has
already been shown by tandem-affinity purification [27].
Based on the close interaction of eIF4A and eIF4G, interac-
tion of Ssb1 and eIF4A is reasonable.
RNase P complex represents another interesting example of
PICT predictions. PICT-Lcut
2000
predicts six new interactions
between RNase P complex and other proteins in yeast, nei-
ther of which exists in PIT-Lcut
600
or has been reported pre-
viously. Four interactions are with uncharacterized ORFs,
YKL096C-B, YDL159W-A, YKL183C-A and Q0255. Q0255 is
likely to code for a maturase-like protein. It has been hypoth-
esized that mitochondrial maturases participate in splicing by
stabilizing some secondary or tertiary structure needed for
splicing [30]. Their exact function, however, remains unchar-
acterized [31]. An interaction between RNase P complex and
Q0255 implies the plausibility that this protein could contrib-
ute to maturation of ribosomal RNA and tRNA in mitochon-
dria. According to PICT-Lcut
2000
, HUB1 (Histone mono-
ubiquitination 1) is another interacting partner of RNase P
complex. Previous data have shown that HUB1 is a functional
homolog of the human and yeast BRE1 proteins, and suggest
that it mediates gene activation and cell cycle regulation
through chromatin modifications [32]. In addition, chroma-
tin remodeling in Arabidopsis thaliana seed dormancy is
proposed to be mediated by H2B mono-ubiquitination
through HUB1 and HUB2 [32]. In agreement with this, the
recently reported binding of human RNase P to chromatin of
non-coding RNA genes and regulation of pol III transcription
[33] could be mediated through a HUB1-RNase P interaction.
Another prediction of PICT-Lcut
2000
, interaction of RNase P
with CKB1, also corroborates this observation. CKB1 is a reg-
ulatory subunit of casein kinase 2, whose many substrates
include transcription factors and all RNA polymerases.
Again, this is consistent with the recent proposed role for
RNase P in pol III transcription [33,34].
We notice that PICT has the potential of providing new infor-
mation about proteins that lack homology. For example,
YAR068W is a fungal-specific gene, for which PIT has no
interaction. This is while PICT predicts an interaction
between this protein and a protein of the large subunit of
mitochondrial ribosome (refer to PICT-Lcut
2000
in Additional
data file 13).
Conclusion
PIC uses a naïve Bayesian network to combine the informa-
tion provided by the frequencies of all codons in order to pre-
dict protein-protein interactions. Given a set of independent
Two examples of complexes suggested by PICT-Lcut
2000
Figure 4
Two examples of complexes suggested by PICT-Lcut
2000
. In the case of translation initiation/elongation factors, only novel interactions (interactions absent
from PIT-Lcut
600
[22]) are represented. A black number between two nodes stands for the reference in which the direct interaction of the two connected
nodes is reported. A red number refers to the reference in which interaction of the two connected nodes with a third common protein is reported. 1,
Gavin et al. [27]; 2, Collins et al. [26]; 3, Jao and Chen [28]; 4, Jansen et al. [22]; 5, Anand et al. [29].
Genome Biology 2008, Volume 9, Issue 5, Article R87 Najafabadi and Salavati R87.7
Genome Biology 2008, 9:R87
features, naïve Bayesian networks can combine them in a way
that minimizes the loss of information that usually occurs by
the aggregation of several features. Depending on the training
set that has been used, PIC can predict both complex mem-
bership (as in the Munich Information Center for Protein
Sequences (MIPS) database or TAP-tagging experiments)
and functional linkages between proteins (as in the KEGG
pathway database). Although we did not test the power of PIC
for prediction of direct physical interactions between pro-
teins, it is possible that it can be used for that purpose as well,
since complex membership, functional linkage and direct
physical interactions are all properties that are highly inter-
correlated. We anticipate that integrating PIC with the cur-
rent knowledge of protein interactions in different organisms
will significantly increase the reliability and coverage of prob-
abilistic interactomes. In the case of S. cerevisiae, the results
of PIC as well as its combination with PIT [22], referred to in
this article as PICT, are provided online [23]. This study not
only describes a novel method for de novo prediction of pro-
tein-protein interactions, but also suggests the plausibility of
previously unseen evolutionary forces acting on codon com-
positions of genes within a genome. A few studies have taken
into account the effect of protein-protein interactions on
codon usage; however, these studies generally consider the
unique features of codon composition of an ORF in regions
that code the interacting face of the protein compared to the
rest of the ORF [35], not the direct relationship between
codon usages of two interacting proteins. Characterization of
evolutionary mechanisms shaping these relationships may
lead to development of even more powerful methods for
sequence-based prediction of interaction networks.
Materials and methods
Genome sequences
The genome sequences used were S. cerevisiae [36], E. coli
[37] and P. falciparum [38].
Analysis of genomic features
We used d
ij
(
ζ
k
) = |
ζ
k
i
-
ζ
k
j
| to measure the distance of two
genes i and j regarding feature
ζ
k
. In the case of PIC,
ζ
k
= f(c
k
),
where f(c
k
) is the normalized frequency of usage of codon c
k
,
so that Σ
k
f (c
k
) = 1 (1 ≤ k ≤ 64). For PI-RSCU,
ζ
k
= RSCU(c
k
)
(see [20]). For PI-A,
ζ
k
= f(a
k
), where f(a
k
) is the normalized
frequency of amino acid a
k
(1 ≤ k ≤ 20). For PI-L,
ζ
= L, where
L represents the ORF length. To combine a set of features, a
naïve Bayesian network [13] is employed. Naïve Bayesian net-
works are most effective when they are used to combine inde-
pendent features. We assessed independency of d
ij
for two
features r and s by means of mutual information [13], where
I [d
ij
(
ζ
r
);d
ij
(
ζ
s
)] < 0.01 was assumed not to influence the per-
formance of the naïve Bayesian network. To combine two
probabilistic networks, we multiplied the likelihoods each
network assigned to each interaction.
Coevolution of CAI
We performed the same analysis as described by Fraser et al.
[14], using the genome sequences of S. cerevisiae, Saccharo-
myces paradoxus, Saccharomyces mikatae, and Saccharo-
myces bayanus [39]. We used species-specific adaptation
index to determine the CAI values by using the codon fre-
quencies of the 20 most highly expressed genes. We assumed
that the 20 most highly expressed genes in the four species
are the same; hence, we used a previous report on mRNA
expression in S. cerevisiae [40] to identify them. Addition of
E. coli in the analysis did not improve the results. We did not
add more genomes because we would lose a portion of our
gold standard sets, especially the negative gold standard set,
due to the lack of homology for all genes among all genomes,
resulting in non-comparable sensitivity/specificity values.
Abbreviations
CAI, codon adaptation index; EF, elongation factor; HMG,
high mobility group; HUB, Histone mono-ubiquitination;
KEGG, Kyoto Encyclopedia of Genes and Genomes; Lcut,
likelihood cutoff; MIPS, Munich Information Center for Pro-
tein Sequences; ORF, open reading frame; PI, probabilistic
interactome; PI-A, PI using amino acid frequencies; PIC,
probabilistic-interactome using codon usage; PICT, combina-
tion of PIC and PIT; PIE, PI-experimental; PI-L, PI using
sequence length; PIP, PI-predicted; PI-RSCU, PI using
RSCU; PIT: PI-total.
Authors' contributions
HSN and RS contributed to all aspects of this research. Both
authors read and approved the final manuscript.
Additional data files
The following additional data are available with the online
version of this paper. Additional data file 1 is a figure showing
the distribution of d for each codon in yeast. Additional data
file 2 is a figure comparing the naïve Bayesian network and
fully connected Bayesian network in the yeast gold standard
positive set. Additional data file 3 is a figure comparing the
naïve Bayesian network and fully connected Bayesian net-
work in the yeast gold standard negative set. Additional data
file 4 demonstrates the variance over different components
resulting from principal component analysis of the interact-
ing gene pairs in yeast. Additional data file 5 compares PIC,
PI-RSCU, PI-A and PI-L in a figure. Additional data file 6 is a
figure comparing PIP × PIC and the yeast gold standard pos-
itive set. Additional data file 7 illustrates per-complex com-
parison of PIP and PIP × PIC in a figure. Additional data file
8 is a figure showing the MIPS functional category enrich-
ment for the yeast genome, PIP-Lcut
600
and PIC-Lcut
600
.
Additional data file 9 is a figure representing the distribution
of mRNA expression levels in interactions predicted by PIP-
Lcut
600
and PIC-Lcut
600
for S. cerevisiae. Additional data file
Genome Biology 2008, 9:R87
Genome Biology 2008, Volume 9, Issue 5, Article R87 Najafabadi and Salavati R87.8
10 shows the precision-recall curves for PIC, interolog map-
ping (INT), phylogenetic profiles (PGP), Rosetta stone (ROS),
CAI coevolution (co-CAI) and CAI. Additional data file 11
includes precision-recall curves for PIC, PIT and PICT. Addi-
tional data file 12 is a compressed file containing PIC-Lcut
600
for S. cerevisiae. Additional data file 13 is a compressed file
containing PICT-Lcut
2000
for S. cerevisiae. Additional data
file 14 is a compressed file containing the results of perform-
ance of PIC on the P. falciparum gold standard set.
Additional data file 1Distribution of d for each codon in yeastDistribution of d for each codon in yeast.Click here for fileAdditional data file 2Comparison of the naïve Bayesian network and fully connected Bayesian network in the yeast gold standard positive setComparison of the naïve Bayesian network and fully connected Bayesian network in the yeast gold standard positive set.Click here for fileAdditional data file 3Comparison of the naïve Bayesian network and fully connected Bayesian network in the yeast gold standard negative setComparison of the naïve Bayesian network and fully connected Bayesian network in the yeast gold standard negative set.Click here for fileAdditional data file 4Variance over different components resulting from principal com-ponent analysis of the interacting gene pairs in yeastVariance over different components resulting from principal com-ponent analysis of the interacting gene pairs in yeast.Click here for fileAdditional data file 5Comparison of PIC, PI-RSCU, PI-A and PI-LComparison of PIC, PI-RSCU, PI-A and PI-L.Click here for fileAdditional data file 6Comparison of PIP × PIC and the yeast gold standard positive setComparison of PIP × PIC and the yeast gold standard positive set.Click here for fileAdditional data file 7Per-complex comparison of PIP and PIP × PICPer-complex comparison of PIP and PIP × PIC.Click here for fileAdditional data file 8MIPS functional category enrichment for the yeast genome, PIP-Lcut
600
and PIC-Lcut
600
MIPS functional category enrichment for the yeast genome, PIP-Lcut
600
and PIC-Lcut
600
.Click here for fileAdditional data file 9Distribution of mRNA expression levels in interactions predicted by PIP-Lcut
600
and PIC-Lcut
600
for S. cerevisiaeDistribution of mRNA expression levels in interactions predicted by PIP-Lcut
600
and PIC-Lcut
600
for S. cerevisiae.Click here for fileAdditional data file 10Precision-recall curves for PIC, INT, PGP, ROS, co-CAI and CAIprecision-recall curves for PIC, interolog mapping (INT), phyloge-netic profiles (PGP), Rosetta stone (ROS), CAI coevolution (co-CAI) and CAI.Click here for fileAdditional data file 11Precision-recall curves for PIC, PIT and PICTPrecision-recall curves for PIC, PIT and PICT.Click here for fileAdditional data file 12PIC-Lcut
600
for S. cerevisiaePIC-Lcut
600
for S. cerevisiae.Click here for fileAdditional data file 13PICT-Lcut
2000
for S. cerevisiaePICT-Lcut
2000
for S. cerevisiae.Click here for fileAdditional data file 14Results of performance of PIC on the P. falciparum gold standard setResults of performance of PIC on the P. falciparum gold standard set. For the performance of PIC on Escherichia coli gold standard set check reference [23].Click here for file
Acknowledgements
We thank TG Geary and K Hassani for reading the manuscript and for their
critical comments. We would also like to thank two anonymous referees
for their constructive suggestions. Research at the Institute of Parasitology
is supported by the Centre for Host-Parasite Interactions and Le Fonds
quebecois de la recherche sur la nature et les technologies (FQRNT), Que-
bec. HSN is supported by the Max Stern Fellowship from McGill University
and a fellowship from McGill Centre for Bioinformatics.
References
1. Eisenberg D, Marcotte EM, Xenarios I, Yeates TO: Protein function
in the post-genomic era. Nature 2000, 405:823-826.
2. Sharan R, Ulitsky I, Shamir R: Network-based prediction of pro-
tein function. Molecular systems biology 2007, 3:88.
3. Pellegrini M, Marcotte EM, Thompson MJ, Eisenberg D, Yeates TO:
Assigning protein functions by comparative genome analy-
sis: protein phylogenetic profiles. Proceedings of the National
Academy of Sciences of the United States of America 1999,
96:4285-4288.
4. Marcotte EM, Pellegrini M, Ng HL, Rice DW, Yeates TO, Eisenberg
D: Detecting protein function and protein-protein interac-
tions from genome sequences. Science 1999, 285:751-753.
5. Yu H, Luscombe NM, Lu HX, Zhu X, Xia Y, Han JD, Bertin N, Chung
S, Vidal M, Gerstein M: Annotation transfer between genomes:
protein-protein interologs and protein-DNA regulogs.
Genome research 2004, 14:1107-1118.
6. Shen J, Zhang J, Luo X, Zhu W, Yu K, Chen K, Li Y, Jiang H: Predict-
ing protein-protein interactions based only on sequences
information. Proceedings of the National Academy of Sciences of the
United States of America 2007, 104:4337-4341.
7. Bock JR, Gough DA: Predicting protein - protein interactions
from primary structure. Bioinformatics (Oxford, England) 2001,
17:455-460.
8. Nanni L, Lumini A: An ensemble of K-local hyperplanes for pre-
dicting protein-protein interactions. Bioinformatics (Oxford,
England) 2006, 22:1207-1210.
9. Jansen R, Bussemaker HJ, Gerstein M: Revisiting the codon adap-
tation index from a whole-genome perspective: analyzing
the relationship between gene expression and codon occur-
rence in yeast using a variety of models. Nucleic acids research
2003, 31:2242-2251.
10. Daubin V, Perriere G: G+C3 structuring along the genome: a
common feature in prokaryotes. Molecular biology and evolution
2003, 20:471-483.
11. Elf J, Nilsson D, Tenson T, Ehrenberg M: Selective charging of
tRNA isoacceptors explains patterns of codon usage.
Science.
2003, 300:1718-1722.
12. Dittmar KA, Sorensen MA, Elf J, Ehrenberg M, Pan T: Selective
charging of tRNA isoacceptors induced by amino-acid
starvation. EMBO reports 2005, 6:151-157.
13. Lu LJ, Xia Y, Paccanaro A, Yu H, Gerstein M: Assessing the limits
of genomic data integration for predicting protein networks.
Genome research 2005, 15:945-953.
14. Fraser HB, Hirsh AE, Wall DP, Eisen MB: Coevolution of gene
expression among interacting proteins. Proceedings of the
National Academy of Sciences of the United States of America 2004,
101:9033-9038.
15. Lithwick G, Margalit H: Relative predicted protein levels of func-
tionally associated proteins are conserved across organisms.
Nucleic acids research 2005, 33:1051-1057.
16. Sharp PM, Li WH: The codon Adaptation Index - a measure of
directional synonymous codon usage bias, and its potential
applications. Nucleic acids research 1987, 15:1281-1295.
17. Musto H, Romero H, Zavala A, Jabbari K, Bernardi G: Synonymous
codon choices in the extremely GC-poor genome of Plasmo-
dium falciparum : compositional constraints and translational
selection. Journal of molecular evolution 1999, 49:27-35.
18. Enright AJ, Iliopoulos I, Kyrpides NC, Ouzounis CA: Protein inter-
action maps for complete genomes based on gene fusion
events. Nature 1999, 402:86-90.
19. Kanehisa M, Goto S, Hattori M, Aoki-Kinoshita KF, Itoh M,
Kawashima S, Katayama T, Araki M, Hirakawa M: From genomics
to chemical genomics: new developments in KEGG. Nucleic
acids research 2006, 34:D354-357.
20. Sharp PM, Tuohy TM, Mosurski KR: Codon usage in yeast: cluster
analysis clearly differentiates highly and lowly expressed
genes. Nucleic acids research 1986, 14:5125-5143.
21. Fuglsang A: Estimating the "effective number of codons": the
Wright way of determining codon homozygosity leads to
superior estimates. Genetics 2006, 172:1301-1307.
22. Jansen R, Yu H, Greenbaum D, Kluger Y, Krogan NJ, Chung S, Emili
A, Snyder M, Greenblatt JF, Gerstein M: A Bayesian networks
approach for predicting protein-protein interactions from
genomic data. Science. 2003, 302:449-453.
23. Genome wide analysis of yeast interactome with PIC and
PICT and analysis of E. coli gold standard set with PIC. [http:/
/webpages.mcgill.ca/staff/Group2/rsalav/web/]
24. Krogan NJ, Cagney G, Yu H, Zhong G, Guo X, Ignatchenko A, Li J, Pu
S, Datta N, Tikuisis AP, Punna T, Peregrin-Alvarez JM, Shales M,
Zhang X, Davey M, Robinson MD, Paccanaro A, Bray JE, Sheung A,
Beattie B, Richards DP, Canadien V, Lalev A, Mena F, Wong P, Star-
ostine A, Canete MM, Vlasblom J, Wu S, Orsi C, et al.: Global land-
scape of protein complexes in the yeast Saccharomyces
cerevisiae. Nature 2006, 440:637-643.
25. Huh WK, Falvo JV, Gerke LC, Carroll AS, Howson RW, Weissman
JS, O'Shea EK: Global analysis of protein localization in bud-
ding yeast. Nature 2003, 425:686-691.
26. Collins SR, Kemmeren P, Zhao XC, Greenblatt JF, Spencer F, Hol-
stege FC, Weissman JS, Krogan NJ: Toward a comprehensive
atlas of the physical interactome of Saccharomyces
cerevisiae. Mol Cell Proteomics 2007, 6:439-450.
27. Gavin AC, Aloy P, Grandi P, Krause R, Boesche M, Marzioch M, Rau
C, Jensen LJ, Bastuck S, Dumpelfeld B, Edelmann A, Heurtier MA,
Hoffman V, Hoefert C, Klein K, Hudak M, Michon AM, Schelder M,
Schirle M, Remor M, Rudi T, Hooper S, Bauer A, Bouwmeester T,
Casari G, Drewes G, Neubauer G, Rick JM, Kuster B, Bork P, et al.:
Proteome survey reveals modularity of the yeast cell
machinery. Nature 2006, 440:631-636.
28. Jao DL, Chen KY: Tandem affinity purification revealed the
hypusine-dependent binding of eukaryotic initiation factor
5A to the translating 80S ribosomal complex. Journal of cellular
biochemistry 2006, 97:583-598.
29. Anand M, Chakraburtty K, Marton MJ, Hinnebusch AG, Kinzy TG:
Functional interactions between yeast translation eukaryo-
tic elongation factor (eEF) 1A and eEF3. The Journal of biological
chemistry 2003, 278:6985-6991.
30. Hebbar SK, Belcher SM, Perlman PS: A maturase-encoding group
IIA intron of yeast mitochondria self-splices in vitro.
Nucleic
acids research 1992, 20:1747-1754.
31. Belfort M: Two for the price of one: a bifunctional intron-
encoded DNA endonuclease-RNA maturase. Genes &
development 2003, 17:2860-2863.
32. Fleury D, Himanen K, Cnops G, Nelissen H, Boccardi TM, Maere S,
Beemster GT, Neyt P, Anami S, Robles P, Micol JL, Inze D, Van Lijse-
bettens M: The Arabidopsis thaliana homolog of yeast BRE1
has a function in cell cycle regulation during early leaf and
root growth. The Plant cell 2007, 19:417-432.
33. Jarrous N, Reiner R: Human RNase P: a tRNA-processing
enzyme and transcription factor. Nucleic acids research 2007,
35:3519-3524.
34. Reiner R, Ben-Asouli Y, Krilovetzky I, Jarrous N: A role for the cat-
alytic ribonucleoprotein RNase P in RNA polymerase III
transcription. Genes & development 2006, 20:1621-1635.
35. Alvarez-Valin F, Tort JF, Bernardi G: Nonrandom spatial distribu-
tion of synonymous substitutions in the GP63 gene from
Leishmania. Genetics 2000, 155:1683-1692.
36. Saccharomyces cerevisiae coding sequences [ftp://genome-
ftp.stanford.edu/pub/yeast/sequence/genomic_sequence/orf_dna/
Genome Biology 2008, Volume 9, Issue 5, Article R87 Najafabadi and Salavati R87.9
Genome Biology 2008, 9:R87
orf_coding_all.fasta.gz]
37. Escherichia coli coding sequences [ />Ecol_K12_W3110/Ecol_K12_W3110_.ena.gz]
38. Plasmodium falciparum coding sequences [s
modb.org/common/downloads/release-5.4/Pfalciparum/
PfalciparumAnnotatedCDS_plasmoDB-5.4.fasta]
39. Kellis M, Patterson N, Endrizzi M, Birren B, Lander ES: Sequencing
and comparison of yeast species to identify genes and regu-
latory elements. Nature 2003, 423:241-254.
40. Greenbaum D, Jansen R, Gerstein M: Analysis of mRNA
expression and protein abundance data: an approach for the
comparison of the enrichment of features in the cellular
population of proteins and transcripts. Bioinformatics (Oxford,
England) 2002, 18:585-596.
41. Saccharomyces cerevisiae Bayesian features [http://net
works.gersteinlab.org/BayesFeatures/]
42. Mewes HW, Amid C, Arnold R, Frishman D, Guldener U, Mannhaupt
G, Munsterkotter M, Pagel P, Strack N, Stumpflen V, Warfsmann J,
Ruepp A: MIPS: analysis and annotation of proteins from
whole genomes. Nucleic acids research 2004, 32:D41-44.
43. Date SV, Stoeckert CJ Jr: Computational modeling of the Plas-
modium falciparum interactome reveals protein function on
a genome-wide scale. Genome research 2006, 16:542-549.
44. Arifuzzaman M, Maeda M, Itoh A, Nishikata K, Takita C, Saito R, Ara
T, Nakahigashi K, Huang HC, Hirai A, Tsuzuki K, Nakamura S, Altaf-
Ul-Amin M, Oshima T, Baba T, Yamamoto N, Kawamura T, Ioka-
Nakamichi T, Kitagawa M, Tomita M, Kanaya S, Wada C, Mori H:
Large-scale identification of protein-protein interaction of
Escherichia coli K-12. Genome research 2006, 16:686-691.