Microsoft Excel 2010: Data Analysis and Business Modeling phần 4 docx
Bạn đang xem bản rút gọn của tài liệu. Xem và tải ngay bản đầy đủ của tài liệu tại đây (948.45 KB, 67 trang )
200 Microsoft Excel 2010: Data Analysis and Business Modeling
Given quarterly corporate revenues, how can I indicate quarters in which revenues in-
creased over the previous quarter in one color, and quarters in which revenues decreased
from the previous quarter in another color?
The le Amazon.xlsx contains quarterly revenues (in millions) for Amazon.com during the
years 1995–2009. (See Figure 24-23.) We want to highlight quarters in which revenues
increased over the previous quarter in green and highlight quarters in which revenues
decreased over the previous quarter in red.
FIGURE 24-23 Highlighting increased sales in green and decreased sales in red.
The Use A Formula option in the Conditional Formatting Rules Manager dialog box enables
you to specify a formula that denes conditions that Excel checks before it applies formatting
to a cell. I’ll use this option in this section, but before I demonstrate the formula option, let’s
look at how Excel evaluates some logical functions. The work is in the le Logicalexamples.
xlsx.
What happens when you type a formula such as =B3<2 in cell B4? If the value in B3 is a
number smaller than 2, Excel returns the value True in cell B4; otherwise, Excel returns False.
You can refer to the le Logicalexamples.xlsx, shown in Figure 24-24, for other examples like
this, including combinations of AND, OR, and NOT in formulas.
■
In cell B6, the formula =OR(B3<3, C3>5) returns the value True if either of the
conditions B3<3 or C3>5 is true. Because the value of C3 is greater than 5, Excel
returns True.
■
In cell B7, the formula =AND(B3=3,C3>5) returns True if B3=3 and C3>5. Because B3 is
not equal to 3, Excel returns False. In cell B8, however, the formula =AND(B3>3,C3>5)
returns True because B3>3 and C3>5 are both true.
■
In cell B9, the formula =NOT(B3<2) returns True because B3<2 would return False, and
a not-false value becomes True.
Chapter 24 Conditional Formatting 201
FIGURE 24-24 Logical functions.
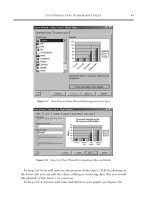
Now let’s look at how the Use A Formula option allows you to create a conditional format
in a range of cells. Begin by selecting the range of cells to which you want to apply a
conditional format. Then click Conditional Formatting, Manage Rules to display the
Conditional Formatting Rules Manager dialog box. Click New Rule, and then select the Use
A Formula To Determine Which Cells To Format option (the last option; I also simply call this
the formula option). To use the formula option, you enter a formula (the formula must start
with an equals sign) that is true if and only if you want the cell in the upper-left corner to be
assigned the chosen format. Your logical formula can be copied like an ordinary formula to
the remainder of the selected range, so judicious use of dollar signs ($) is needed to ensure
that for each cell of the selected range the formula will be true if and only if you want your
format to apply to the cell. Click Format, and then enter the formatting you want. Click OK.
After clicking OK in the Conditional Formatting dialog box, your formula and formatting are
copied to the whole cell range. The formatting is applied to any cell in the selected range
that satises the condition dened in the formula.
Returning to the le Amazon.xlsx, let’s focus on highlighting in green the quarters in which
revenues increase. Basically, what you want to do is select the range E6:E61 (there is no prior
quarter to which you can compare the revenue gure in cell E5) and then instruct Excel that
if a cell’s value is larger than the cell above it, highlight the cell in green. Figure 24-25 shows
how to set up the rule.
FIGURE 24-25 Conditional formatting settings that will display in green the quarters in which revenue
increased.
202 Microsoft Excel 2010: Data Analysis and Business Modeling
If you enter =E6>E5 by pointing to the appropriate cells, be sure you remove the $ signs
from the formula in the Conditional Formatting dialog box or the formula won’t be copied.
Probably the easiest way to insert or delete dollar signs is to use the F4 key. When you high-
light a cell reference such as A3, pressing F4 includes or deletes dollars signs in the following
order: A3, $A$3, A$3, $A3. Thus, if you start with $A$3, pressing F4 changes the cell reference
to A$3. The formula in this example ensures that cell E6 is colored green if and only if sales
in that quarter exceed the previous quarter. After clicking OK, you’ll nd that all quarters in
which revenue increased are colored green. Notice that in cell E7, for example, the formula
was copied in the usual way, becoming =E7>E6.
To add the condition for formatting cells in which revenue decreased, select the range E6:E61
again, open the Conditional Formatting Rules Manager dialog box, click New Rule, and then
select Use A Formula To Determine Which Cells To Format. Enter the formula =E6<E5, and
then click Format. On the Fill tab, change the ll color to red, and then click OK twice. The
Conditional Formatting Rules Manager dialog box now appears as shown in Figure 24-26.
FIGURE 24-26 These conditions will display quarters in which revenue increased in green, and quarters in
which revenue decreased in red.
You can use the formula option with color scales, data bars, and icon sets. Simply select the
option when setting the criteria for your color scale, data bars, or icon sets.
Given a list of dates, how can I indicate weekend dates in a specic color?
The le Weekendformatting.xlsx (see Figure 24-27) contains several dates. I want to highlight
all Saturdays and Sundays in red. To do this, I rst copied the formula WEEKDAY(C6,2) from
cell D6 to D7:D69. Choosing Type=2 for the WEEKDAY function returns a 1 for each Monday,
a 2 for each Tuesday, and so on, so that the function returns a 6 for each Saturday and a 7 for
each Sunday.
Chapter 24 Conditional Formatting 203
FIGURE 24-27 Using the WEEKDAY function to highlight weekend days in red.
I now select the range D6:D69, click Conditional Formatting, and then click Manage
Rules. After clicking New Rule and the formula option, I ll in the dialog box as shown in
Figure 24-28.
FIGURE 24-28 The Edit Formatting Rule dialog box set up to display weekend days in red.
After I click OK, each date having its weekday equal to 6 (for Saturday) or 7 (for Sunday) is
colored red. The formula =OR(D6=6,D6=7) implies that a cell entry of 6 or 7 will activate the
red font color. Of course, I could have used Format Only Cells That Contain and used >=6 or
>5 to obtain the same formatting.
204 Microsoft Excel 2010: Data Analysis and Business Modeling
Our basketball coach has given each player a rating between 1 and 10 based on the
player’s ability to play guard, forward, or center Can I set up a worksheet that visually
indicates the ability of each player to play the position to which she’s assigned?
The le Basketball.xlsx, shown in Figure 24-29, contains ratings given to 20 players for each
position and the position (1=Guard, 2=Forward, 3=Center) played by each player. The goal
here is to ll with red the cell containing the rating for each player for the position to which
she’s assigned.
FIGURE 24-29 This worksheet rates each player’s ability to play a position.
Begin by selecting the range C3:E22, which contains the players’ ratings. Click Conditional
Formatting, Manage Rules. Then click New Rule, and choose the formula option. Now ll in
the dialog box as shown Figure 24-30.
FIGURE 24-30 The Edit Formatting Rule dialog box set up to show player ratings in red ll.
Chapter 24 Conditional Formatting 205
The formula =$A3=C$1 compares the player’s assigned position to the column heading
(1, 2, or 3) in row 1. If the player’s assigned position is set to 1 (Guard), her rating in column C,
which is her guard rating, appears in red. Similarly, if the player’s assigned position is set to 2,
her forward rating in column D appears in red. Finally, if the assigned position is set to 3, her
center rating in column E appears in red. Note that if you do not include the dollar sign with
the A and the 1 in the formula, it will not copy down and across correctly.
I also want to note that Excel 2010 allows conditional formats created with formulas to
reference data in other worksheets. In prior versions of Excel you could reference data only in
the worksheet where the format was placed.
What does the Stop If True option in the Manage Rules dialog box do?
Suppose that the Stop If True option is selected for a rule. If a cell satises this rule, all lower
precedent rules are ignored. To illustrate the use of Stop If True, assume you have created a
data bar format, but you don’t want data bars to appear in cells having values greater than or
equal to 50. Simply use Manage Rules to add a rst format to the cell range that takes effect
only if the value of the cell is >=50. Have the rst format use an automatic (black) font and
select Stop If True for that format. Now, for all cells having values greater than or equal to 50,
Excel will stop and not use the data bar format.
Problems
1. Using the data in the le Sandp.xlsx, use conditional formatting in the following
situations:
❑
Format in bold each month in which the value of the S&P index increased, and
underline each month in which the value of the S&P index decreased.
❑
Highlight in green each month in which the S&P index changed by a maximum of
2 percent.
❑
Highlight the largest S&P index value in red and the smallest in purple.
2. Using the data in the le Toysrusformat.xlsx, highlight in red all quarters for which
revenue has increased over at least the last two quarters. Highlight all fourth-quarter
revenues in blue and rst-quarter revenues in red.
3. The le Test.xlsx contains exam scores for students. The top 10 students receive an
A, the next 20 students receive a B, and all other students receive a C. Highlight the
A grades in red, the B grades in green, and the C grades in blue. Hint: The function
LARGE(D4:D63,10) gives you the tenth-highest grade on the test.
4. In the le Weekendformatting.xlsx, highlight all weekdays in red. Highlight in blue all
days that occur in the rst 10 days of the month.
206 Microsoft Excel 2010: Data Analysis and Business Modeling
5. Suppose each worker in Microsoft’s nance department has been assigned to one
of four groups. The supervisor of each group has rated each worker on a 0–10 scale,
and each worker has rated his satisfaction with each of the four groups. (See the le
Satissuper.xlsx.) Based on the group to which each worker is assigned, highlight the
supervisor rating and the worker satisfaction rating for each worker.
6. The le Varianceanalysis.xlsx contains monthly prot forecasts and monthly actual
sales. The sales variance for a month equals:
predictedsales
actualsales – predictedsales
Highlight in red all months with a favorable variance of at least 20 percent, and
highlight in green all months with an unfavorable variance of more than 20 percent.
7. For our drug cost example from Chapter 22, “The OFFSET Function,” format the
worksheet so that all Phase 1 costs are displayed in red, all Phase 2 costs are displayed
in green, and all Phase 3 costs are displayed in purple.
8. The le Names.xlsx contains a list of names. Highlight all duplicates in green and all
names containing Ja in red.
9. The le Duedates.xlsx contains due dates for various invoices. Highlight in red all
invoices due by the end of the next month.
10. In the le Historicalinvest.xlsx, set up conditional formatting with three icons so that
10 percent of returns have an up arrow, 10 percent have a down arrow, and 80 percent
have a horizontal arrow.
11. The le Nbasalaries.xlsx contains salaries of NBA players in millions of dollars. Set up
data bars to summarize this data. Players making less than $1 million should have the
shortest data bar, and players making more than $15 million should have largest data
bar.
12. Set up a three-color scale to summarize the NBA salary data. Change the color of the
bottom 10 percent of all salaries to green and the top 10 percent to red.
13. Use ve icons to summarize the NBA player data. Create break points for icons at $3
million, $6 million, $9 million, and $12 million.
14. How could you set things up so that no icons are shown for players who have salaries
between $7 million and $8 million? Hint: Use the Stop If True option.
15. The le Fractiondefective.xlsx contains the percentage of defective units produced
daily. A day’s production is considered acceptable if 2 percent or less of the items
produced are defective. Highlight all acceptable days with a green ag. In another
worksheet, highlight all acceptable days with a red ag. Hint: Use the Stop If True
option to ensure that no icon occurs in any cell containing a number less than 2.
Chapter 24 Conditional Formatting 207
16. Summarize global warming data with a three-color scale. Lower temperatures should
be blue, intermediate temperatures should be yellow, and higher temperatures
should be red.
17. Suppose you are saving for your child’s college fund. You are going to contribute the
same amount of money to the fund at the end of each year. Your goal is to end up with
$100,000. For annual investment returns ranging from 4 percent to 15 percent, and
number of years investing varying from 5 to 15 years, determine your required annual
contribution. Suppose you are able to save $10,000 per year. Use conditional format-
ting to highlight for each annual return rate the minimum number of years needed to
accumulate $100,000.
18. The le Amazon.xlsx contains quarterly revenues for Amazon.com. Use conditional
formatting to ensure that sales during each quarter are highlighted in a different color.
19. Set up conditional formatting that colors the cell range A1:H8 like a checkerboard, with
alternating white and black coloring. Hint: The ROW() function gives the row number of
a cell, and the COLUMN() function gives the column number of a cell.
20. When students take Vivian’s accounting exam they are told to enter their e-mail alias
on a Scantron. Often they make a mistake. Vivian has a list of the actual e-mail aliases
for the students in the class. She would like to highlight in yellow the e-mail aliases
entered by students that are not true aliases. This will help her easily correct them. The
le Scantrons.xlsx contains the necessary data. Help Vivian out!
21. The le Top5.xlsx contains the revenues each year of 50 companies. For each year
highlight the companies that have the ve largest revenues. Hint: The function
LARGE(B1:B50,5) would return the fth largest number in the range B1:B50.
22. The le Threetimes.xlsx contains a list of names. Highlight in red each name that
appears at least three times.
23. The le GNP.xlsx contains quarterly U.S. gross national product. Take advantage of the
fact that data bars handle negative values to summarize quarterly GNP percentage
growth rates.
24. Using the data in the le Globalwarmingtemp.xlsx, highlight the years (not the
temperatures) in which the temperature is above average.
209
Chapter 25
Sorting in Excel
Questions answered in this chapter
■
How can I sort sales transaction data so that transactions are sorted rst by
salesperson, then by product, then by units sold, and nally in chronological order
from oldest to most recent?
■
I have always wanted to sort my data based on cell color or font color. Is this possible in
Excel 2010?
■
I love the great icon sets described in Chapter 24, “Conditional Formatting.” Can I sort
my data based on the icon in the cell?
■
My worksheet includes a column containing the month in which each sale occurred.
When I sort by this column, I get either April (rst month alphabetically) or October
(last month alphabetically) on top. How can I sort by this column so that January
transactions are on top, followed by February, and so on?
■
Can I sort data without using the Sort dialog box?
Almost every user of Microsoft Excel has at one time or another sorted columns of data
alphabetically or by numerical value. Let’s look at some examples of how wonderful and
powerful sorting is in Excel 2010.
Answers to This Chapter’s Questions
How can I sort sales transaction data so that transactions are sorted rst by salesperson,
then by product, then by units sold, and nally in chronological order from oldest to
most recent?
JAC is a small company that sells makeup. The Makeup worksheet in the Makeupsorttemp.
xlsx le in the Templates folder for this chapter (see Figure 25-1) contains the following sales
transaction information:
■
Transaction number
■
Name of salesperson
■
Date of transaction
■
Product sold
210 Microsoft Excel 2010: Data Analysis and Business Modeling
■
Units sold
■
Dollars received
■
Location of transaction
FIGURE 25-1 Sales transaction data before sorting.
I want to sort the data so that:
■
Transactions are listed alphabetically by salesperson. I want to sort in the usual A-to-Z
order so that all of Ashley’s transactions are rst and all of Zaret’s transactions are last.
■
Each person’s transactions are sorted by product. Thus, Ashley’s eye liner transactions
will be followed by Ashley’s foundation transactions and so on.
■
For each salesperson and product, transactions are listed by number of units sold (in
descending order).
■
If a salesperson makes two or more sales of the same product for the same number of
units, transactions are listed in chronological order.
In versions of Excel before Excel 2007, it was difcult to sort on more than three criteria.
Excel 2007 and Excel 2010 allow you to apply up to 64 criteria in one sort. To sort the sales
data, I rst need to select the data (cell range E3:K1894). Two easy ways to select this data are
as follows:
■
Position the cursor in the upper-left corner of the data (cell E3), and then press
Ctrl+Shift+Right Arrow followed by Ctrl+Shift+Down Arrow.
■
Position the cursor anywhere in the cell range and press Ctrl+Shift+*.
Chapter 25 Sorting in Excel 211
Next, on the Data tab, in the Sort & Filter group, I click Sort to display the Sort dialog box
shown in Figure 25-2.
FIGURE 25-2 Sort dialog box not yet lled in.
Because row 3 contains headings for the data columns, I select the My Data Has Headers
check box. Now I select the following four criteria in the order shown:
1. Sort by the Name column so that values (this means cell contents) are in A-to-Z order.
2. Sort by the Product column so that values are in A-to-Z order.
3. Sort by the Units column so that values are in order from largest to smallest.
4. Sort by the Date column so that values are in chronological order from oldest to
newest.
The dialog box now looks like Figure 25-3.
FIGURE 25-3 Sort dialog box set up for the sales sorting example.
The nal result of our sort is shown in Figure 25-4.
212 Microsoft Excel 2010: Data Analysis and Business Modeling
FIGURE 25-4 Sorted sales transaction data.
Note that all of Ashley’s transactions are listed rst, with eye liner followed by foundation,
and so on. Eye liner transactions are listed from the largest number of units sold to the small-
est. In the case of a tie (see rows 6 and 7), the transactions are listed in chronological order.
Using the Sort dialog box, you can easily add
sort criteria (Add Level), delete sort criteria
(Delete Level), copy the settings that dene a level of the sort (Copy Level), or specify
whether your data has headers. By selecting Options, you can make the sort operation case
sensitive or even sort data for which each data item is listed in a different column (instead of
the more common situation in which each case is in a different row).
I have always wanted to sort my data based on cell color or font color Is this possible in
Excel 2010?
In Excel 2010, sorting on cell or font color is simple. Consider the Makeup worksheet in the
Makeupsorttemp.xlsx le. Several names in column F are highlighted in different colors.
For example, Cici in cell F620 is highlighted in red, and Colleen in cell F833 is highlighted in
yellow. Suppose you want names with green ll on top, followed by yellow, and then by red,
with the rest of the rows on the bottom. To sort the Name column by color, simply select the
range you want to sort (E3:K1894), click Sort, and click Add Level. After selecting the Name
column, click the Sort On setting, and select Cell Color (selecting Font Color sorts by font
color). For the rst level, select green from the Order list, select yellow for the second level,
and select red for the third level. The completed dialog box is shown in Figure 25-5. The re-
sulting sort is shown in the Colors worksheet of the Makeupsort.xlsx le found in the Practice
Files folder for this chapter and shown in Figure 25-6.
Chapter 25 Sorting in Excel 213
FIGURE 25-5 Sort dialog box set up to sort by color.
FIGURE 25-6 Results of sorting by color.
I love the great icon sets described in Chapter 24, “Conditional Formatting” Can I sort my
data based on the icon in the cell?
To sort by icon, simply select Cell Icon from the Sort On list in the Sort dialog box. Then, in
the Order list, choose the icon you want on top for the rst level and so on.
My worksheet includes a column containing the month in which each sale occurred
When I sort by this column, I get either April (rst month alphabetically) or October (last
month alphabetically) on top How can I sort by this column so that January transactions
are on top, followed by February, and so on?
The Dates worksheet in the Makeupsorttemp.xlsx le contains a list of months. (See Figure
25-7.) I would like to sort the months so that they appear in chronological order begin-
ning with January. I begin by selecting the range D6:D15 and sorting column D by values.
When selecting the order, I select Custom List and then select the option beginning with
214 Microsoft Excel 2010: Data Analysis and Business Modeling
January, February, March. Note that you could also have sorted by the day of the week. The
completed dialog box is shown in Figure 25-8, with the resulting sort shown in Figure 25-9.
Note that in the Custom Lists dialog box you can create a custom sort order list. Simply
select New List, under List Entries type the entries in the order you want to sort by, and then
click Add. Your new list is now included as a menu selection. For example, if you enter Jack,
John, and Alan in List Entries (on different lines or separated by commas), all entries with Jack
would be listed rst, followed by John listings, with Alan listings at the end.
FIGURE 25-7 Months to be sorted.
FIGURE 25-8 The Sort dialog box set up to sort by month.
FIGURE 25-9 Months sorted in chronological order.
Chapter 25 Sorting in Excel 215
Can I sort data without using the Sort dialog box?
Sometimes sorting data without using the Sort dialog box is more convenient. To illustrate
how this is done, suppose again that you want to sort the sales transaction data in the
Makeup worksheet in the Makeupsort.xlsx le so that transactions are sorted rst by sales-
person, then by product, then by units sold, and nally in chronological order from the old-
est to the most recent. To begin, select the least important column to sort on rst, which is
the date column (G3:G1894). Next, in the Sort & Filter group on the Data tab, click the Sort A
To Z button (see Figure 25-10) and, with the Expand The Selection option selected, click Sort
so that all the columns are sorted. The Sort A To Z button sorts numerical data so that the
smallest numbers or oldest dates are on top, and sorts text so that A precedes B and so on.
FIGURE 25-10 Sorting.
The Sort Z To A button, of course, sorts numerical data so that the largest numbers or most
recent dates are on top, and sorts text data so that Z precedes Y.
Next, sort by the second least important column (Units) Z To A because you want larger sales
on top. Then sort from A to Z by Product, and nally from A to Z by salesperson. These steps
achieve the same results as shown in Figure 25-4.
Problems
1. In the Makeupsort.xlsx le, sort the sales data alphabetically by location, then by
product type, then by name, then by date of sale, and nally by units sold.
2. The Sortday.xlsx le contains hours worked on different days of the week. Sort the data
so that Monday data is followed by Tuesday data and so on.
3. The Sorticons.xlsx le contains annual investment returns with an up arrow used to
indicate good years, a horizontal arrow used to indicate average years, and a red ar-
row used to indicate bad years. Sort the data by the icons in the Stock column with up
arrows on top, followed by horizontal arrows, and then red arrows.
4. The le Makeupsortfont.xlsx contains our makeup data with certain dates shown in
blue, red, or brown font. Sort the data so that brown dates are on top, followed by red
dates, and then blue dates.
217
Chapter 26
Tables
Questions answered in this chapter:
■
I have entered in a worksheet the number of units sold and total revenue for each
salesperson, and I can easily compute average price for each salesperson. How can I
create a nice format that is automatically copied if I enter new data? Also, is there an
easy way to automatically copy my formulas when new data is added?
■
I have entered in my worksheet several years of natural gas prices, and I created a nice
line chart displaying the monthly variation in prices. Can I set things up so that when I
add new gas price data, my chart automatically updates?
■
For each sales transaction, I have the salesperson, date, product, location, and size of
the transaction. Can I easily summarize, for example, total lipstick sales in the East made
by Jen or Colleen?
■
How can I easily refer to portions of a table in other parts of my workbook?
■
Do conditional formats automatically apply to new data added to a table?
When most of us use Microsoft Excel, we often enter new data. Then we manually update our
formulas, formats, and charts. What a drag! Now the Excel 2010 table capabilities make this
drudgery a thing of the past.
Answers to This Chapter’s Questions
I have entered in a worksheet the number of units sold and total revenue for each
salesperson, and I can easily compute average price for each salesperson How can I
create a nice format that is automatically copied if I enter new data? Also, is there an easy
way to automatically copy my formulas when new data is added?
The le Tableexampletemp.xlsx in the Templates folder for this chapter (see Figure 26-1)
contains units sold and revenue data for each of six salespersons. You know that new data
will be added beginning in row 12. Also, in column H, you would like to calculate the average
price (Units/Revenue) earned by each salesperson. You would like to create an attractive for-
mat for the data and have the formula for average price copied down automatically as new
data is added.
218 Microsoft Excel 2010: Data Analysis and Business Modeling
FIGURE 26-1 Data for creating a table.
Creating a table allows your analysis and formatting to be automatically updated when you
add data. Begin by selecting the current range of data (E5:G11), including headers. Next,
click Table on the Insert tab or press Ctrl+T. After selecting the My Table Has Headers check
box, you will see that the table range (E5:G11) is formatted beautifully. This formatting will
continue automatically whenever new data is entered into the table. When you are working
in a table, many styles and options are available on the Design tab. (See Figure 26-2.) You can
select a formatting style that will be applied as new data is added to the table.
Note that the column headings have arrows, as you can see in Figure 26-3. These arrows
work as lters that can be used to sort or lter the table. (More on ltering later in this
chapter.)
FIGURE 26-2 Table design options.
FIGURE 26-3 Formatted table with lters.
The cells in the selected table (excluding the headers) are given the name Table1 by default.
I changed the name to Sales in the Properties group on the Design tab. If you click the
Formulas tab and then click Name Manager, you can see that range E6:G11 is named Sales.
The beauty of this range name (and the table) is that the range dynamically expands to in-
clude new rows added to the bottom of the table and new columns added to the right of the
table. In Chapter 22, “The OFFSET Function,” I used the OFFSET function to create a dynamic
range, but the new table capabilities make creation of a dynamic range a snap.
Chapter 26 Tables 219
Suppose that in D15 you want to compute total revenue. Begin by typing =SUM(S.
Excel offers you the option to automatically complete the entry with the table range Sales.
I implemented Autocomplete by double-clicking the range name. You can also implement
Autocomplete by moving the cursor to Sales and pressing the Tab key. Then, when you see
=SUM(Sales and type an opening bracket ( [ ), Formula AutoComplete offers the option to
complete the formula with column headings from the Sales table. (See Figure 26-4.) You can
complete your formula as =SUM(Sales[Revenue]) and calculate total revenue as $155,480.
(See Figure 26-5.) (You will see an example of selecting the entries in the AutoComplete box
that begin with number signs (#) later in this chapter.)
FIGURE 26-4 AutoComplete options for a table.
FIGURE 26-5 Total revenue for original data.
If new rows of data are added, the data in these rows is automatically accounted for in the
formula. To illustrate this idea, you can add new data in row 12: Amanda sold 400 units for
$5,000. As shown in Figure 26-6, the total revenue has increased by $5,000 to $160,480.
The formatting has been extended to row 12 as well, and the total revenue formula has been
updated to include Amanda’s data. Even if data is added within the table (instead of at the
bottom), everything will be updated in a consistent fashion.
220 Microsoft Excel 2010: Data Analysis and Business Modeling
FIGURE 26-6 New data added to table in row 12.
Now suppose that you want to compute in column H the price per unit earned by each
salesperson. Simply type Unit Price in H5 as the column heading, and then in cell H6 type
=SALES[. In the AutoComplete list, click Revenue. The formula is now =SALES[Revenue].
Type a slash (/), and use Formula AutoComplete to complete the formula as
=SALES[Revenue]}/Sales[Units]. An amazing thing happens. Excel automatically copies
the formula down to the bottom of the table in cell H12, as shown in Figure 26-7. If you go
to any cell in column H, the formula appears as [@Revenue]/[@Units]. Of course,
=[@Revenue]/[@Units] is a lot easier to understand than =G6/F6. This formula can be
interpreted as taking whatever is in the current row in the Revenue column and dividing it
by whatever is in the current row in the Units column.
FIGURE 26-7 Unit price formula autocopy.
If you click anywhere in a table, the Table Tools contextual tab appears on the ribbon and
offers choices including the following:
■
Change Table Name Can be used to rename a table. I changed the name from Table1
(the default) to Sales.
■
Convert to Range Converts the table range to normal cells and removes the table
structure.
■
Resize Table Adds or subtracts rows and/or columns to the dened table range.
■
Remove Duplicates Removes rows that contain duplicates. For example, selecting
only the Name column in the Remove Duplicates dialog box ensures that a name will
not occur more than once. Checking both the Names and Units columns ensures that
no rows in the table will match both Name and Units, and so on.
Chapter 26 Tables 221
■
Header Row If checked, displays the header row . If unchecked, the header row is not
displayed.
■
Total Row I discuss the total row later in this chapter.
■
First Column If checked, applies a special format to the rst column of the table.
■
Last Column If checked, assigns a special format to the last column of the table.
■
Banded Rows If checked, gives the even-numbered rows in the table a different
format than odd-numbered rows.
■
Banded Columns If checked, gives odd-numbered columns in the table a different
format than even-numbered columns.
■
Table Styles Select from any of the table formats shown in this group. Of course, if
the table expands or contracts, the format will adjust appropriately.
I have entered in my worksheet several years of natural gas prices, and I created a nice
line chart displaying the monthly variation in prices Can I set things up so that when I
add new gas price data, my chart automatically updates?
In the le Gasprices507.xlsx, the worksheet Original contains natural gas prices per thousand
feet from July 2002 through December 2004. (See Figure 26-8.) As I previously described,
you can select B5:C34 (containing months and prices) and press Ctrl+T to create a table from
this range. Then you can create a line graph to display this data by clicking Line in the Charts
group on the Insert tab and selecting the fourth type of line graph. The line graph I created
is shown in Figure 26-9.
FIGURE 26-8 Gas price data: 2002–2004.
222 Microsoft Excel 2010: Data Analysis and Business Modeling
FIGURE 26-9 Gas price line graph: 2002–2004 data.
Next, I copied this worksheet (by right-clicking the worksheet name, clicking Move Or Copy
Sheet, and then clicking Make A Copy) and added gas prices through July 2006. (The data
now extends to row 53.) I named the new worksheet New Data. Note the line graph in this
worksheet automatically updates to include the new data. (See Figure 26-10.)
FIGURE 26-10 Gas price line graph: 2002–2006 data.
This example illustrates that if you create a table of your data before creating a chart, new
data will automatically be included in the chart.
For each sales transaction I have the salesperson, date, product, location, and size of the
transaction Can I easily summarize, for example, total lipstick sales in the East made by
Jen or Colleen?
The le Tablemakeuptemp.xlsx contains sales transactions. (See Figure 26-11.) For each
transaction, I have the following information: transaction number, name, date, product,
location, dollars, and units sold. If I format this data as a table, I can add a total row for the
Units and Dollars columns and then use the lter arrows to make the total row include the
subset of transactions I want. To begin, place the cursor anywhere within the data and create
a table by pressing Ctrl+T. Note that if you scroll through the table, the header row remains
Chapter 26 Tables 223
visible. With the cursor in the table, select the Total Row check box in the Table Style Options
group on the Design tab. By default, Excel will enter the total number of rows in the table
in cell K1895, which you can delete. Click the arrows to the right of cells I1895 and J1895,
and then click Sum. This totals all entries in columns I and J of the table. Thus, currently
the total revenue is $239,012.67, and 78,707 units were sold. (See Figure 26-12 and the le
Tablemakeuptotals.xlsx.)
FIGURE 26-11 Makeup sales data.
FIGURE 26-12 Total revenue and units sold.
To make the totals reect only lipstick sales in the East made by either Jen or Colleen, click
the arrow in F3 (to the right of the Name header). Clear the Select All box so that no names
are selected. Then select the check boxes for Colleen and Jen (see Figure 26-13), and click OK.
Next, click the Product arrow and select the lipstick check box, and then click the Location
arrow and select the East check box. Use the same approach to show only lipstick in the
Product column and only East in the location column. You now see all the data tting the
224 Microsoft Excel 2010: Data Analysis and Business Modeling
ltering criteria in Figure 26-14 and in the le Tablemakeupnal.xlsx. You’ll see that Colleen
and Jennifer sold 497 units of lipstick in the East for a total of $1,515.89. This table ltering
feature makes it a snap to easily compute totals for any subset of rows in an Excel worksheet.
If you want, you can also copy the rows involving Colleen or Jen selling lipstick in the East
and paste them elsewhere.
FIGURE 26-13 Selecting names from the table.
FIGURE 26-14 Filtered subtotals for units and revenue.
Chapter 26 Tables 225
How can I easily refer to portions of a table in other parts of my workbook?
The le Tablestructure.xlsx shows many examples of how you can refer to parts of a table
when you are working outside the table’s range. These references are often called structured
references. (See Figure 26-15.) When you enter a table name into a formula, AutoComplete
makes the column names and the following table speciers available for selection:
■
Table Name All cells in the table, excluding the header and total rows.
■
#All All cells in the table, including the total row (if any).
■
#Data All cells in the table except for the rst row and the total row.
■
#Headers Just the header row.
■
#Totals Just the total row. If there is no total row, this returns an empty cell range.
■
#This Row All table entries in the current row.
A column reference includes all cells in a table column, excluding the header and total row
entries (if any).
Here are some examples of how table speciers can be used in formulas:
■
In cell C15, the formula =COUNTA(Table1[All#]) yields 55 because the table contains 55
entries.
■
In cell C16, the formula =COUNTA([Table1]) yields 45 because the header and to-
tal rows are not counted. In cell C17, the formula =COUNTA(Table[#data]) yields 45
because the cell range D5:H13 is referenced.
■
In cell C18, the formula =COUNTA(Table1[#Headers]) yields 5 because only the header
row (D4:H4) is referenced.
■
In cell C19, the formula =SUM(Table1[Q1]) yields 367 because the formula sums the
entries in E5:E13.
■
In cell C20, the formula =SUM(Table1[#Totals]) sums up all entries in the total row and
yields 1,340, which is the total sum of all table entries.
■
In cell C21, the formula =SUM(Table1[[Data#],[Q1]:[Q3]]) sums up all data entries that
are in columns Q1:Q3, inclusive (cells E5:G13). Thus, column names separated by a colon
include all data entries between and including the column name before the colon and
the column name after the colon.
■
In cell B8, the formula =SUM(Table1[#This Row]) sums the entries in row 8
(41+28+49+40).
Of course, all of these formulas are automatically updated if new data is added to the table.
226 Microsoft Excel 2010: Data Analysis and Business Modeling
FIGURE 26-15 Structured references.
Do conditional formats automatically apply to new data added to a table?
Yes, conditional formats will automatically include new table data. (See Figure 26-16.) To
illustrate, I placed in worksheet Original of le Tablestructure.xlsx a conditional format to
highlight the three largest Q1 sales in column E. Then entries in rows 7, 12, and 13 are high-
lighted. In worksheet Add Biggersale, I added in cell E14 the entry 90. This becomes the
largest entry in the column and is immediately highlighted. Cell E7 is no longer highlighted
because it is no longer one of the three largest numbers in column E of the table.
FIGURE 26-16 Conditional formatting extends automatically to new table data.