Candlestick and pivot point trading triggers setups for stock forex and futures markets 2007 phần 5 pot
Bạn đang xem bản rút gọn của tài liệu. Xem và tải ngay bản đầy đủ của tài liệu tại đây (3.59 MB, 37 trang )
Lining Up the Numbers
When the market goes through the projected daily target numbers, I then
use the next time periods for a better gauge or reliability as to the next price
objective. That is where the significance of the weekly and the monthly
numbers comes into play.
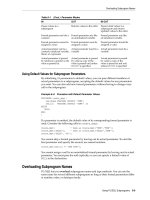
Back in the late 1990s when I owned a brokerage firm, I developed a
method to help me line up the pivot point levels as shown in Figure 5.8; I
had all my brokers use these numbers, and many still do to this day. The
table of information was for the trading session of 1/18/2006.
My method categorizes the pivot point levels to the various market con-
ditions, such as neutral (Target Key) bullish, and bearish. I like to know
what the prior time period’s range and close were for fast access, so I in-
cluded that in as well. Since the pivot point is important, I include that on
the sheet, as shown in the last column on the right. The third column from
the right states Market Direction. That is a moving average of the actual
pivot point.
If the pivot point and the close or settlement price are below the mar-
ket direction number, then the market condition is deemed to be in a bear-
ish mode; and it helps me to line up the R-1 and S-1 numbers as the
projected target range for that next session. If you look down the far-left
134
CANDLESTICK AND PIVOT POINT TRADING TRIGGERS
FIGURE 5.7
c05.qxd 9/25/06 8:24 AM Page 134
135
FIGURE 5.8
Used with permission of www.nationalfutures.com.
c05.qxd 9/25/06 8:24 AM Page 135
136 CANDLESTICK AND PIVOT POINT TRADING TRIGGERS
FIGURE 5.9 Bonds trade the predicted pivot range.
Used with permission of esignal.com.
column to where you see “Bonds,” you will see that the market direction
number classified the market condition as bullish due to the location of the
previous settlement and that the pivot point was above the pivot point mov-
ing average.
The numbers targeted the high in bonds to be 115
10
⁄
32 (R-2) and the low
to be 114
16
⁄
32 (S-1). The pivot point was 114
23
⁄
32.
Since the market closed at 114
28
⁄
32, there was a strong chance to see
115
10
⁄
32, as well as a low of 114
16
⁄
32. Figure 5.9 shows the exact trading session
activity on a 15-minute candle chart. If you are a candle chart aficionado,
you will have spotted that the high was formed by a shooting star pattern
and that the low was made by a bullish engulfing pattern. While the market
broke out above the targeted resistance, it certainly did not stay there long.
Notice how the price penetrated the low but reversed off the projected low
as well. We will use this chart later in the book as we share statistical in-
formation on which candle patterns have high frequency of forming tops
and bottoms. At this point, just heighten your awareness that there was a
doji after the star at top and a doji near the bottom.
This chart also has another component—a moving average method
that we will discuss a variation of as well. By using the true value of the
c05.qxd 9/25/06 8:24 AM Page 136
market, which I refer to as the pivot point, we can help determine the mar-
ket condition and the projected price ranges as well as potential turning
points as market conditions change from bullish (uptrend) to bearish
(downtrend).
Pivots Combined with Candles
The CBOT mini-Dow is one of several great day trading futures products for
selecting trades that connect with pivot and candle patterns as Figure 5.10
shows. Notice how prices do penetrate briefly above the pivot targeted high
by forming the shooting star candle. See the market’s reaction as the price
declines over 70 Dow points (each point is $5 on the mini-Dow). That is a
$350.00 move in less than 75 minutes per contract. Since most futures firms
carry a $500.00 day trade margin per contract that translates into a healthy
return. Now that we know how to line up the numbers, we need to wait for
a setup or signal to trigger a short position. The shooting star, the moving
average crossover, and the dark candles all confirmed a technical signal
to sell.
Pivot Points 137
FIGURE 5.10
Used with permission of esignal.com.
c05.qxd 9/25/06 8:24 AM Page 137
The graph in Figure 5.11 represents the e-mini–S&P 500 Stock Index
Futures on November 10, 2005; the targeted range was determined to be S-
1 and R-2, a bullish market condition. The actual low of the day was formed
by a hammer candle pattern (keep notes of what candle patterns form near
tops and bottoms, as we will be discussing this in detail in later chapters).
A buy signal is triggered with the sequence of higher highs and higher lows
but, more important, higher closing highs, as well. The moving average
crossover also helps trigger a long buy signal. The market rallies right up
within a tick or two of the R-2 number. As a day trader, it is great to have a
predetermined exit strategy. In this case, pivot point analysis accommo-
dated you in that respect. Other times, you will need to rely on your timing
to exit a trade; for example, as a day trader, once the market is near the
close of the business day, you should be offsetting your position. In the ex-
ample in Figure 5.11, you had a timing and a price element working for you
to help target an exit on what was a beautiful trade. The trigger to go long
was after the crossover of the moving average one candle after 11:30, as
prices established a higher closing high.
This trade would have resulted in a stellar 12.50-point gain from the
FIGURE 5.11 Bonds trade the predicted pivot range.
Used with permission of esignal.com.
138 CANDLESTICK AND PIVOT POINT TRADING TRIGGERS
c05.qxd 9/25/06 8:24 AM Page 138
Pivot Points 139
entry of 1221.50 up to the exit, which was 1233. The exit was triggered on
the first lower closing low and was confirmed by a close back under the
moving averages. On a day trading margin per contract in the e-mini–S&P
of $1,000 (brokerage firms vary on day trading margins), you picked up
625.00 per position.
The next chart I want to show you in Figure 5.12 is an example of how
a market, when targeted to be in a bullish mode, interacts with the series of
pivot support and resistance numbers. If there is a bullish bias, then S-1 up
to R-2 will be the potential range. Therefore, we are looking to take buy sig-
nals at support and have a profit objective in mind near R-2. This is a 15-
minute candle chart using the mini–Russell Stock Index futures. Notice
that as the market trades near the pivot support of S-1, prices consolidate
for almost two hours before triggering the buy signal as a higher closing
high and a crossover of the moving averages confirm the trigger to go long
at 657.50.
Prices penetrate the R-1 level and come close to the projected S-2 level.
As the trading session ends, you still have no reason to exit the position from
a technical standpoint except that as a day trader, your time is your exit
point. This trade was good for nearly a 9.50-point run, or $950 per contract.
FIGURE 5.12
Used with permission of esignal.com.
c05.qxd 9/25/06 8:24 AM Page 139
Let’s look at a spot forex market in Figure 5.13. We are looking at the
yen versus the U.S. dollar. The targeted resistance was the R-2; and as you
can see, the top was formed by an evening doji star formation, based on a
five-minute candle chart. Combining the knowledge of how to determine
the right pivot level with practicing the discipline to wait for a signal will
certainly help you target and select better trading opportunities. As you
can see in this chart, on a $100,000 lot size, you would have realized over a
100-point gain in less than two and a half hours. That translates to $1,000
per lot or contract.
Special note: Big moves do occur in forex during the U.S. nighttime.
This trade signal hit at 20:00 hours, or 7
P
.
M
. (ET). So depending on your
trading capital and time constraints during regular market hours, the po-
tential opportunities that abound in the spot currency markets may be suit-
able for you to take advantage of.
140
CANDLESTICK AND PIVOT POINT TRADING TRIGGERS
FIGURE 5.13
Used with permission of esignal.com.
c05.qxd 9/25/06 8:24 AM Page 140
THE IMPORTANCE OF CONFLUENCE
Time is an essential element in trading. There are many instances when
traders are correct in their predictions for a top or a bottom in a market;
but they are off in their timing, which results in a loss. Many analysts
were calling for a top or for the bubble to burst in the stock market in 1999.
In that situation, not demonstrating patience to wait would have resulted
in dramatic loss of profit potential or worse, actual losses due to selling
short stock too early. How about economists’ predictions of a housing
bubble back in 2003 and their expectations for a decline in real estate
prices? By July 2006 we had started to see prices go back down but not
to the severity as was predicted and certainly not at the time that was
expected by economists. I can go on and on with examples when prog-
nostications were correct, but timing was really wrong, resulting in a fi-
nancial loss.
Time and Price
As I stated earlier, pivot point analysis relies on both time and price
specifics in its calculations to project future support and resistance levels.
By incorporating price data for various time frames, such as daily, weekly,
and monthly, the more price areas that coincide with the different time pe-
riods, the greater is the likelihood that these price clusters will repel the
market’s advance in an uptrend or cause prices to reverse in a downtrend.
This clustering, or confluence, from more than one time period that con-
vergences with another is an awesome event and can translate into a very
lucrative setup. The time frames of numbers that target a specific price
level is termed confluence; in other words, the more corroborating numbers
that target a general area, the greater is the significance of that specific tar-
geted price level. Pivot calculations work to pinpoint almost exact times
and prices for trades in various markets and can be used to validate other
analysis. Remember this phrase: “There is always strength in numbers!”
The more pivot numbers that line up, the greater is the potential for a reac-
tion off those levels. This knowledge, combined with identifying the shift in
momentum by identifying and acting on strong triggers, increases the prob-
ability of a successful trade.
As an example, Figure 5.14 shows the daily, weekly, and monthly pivot
point numbers drawn across the chart; this gives a trader a heads up that
the market may reach an unsustainable extreme or oversold market condi-
tion. Just by looking at the graph, you can see that the market has been in
a prolonged downtrend. Generally, the market may stop its descent at a
Pivot Points 141
c05.qxd 9/25/06 8:24 AM Page 141
confluence support zone; then you would want to wait for a shift in mo-
mentum to trade a potential price reversal. When the market starts to give
clues as to a bottom, you can determine a low-risk entry, as a bottom has
been defined. What would not be known is how high the market’s reaction
will be off this target level of support. This is where the candle chart section
will play an important role in helping to determine the strength of the
trend’s reversal.
In Figure 5.15, we have a weekly stock chart on Alcoa. Here we see a
confluence of two higher-degree time periods, such as the weekly and
monthly support numbers. What is uncanny is that the weekly pivot S-1 tar-
get low number was 22.33, with the actual low coming in at 22.28, just pen-
nies below the pivot support number. The monthly number lined up a little
higher than that at 22.99, which is a slightly wider margin of error. Remem-
ber, when I am trading, I am not looking to catch a falling knife by antici-
pating a bottom, even though in this example you could have placed a buy
order at the weekly number; and as the price moved through your buy
order, you may have been filled—and that was a great buy. However, the
better course of action, and the more reliable method to trade off this con-
fluence area, was to wait for a confirmed buy signal, such as the high close
doji signal (we go over that in Chapter 7). Notice the moving average
crossover and that prices confirm a conditional change in the market by
closing above the open and closing above both moving average compo-
nents. The true buy signal was generated at 24.20, and the risk would be
using a stop below the low at 22.28.
142
CANDLESTICK AND PIVOT POINT TRADING TRIGGERS
FIGURE 5.14
c05.qxd 9/25/06 8:24 AM Page 142
Volatility Is Good
As long as there is trading volume—liquidity so you can enter and exit po-
sitions and price movement, otherwise known as volatility—pivot point
analysis will work in any market for position traders and short-term day
traders. No matter what your choice is for a trading investment vehicle, it
makes no sense that you would not want to incorporate this methodology
into your trading style. Let’s examine the chart in Figure 5.16, which is a
daily look at a spot forex euro currency versus the U.S. dollar. The monthly
S-2 target low was 116.90, the weekly S-1 lined up in close proximity at
116.58, and the actual low was 116.41. Looking at the market’s reaction
three days after the low, we see a bullish engulfing pattern. The confluence
of pivot support numbers gave one of the best and only predictive support
targets. Therefore, it should be noted that the longer-term numbers should
be watched carefully for clues not only for trading opportunities to enter
positions but also as a warning that the current trend could be exhausted
and potentially reverse. At the very least, you may not have wanted to es-
Pivot Points 143
FIGURE 5.15
RealTick graphics used with permission of Townsend Analytics, LTD.
c05.qxd 9/25/06 8:24 AM Page 143
tablish a long position; you certainly would have been alerted not to sell
short at the low.
Let’s examine the 15-minute candle chart in the 30-year Treasury bonds
(T-bonds) shown in Figure 5.17. Once again, the market price scrapes
against the lows, and a hammer pattern forms the exact bottom. But notice
that the weekly pivot S-1 support target is 112
14
⁄32, which coincides with the
daily S-1 support target of 112
20
⁄32. The actual low was 114
15
⁄32! Notice that the
market broke the daily support but did not make much of a decline and cer-
tainly did not remain below the support for a long period of time. That
leads me to this point: There are those who believe that once a support
level is violated, you should go with that breakdown momentum and sell
short. That may work occasionally, but it needs to be defined in more de-
tail, with a list of special rules and certain criteria in order for that to be an
automatic trading rule for me to initiate a trade. I believe that you should
look for buy signals at support and for sell signals at or near resistance, es-
pecially when there is a confluence of pivot point price targets. It is more
fruitful in buying the projected support, as this example shows.
In Figure 5.17, we see a trigger to go long after the high close doji trig-
144
CANDLESTICK AND PIVOT POINT TRADING TRIGGERS
FIGURE 5.16
RealTick graphics used with permission of Townsend Analytics, LTD.
c05.qxd 9/25/06 8:24 AM Page 144
ger is made at 112
18
⁄32 (notice that the low was also formed by a hammer). As
the market goes into trend mode and rallies nearly a full basis point higher,
the signal to liquidate occurs once we see prices change conditions. As the
candles indicate, prices are closing below each period’s open; a lower clos-
ing low from a doji top occurs and the moving averages cross; and, finally,
the market price closes below both moving averages. That triggers the exit
at 113
14
⁄32. This was a 28-point (each thirty-second is 31.25 per point) gain for
$875.00 profit per position on a day trade.
CONFLUENCES WORK AT TOPS
We have all heard in the field of technical analysis that what works for
some patterns or signals is not applicable for all situations. However, the
power of pivot point confluences does work at market tops as well as work-
ing to indicate bottom reversals, as we just went over. In Figure 5.18, once
again the three main time periods that we use are the monthly, the weekly,
and the daily. When a congestion of pivot numbers line up, or cluster, near
Pivot Points 145
FIGURE 5.17
Used with permission of esignal.com.
c05.qxd 9/25/06 8:24 AM Page 145
a specific price zone, this heightens your awareness for possible reversals.
It is important to note that if a market has been in a long uptrend, say for
more than two months, and if the end of the quarter is near, the market is
ripe for a profit-taking correction. Generally speaking, professional trading
managed funds receive payment by a performance fee (profits) at the end
of a quarter. Since many of these large trading entities use pivot analysis or
are aware that others use them, when a confluence of resistance develops,
especially near the end of a quarter, look out below. It not only marks a
prime price level but also indicates a specific reason why a profit-taking
correction can occur at that time period. The same holds true for bottoms.
After a long price decline, if the numbers line up and if it is near the end of
a quarter, a profit-taking reversal could be in the works. That does not mean
to say that the original trend won’t resume, but you could take a great coun-
tertrend reversal trade. Generally speaking, market sell-offs have more ve-
locity; therefore, spotting resistance confluences can result in very
lucrative opportunities, under the right circumstances.
Earlier, I explained the saying “There is always strength in numbers.”
The concept can be explained further in that there is a strong analytical
value found in the number three, not just in trading and technical analysis
but also in our universe. As you may be aware, the number three is a Fi-
bonacci number; and when I look at confluences in the three different time
periods, “three” represents the three different groups of traders. The daily
numbers are used by day traders, the weekly numbers are used by swing
traders, and the monthly numbers are used by longer-term position traders
and institutions. Even in the Commodity Futures Trading Commision
146
CANDLESTICK AND PIVOT POINT TRADING TRIGGERS
FIGURE 5.18
c05.qxd 9/25/06 8:24 AM Page 146
(CFTC) COT report, there are three classifications of traders: reportable,
commercials, and non-reportable. The number three is a highly correlated
number in market analysis. The coincidental factor in pivot pont analyses
derives from the fact that one set of numbers from one time frame gener-
ally has nothing to do with another. If you look at the data for the Japanese
yen spot forex data in Table 5.1, you will see that the high and the close of
the week coincided with the daily high and close, as that was on a Friday.
Let’s look at Figure 5.19 and see how the numbers in the spot forex
Japanese yen line up. The market made a tremendous price move from the
Pivot Points 147
TABLE 5.1 Japanese Yen Spot Forex
Prior Period High Low Close
Monthly—November 119.95 116.37 119.80
Weekly—12/02/2005 121.24 118.33 120.59
Daily—12/02/2005 121.24 120.19 120.59
FIGURE 5.19
RealTick graphics used with permission of Townsend Analytics, LTD.
c05.qxd 9/25/06 8:24 AM Page 147
low of 108.76 on September 5, 2005, until the high was made on December
5, 2005, at 121.40.
Let’s review before we go further. If you recall in Chapter 1, I stated
that forex traders can borrow information from the futures industry. One
such piece of data is the CFTC Commitment of Traders report. In essence,
this report reveals whose hands “control” the market. Except for the yen, all
currencies are quoted as the currency versus the U.S. dollar. The yen fu-
tures are quoted as the opposite—as the spot forex markets. So spot forex
would quote the yen as 117.35; the futures quote would be .8572. What this
means is that when the CFTC report shows a net short position, traders are
in a long position in the spot yen forex markets against the dollar. As the
CFTC report showed at the end of the trading session as of 11/29/2005, the
funds, or the “non-commercials,” were long 22,626 contracts and short
86,626. That is a net short position of 64,000 contracts. Each contract is
1,250,000 worth of yen! The “commercials” were long 154,396 contracts and
short 85,604 positions. The small speculators were long 29,368 contracts
and short 34,160 positions. This means the banks, or “smart money,” estab-
lished a protective hedge position in the futures, betting that the spot yen
would fall in value against the dollar. Keep in mind that the non-commer-
cials are considered professional speculators; they, too, are considered the
smart money. The difference is that they are speculating and will not gen-
erally take delivery of a futures contract, which is 1,250,000 worth of Japan-
ese yen.
If we examine Figure 5.19 closely, we notice that after a substantial
price appreciation in a relatively short period of time, prices hit just past the
monthly R-1 of 121.04. Remember that the low on September 5, just three
months earlier, was 108.76. So the market made a huge up move, and the
banks and institutions or commercials were betting prices would fall. The
ends of the year and of the quarter were closing in, and we were hitting up
against a confluence of pivot point resistance. The weekly R-1 was 121.77;
and on the day the actual price high occurred at 121.40, the daily pivot R-1
was 121.16. When we combine the pivot point resistance levels with a few
bearish candle patterns, such as the rickshaw doji that formed the day be-
fore the high or the trigger to initiate a sell that occurred on the third day
after the target high was made you have a high chance to see a negative
market reaction on price reversal. Market tops that align with a cluster, or
confluence, of various pivot points can result in tremendous market rever-
sals, as this example shows, especially as they coincide with a major con-
sensus reading toward the end of the quarter.
The power of a sell-off does not necessarily have to occur near the end
of a quarter. In equities, end-of-year tax-loss selling prevails; and at the
first of the new year, as pension funds are buying stock, others are looking
to cash out their profits for tax deferment purposes. As the Chicago Board
148
CANDLESTICK AND PIVOT POINT TRADING TRIGGERS
c05.qxd 9/25/06 8:24 AM Page 148
of Trade (CBOT) mini-Dow chart in Figure 5.20 shows, the monthly target
resistance R-2 was 11105, the weekly R-1 was 11101, and the daily pivot
target number was 11076 on 1/11/2006. The exact high was 11086! That top
marked a 413-point decline, as the low was 10673 just six trading days
later. The power of pivot point confluence from the prevailing three time
periods demonstrated that there was significant resistance; and the ac-
tions of the three groups of traders may have joined together in identifying
that area as a spot to sell. In Table 5.2, we see that the data collected to de-
termine the pivot point resistance levels from the three time frames were
all noncorrelated to some degree. The closing, or settlement, prices all
had different values, as did the highs and lows of each time frame. The pur-
pose for identifying a confluence zone is to heighten your awareness that
a potentially substantial move may be on the horizon and that a bigger re-
versal reaction may occur, giving a trading opportunity longer than a day
trade. Once you identify an opportunity, you can apply a strategy. In this
case, you might have been able to make a choice among selling Dow fu-
tures, buying put options on the futures, or selling the exchange traded
fund (ETF) diamonds.
Pivot Points 149
FIGURE 5.20
RealTick graphics used with permission of Townsend Analytics, LTD.
c05.qxd 9/25/06 8:24 AM Page 149
In fact, let’s look at the actual chart pattern on that day to see what oc-
curred. In Figure 5.21, the date and time are stamped at the bottom of the
graph; and you will see we have a 15-minute candle chart showing that the
high was made at the end of the day, formed by a pair of shooting stars fol-
lowed by a doji.
These candle formations are very ominous signs indicating a bearish
tone; but, due to the end of the trading day, it hardly makes for a trading op-
portunity for a day trader to take a short position. However, the data did
give a trader a great opportunity to look at a profit objective from an earlier
long position, as the confluence of pivot point resistance levels and the
150
CANDLESTICK AND PIVOT POINT TRADING TRIGGERS
TABLE 5.2 Pivot Point Confluences for Dow
Prior Period High Low Close
Monthly—December 11007 10728 10744
Weekly—1/06/2006 11014 10720 10998
Daily—1/10/2006 11058 10990 11052
FIGURE 5.21
Used with permission of esignal.com.
c05.qxd 9/25/06 8:24 AM Page 150
candle patterns confirmed that the bullish momentum was fading. In addi-
tion, once the market confirmed a top pattern, the day trader would be able
to shift his or her trading plan from buying breaks to taking selling oppor-
tunities as the trend conditions changed and there was overhead pivot
point resistance.
Looking at Figure 5.22, we see how the pivot points from the three
time frames (daily, weekly, and monthly) target the high near the 1300
level. The actual high was 1301.
In Table 5.3, you can see that the three sets of data (high, low, and
Pivot Points 151
TABLE 5.3 Pivot Point Confluences for S&P
Prior Period High Low Close
Monthly—December 1285.00 1251.25 1254.75
Weekly—1/06/2006 1293.00 1251.50 1291.75
Daily—1/10/2006 1296.75 1289.25 1296.00
FIGURE 5.22
RealTick graphics used with permission of Townsend Analytics, LTD.
c05.qxd 9/25/06 8:24 AM Page 151
close) from three different time periods are different values. So the coinci-
dental factor really highlights the importance of pivot point confluences.
In Figure 5.23, the confluence of pivot points in the CBOT 30-year
bonds shows a setup similar in resistance levels to both the S&P and the
Dow in the examples in Figures 5.20 and 5.22 from the daily chart perspec-
tive. In fact, in this case, the bonds peaked nearly at the same time as the eq-
uity markets. This is a great point to bring up now; we will see periods in
the market where intercommodity or intermarket relationships change.
Stock and bond prices go in phases of parallel price moves, and then there
are periods in time where they decouple. Generally speaking, when interest
rates decline, bonds and stocks move higher. Then there are times when
stocks move sharply lower and bond prices move higher because they offer
security, which is known as a “flight to quality.” And then there was 2005,
when interest rates were rising and stocks and bonds moved in sync. Know-
ing when these changes in market relationships occur is helpful; however,
it is best at times to trade the markets independently of each other. This is
where identifying pivot point confluences based on two or three time
152
CANDLESTICK AND PIVOT POINT TRADING TRIGGERS
FIGURE 5.23
RealTick graphics used with permission of Townsend Analytics, LTD.
c05.qxd 9/25/06 8:24 AM Page 152
frames will help you as a trader because you have predetermined price tar-
gets figured out in advance.
As Figure 5.23 shows, the daily and weekly numbers were more accu-
rate in determining the top. The monthly number was slightly higher by
10
⁄
32,
a small margin of error. The important element to remember here is that we
are not looking to pick an exact top; rather, we are looking for a reason and
an area that offers a high degree of accuracy in helping to pinpoint a top or
a bottom and then looking for a secondary signal to trigger, or initiate, a
trade. The importance and coincidental factor in the theory of confluences
is once again that the numbers derived from the various time frames are
generally noncorrelated. Table 5.4 shows that the high in December was
from a different time period and had an assigned value different from the
weekly or daily number; and the same holds true for the low and the clos-
ing values.
The relationship that exists between geopolitical issues and economic
conditions (such as inflation, interest rates, foreign currencies, and gold)
from a historic perspective has been easy to track. In general terms, at
times when the dollar goes up in value, gold prices decline. When interest
rates climb, lease rates are more expensive, therefore putting downward
pressure on gold. Gold prices also move higher as investors buy gold as a
safe haven investment, as it acts as cash as well in times when doubt ex-
ists over the stability of a country’s economic condition or when currency
values change, as happened in the middle of 2005 when dissention among
euro zone countries existed and riots due to political instability in France
developed.
By late 2005, the dollar rallied as interest rates climbed, widening the
interest rate differentials between the United States and foreign countries.
Gold rallied sharply higher on these events, from the low on February 8,
2005, at 410 per ounce. By the end of 2005, gold had made a high of 540 per
ounce. By January 20, 2006, gold continued its ascent by making a high at
568.50 in the February futures contract.
The market had made a sharp rally, but the confluence of resistance
numbers held the market back, as shown in the 15-minute chart in Figure
5.24. In this chart, you will see the bearish engulfing pattern form as the
Pivot Points 153
TABLE 5.4 Pivot Point Confluences for Bonds
Prior Period High Low Close
Monthly—December 115 111
8
⁄32 114
6
⁄32
Weekly—1/13/2006 114
24
⁄
32 113
3
⁄
32 114
22
⁄
32
Daily—1/17/2006 114
30
⁄
32 114
11
⁄
32 114
28
⁄
32
c05.qxd 9/25/06 8:24 AM Page 153
market makes a violent reversal. Longer-term prices did recover and moved
even higher as of the writing of this book. The point is that by using pivot
points combined with candle patterns, you can time your entries and exits
in the market for a better price point. That is an outstanding advantage
from a risk-reward perspective.
In this example, prices did stall over time before continuing higher.
However, the weekly and monthly resistance targets kept prices in a con-
solidating pattern, as you can see from the daily chart in Figure 5.25. It is in-
teresting to note that the exact high was formed by a shooting star pattern.
The value in using and identifying these confluence levels is that a
trader/analyst/investor is given both elements for successful trading: price
objectives combined with a specific time period. It is up to the trader to
manage a trade or to identify the magnitude of the reversal. Not all out-
comes are the same, but the markets do react off these numbers; so that is
why we are looking to combine pivot point analysis with another dimension
of market analysis.
The second part of the trading equation using pivot points is combining
the idea of how to filter the numbers to help identify which support or re-
sistance numbers to use to determine market condition. Remember we cov-
154
CANDLESTICK AND PIVOT POINT TRADING TRIGGERS
FIGURE 5.24
Used with permission of esignal.com.
c05.qxd 9/25/06 8:24 AM Page 154
ered the fact that in a bearish market condition, the actual pivot point
would act as resistance. Confluence, or the cluster of support or resistance
numbers, also works within a specific time period. For example, when the
actual pivot point lines up at or near the market direction number or mov-
ing average of the pivot point and a resistance target number, we should
study that specific price zone for signals that indicate a shift in momentum.
This is the part where we need to comprehend what the charts and price ac-
tion are revealing.
Candle patterns do just that in a clear visual manner. As you look at Fig-
ure 5.26, you will see that the exact high of the trading session on 1/20/2006
was formed by a doji. A confluence existed with the lining up of the daily
pivot point, the market direction numbers, and the R-1. The market never
even had the strength to test the resistance levels. By the end of the day, the
Dow fell another 100-plus points from the last price you see on this chart—
the low was 10673 that day. Once the low close doji signal occurred and the
shift in momentum occurred by making lower closing lows, a sharp sell-off
developed.
The September 2004 Active Trade Magazine published an article I
wrote and made it a cover story. It was on the power of pivot point conflu-
Pivot Points 155
FIGURE 5.25
Used with permission of esignal.com.
c05.qxd 9/25/06 8:24 AM Page 155
ence and how calculating pivot points on more than one time frame can
help identify certain price levels that are likely to repel prices. The article
(p. 68) was titled “Pivot Points and Right Side Chart Analysis.” You may
have read that article or seen the issue—it was the one with President Bush
and Senator Kerry on the cover. The article’s focus was on not only entry
prices and risk management, but also profit objectives and how to trade
around the support and resistance numbers. What was most interesting
about that article was the fact that the confluence of daily, weekly, and
monthly numbers lined up near 1160 (see Table 5.5) and the exact high for
March 5, 2004, was 1163.50.
156
CANDLESTICK AND PIVOT POINT TRADING TRIGGERS
FIGURE 5.26
Used with permission of esignal.com.
TABLE 5.5 Confluence
Time Frame Confluence Number
Monthly R-1 1161.50
Weekly R-2 1162.00
Daily R-2 1159.25
c05.qxd 9/25/06 8:24 AM Page 156
The average price level derived from the confluence numbers was
1161.00. The high for the year took less than 15 minutes to form and was
made by a doji and a shooting star on a 5-minute chart, as Figure 5.27
shows. That high held for 11 months, until after the November elections.
The point to this example is that the power of confluence worked to repel
prices. The outcome can be different each time, meaning we don’t know
what the percentage of retracement of price reversal will be. The general
idea, however, is that as a trader you should respect the notion that the
market will at least pause and more than likely generate a significant trad-
ing opportunity.
The particular setup that initiated a sell signal was my signature low
close doji trigger, one of the patterns on which we go into detail in the next
few chapters! This pattern and the high close doji at or near pivot point sup-
port targets are the highest probability trade signals I use.
Pivot Points 157
FIGURE 5.27
Used with permission of esignal.com.
c05.qxd 9/25/06 8:24 AM Page 157
SUMMARY
Remember that pivot point support and resistance levels are a great gauge
of what a potential turning point or a predicted range in a given time period
will be. The more time periods or confluence of target numbers that line up,
the higher is the probability that a strong market reaction will occur. There-
fore, it is important to raise your attention when prices reach these pre-
dicted price support and resistance numbers. If you apply proper risk and
trade management techniques, as will be covered in the next few chapters,
you should see a tremendous turnaround in your trading performance.
158 CANDLESTICK AND PIVOT POINT TRADING TRIGGERS
c05.qxd 9/25/06 8:24 AM Page 158