ESSENTIALS of Balanced ScorecardMohan phần 3 pot
Bạn đang xem bản rút gọn của tài liệu. Xem và tải ngay bản đầy đủ của tài liệu tại đây (152.71 KB, 27 trang )
to consequently adjust the strategic thrusts creates a resilient organization
able to change and adapt as the stated goals are challenged by both in-
ternal and external forces.
Making BSC Work
Making BSC work generally requires the following steps:
1. Identify the purpose of the organization with mission, vision, and
values.
2. Clarify strategy with an eye to competencies the organization has
or can attain.
3. Break strategy into key themes that the organization can absorb.
4. Draw on strategy maps to understand cause-and-effect relation-
ships between four-plus perspectives.
5. Develop performance measures within each perspective but also
between perspectives, showing a balance of measures as well.
6. Build key scorecards around each objective and sub-objectives
and initiatives.
7. Cascade theses objectives and initiatives with mutually organized
measures to all levels of the organization to be used, shared, and
evaluated on regular intervals.
Summary
Balanced Scorecard is a framework designed by Professor Robert Kaplan
and David Norton.As the name implies, Balanced Scorecard is a method-
ology to solve challenges in balancing the multiple perspectives demanded
of strategy with its execution. In a nutshell, BSC is a methodology for
translating strategy into action. It has the following characteristics:
•
Its methodology is suited for managing business strategy.
•
It uses a common language at all levels of the organization.
•
It uses a common set of principles to manage day-to-day oper-
ations as well as to framework the company’s strategy.
30
ESSENTIALS of Balanced Scorecard
4239_P-02.qxd 3/11/04 2:36 PM Page 30
•
It is designed to identify and manage business purposes.
•
It provides a balance between relatively opposing forces in
strategy:
•
Between internal and external influences
•
Between leading and lagging indicators and measures
•
Between financial and nonfinancial goals
•
Between organizational silos focused on their own goals and
an overarching framework of goals
•
Between finance priorities and operations
•
It aligns strategic goals with objectives, targets, and metrics.
•
It cascades to all levels of the organization.
The framework digests strategy but also focuses strategy into four per-
spectives of objectives. These perspectives may contain more than one
strategic theme, and each theme is measured using performance mea-
sures. Each theme is also related to the others by cause and effect.This is
the beauty of BSC, as it highlights cause and effect using a strategy map,
a pictorial description of strategy and the relationships between the var-
ious perspectives.
31
What Is Balanced Scorecard?
4239_P-02.qxd 3/11/04 2:36 PM Page 31
4239_P-02.qxd 3/11/04 2:36 PM Page 32
From Management to
Performance Management
33
CHAPTER 3
After reading this chapter, you will be able to
•
Understand why information is no longer power.
•
Understand what data obesity and knowledge starvation are.
•
Understand the nature of information and its behavior.What
brings relevance to information?
•
Understand the ecosystem that feeds a Balanced Scorecard.
•
Understand what performance measures are and what their
types are.
•
Understand the differences between leading and lagging
indicators.
•
Understand the relationship between co-related and non–
co-related indicators.
•
Understand the main perspectives in BSC; namely, financial,
customer, internal, and learning and growth.
•
Understand what targets, measures, initiatives, and objectives
are.
C
hris Meyer, author of Fast Cycle Time and Blur, says, “Marketing
tracks market share, operations watches inventory, finance monitors
costs and so on. Such results measures tell an organization where it
stands in its effort to achieve goals but not how it got there or, even more
important, what it should do differently.”
1
4239_P-03.qxd 3/11/04 2:35 PM Page 33
It is estimated that only 3 to 5 percent of corporate information is an-
alyzed.Why is this not a surprise? Watch any business in the 2000s and note
that executives are inundated with faxes, electronic mail, telephone mes-
sages, conference proceedings, direct mail, telemarketing calls, paper mail,
and reports. In fact, if they actually read and analyzed everything they re-
ceived, they would not do anything productive to improve the organiza-
tions. Just when executives thought they had control over information,
the Internet revolutionized information accessibility and is transforming the
very way in which business is performed. Now executives find themselves
“surfing” for hours through the World Wide Web, setting triggers and
agents to trap information swimming past their keyboards.
Business is not getting any more manageable. With corporate in-
tranets, extranets, and knowledge network technologies entering the
information management landscape in the Global 100, corporations will
never die from starvation when it comes to information.They might die
from indigestion.Too much and too fast, data with no analytical frame-
work and no action seem, in fact, to be leading to knowledge starvation and
data obesity.
Answering yes to more than two of the following questions signals that
your company is suffering from data obesity and knowledge starvation:
•
Do you go to a limited number of sources for information, or
do you have to send out a search party? If you cannot get in-
formation readily, this is data disintegration.
•
When you receive information, does it require that you
reprocess it before it is applicable? If it must be altered before it
is useful for performance measurements, it is context insensitive
information.
•
Is information lacking in timeliness and credibility? If so, it
does not have fitness of sources.
34
ESSENTIALS of Balanced Scorecard
4239_P-03.qxd 3/11/04 2:35 PM Page 34
•
Does the information you receive force new questions? This is
depth of information. Good business analytics really gets you to
ask the right questions rather than move toward answering the
wrong questions.
•
Does the information lack dimensional views and perspectives?
The information should allow the company to target products
and services to customer A and channel B, for example.This
quality is data dimensionality.
•
Do you find that your organization gives you information that
is at least one quarter too late? This shows a lack of timeliness.
•
Have you not sent out information to test its value, and found
that no one missed it? This shows a lack of data usefulness.
Obviously, then, information is not always viewed as an asset in organi-
zations. Recently, the push for more and more information is having
some negative effects:
•
The value of information diminishes with time. Old, untimely in-
formation can be extremely destructive to the natural flow of
business.Assumptions are made with data, and these assump-
tions could halt the successful momentum of a company’s ac-
tions on products and services.
•
Information may have negative value when it is not only untimely but
also wrong. “Misinformation subtracts value from the valuable.”
2
Wrong or outdated information may lead you to the wrong
conclusions.
•
The value of information is relationship dependent. That is, finite
data are useless without the correct context and the relation-
ship of the finite data to other finite data. For example, know-
ing about cost overruns in your factory is relevant, but it is
more relevant when you can understand where and what
caused them.
35
From Management to Performance Management
4239_P-03.qxd 3/11/04 2:35 PM Page 35
In a nutshell, information that is unused, updated, and unrelated is a de-
preciating asset and can turn into a liability very quickly.
New Frontier of Competitiveness
In the past, business enjoyed increasing market share and profits abound-
ed.With the global competitiveness splitting the market pies, these com-
panies are fast realizing that they must do more with what talent and
tools they have.
In the search for the ultimate “magic pill,” be it operational effi-
ciency, gaining loyal customers, building a new mouse trap, or establish-
ing a powerful value chain of vendors and suppliers, companies have
discovered that the true lasting competitive advantage is not just the
above-mentioned strategic themes but knowledge. Knowledge has long
since been the theme song of the management gurus of the past century.
But knowing without doing can be a waste of time and energy.
Beyond this discovery, the Global 100 is fast realizing that self-
knowledge and applied self-knowledge is true power—that is, knowing
yourself better than your competitor knows you, to act on your strengths
effectively in your market space. For example,Wal-Mart changed the way
manufacturers, brokers, retailers, and wholesalers performed work. It
changed the entire business model and activities in the food industry.
Knowing what it did well and knowing what its competitors did not
know about the consumer brought Wal-Mart to victory with a 3 percent
profit margin in the same businesses in which its competitors enjoy a less
than 1 percent margin.
Winning in the food industry, which is a $500 billion business,Wal-
Mart has triggered the industry into a cost-cutting efficiency adventure
that will remove $30 billion in cost of the next five years.Wal-Mart used
its self-knowledge and applied it for customer retention. More than in-
formation technology,Wal-Mart understands how to get the best from its
technology and its vendors and its customers better than some others do.
36
ESSENTIALS of Balanced Scorecard
4239_P-03.qxd 3/11/04 2:35 PM Page 36
We Need to Listen to “Moore”?
Gordon Moore, co-founder of Intel Corporation, introduced the notion
of complexity growth when he declared that the microprocessor would
double in complexity every two years.
3
The prediction has borne out to
be a fact. It is believed that in the years to come, more power will exist
in a single desktop computer than is the equivalent of all the computer
power combined in our world today. Similarly, it is believed conserva-
tively that the amount of private and corporate data stored on comput-
ers is doubling every twelve to eighteen months. Clearly, it is not a lack
of information that holds corporations back.
Neither is it information technology. Faye Borthick, professor of ac-
counting at Georgia State University, and Harold Roth, professor of
accounting at the University of Tennessee in Knoxville, declare that “For
the first time, information technology is sufficiently well developed that
accountants can have the information they want.”
4
With the introduction of data warehousing, data-marting, data-
mining, online analytical processing, three-tier client-server technolo-
gies, desktop navigation tools, search engines and hardware technologies,
information technology seems to have popped up like intelligent mush-
rooms waiting to consume data and expel it to anyone at anytime and
anywhere. These technologies, coupled with all the information over-
load, will only bring irrelevant data to us faster. Winning companies
don’t win by mastering quick access to information; they master the abil-
ity to, at a sustainable level, provide relevant information to the right
people at the right time for the right managerial decision.
Peter Drucker stated that what is important is not tools. It is the con-
cepts behind them that are important.
5
He declared that a conceptual
map is sadly lacking in today’s information to give it relevance to the de-
cision maker. In some ways, the technological treadmill is going faster
and faster, almost outstripping the needs of business and creating a life of
37
From Management to Performance Management
4239_P-03.qxd 3/11/04 2:35 PM Page 37
its own.
6
This new market demand for executives to be powered by in-
formation to win gives birth to the knowledge leader, one who drives
his business using analytical information as guide.The knowledge leader
must now understand the fundamental competitive capability using these
new-found tools is not how much information is gathered but how to
optimize the mean time between decisions (MTBD).The leader must
improve how fast the company can turn data into decisions to create a
new landscape for its competitors to chart or it will be lost in the maze
of information.
Information Is No Longer Power
Today, the knowledge leader cannot be measured by what information is
obtained and dispensed but by what information is rejected, which will
be significantly more.Without keen selection capability, the knowledge
leader will be crushed under the sheer weight and demand of decisions
to be made. Consequently, organizations that master the ability to un-
derstand themselves enough to make decisions, and command them-
selves enough to act decisively and consistently, will win. Information
seems powerless. Decisive action using relevant information is power.
Competitive advantage is best developed in the acquisition and deploy-
ment of relevant information to all who need and decide/act with it.
What used to be in the careful hands of business analysts will shift dra-
matically to all managers and decision makers.There is no longer time
for hierarchical decision-making protocols, only time for the hierarchy
to hold the old bones of the corporation in place while the nervous sys-
tem of the company fights the real wars of wealth acquisition. Relevant
data are the fuel for this activity.
What Brings Relevance to Information?
Peter F. Drucker, the father of modern management, in his seminal arti-
cle titled “The Information Executives Truly Need” contends that infor-
38
ESSENTIALS of Balanced Scorecard
4239_P-03.qxd 3/11/04 2:35 PM Page 38
mation should challenge basic assumptions and have links to strategy. He
declares that BSC is such information.
Drucker states that enterprises are paid to create wealth, not control
costs. But this premise is not reflected in traditional measurements. First-
year accounting students are taught that the “balance sheet portrays the
liquidation value of the enterprise and provides creditors with worst case
information. But enterprises are not normally run to be liquidated.”
7
Drucker seems to believe that information is used for wealth cre-
ation. He breaks up information value into four main value categories:
1. Foundation information. Diagnostic, cash flow
2. Productivity information. Resource productivity
3. Competence information. Measure of the unique ability that cus-
tomers pay for
4. Resource-allocation information. Managing scarce resources for the
current business
Note that he believes these categories to be information on the cur-
rent business condition and hence tactical in nature. BSC practitioners
will declare that the greatest impediment to projects is the lack of upper
management support. Upper management prefers strategy but must see
the relationship between strategy and a strategy framework for the entire
organization before supporting a BSC project.The questions surround-
ing the relationship of BSC to strategy will be discussed in Chapter 4.
Simply put, many organizations today are running forward while
looking backward.These companies are blind to the strategic relation-
ships among their true product value, their profitability, and their chan-
nel behavior. They lack the most basic of intelligence systems even to
answer the more basic questions like,“Are the cycle time for your prod-
ucts and your cost of product creation co-related?”That is, do they track
with one another? If so, what are the drivers of product demand and
profit?
39
From Management to Performance Management
4239_P-03.qxd 3/11/04 2:35 PM Page 39
John Whitney, professor of Management at Columbia University and
author of “Strategic Renewal for Business Units,”
8
hit the nail on the
head when he said, “Indeed, I have found that perhaps most businesses
do not know the true accrual profit of their products and services, and
fewer still know the profitability of customers.” BSC provides a relation-
ship between strategic themes and the work performed or the key ac-
tivities that organizations can affect.
In the commercial sector, information is used to uncover these issues
but in the public sector, profitability is of no relevance. Budgets take
precedence. Here the information circles around the question,“Do we
have the resources to achieve the mission?” or “What are the key strate-
gic goals with measures to achieve the mission?”
Relevance Is Subjective
Essentially, relevance is in the eyes of the beholder. Ultimately, decision
makers at the strategic, operational and financial corners of an organiza-
tion need information relevant to the decisions they must make. Morris
Treadway of PricewaterhouseCoopers LLP describes relevance as “data
suitable for a user’s need.”
9
This might sound anticlimactic, but let’s ex-
plore this point further. In a nutshell, we know that any relevant infor-
mation performance measurement must
•
Link to strategy
•
Be linked to activities and groups of activities
•
Measure the loss of not doing
•
Support the four main categories of Drucker’s value model
•
Feed and support an underlying concept
Performance Measurement: Down to Basics
In a study conducted by Will Schiemann & Associates, 97 percent of
what they called measurement-managed companies talked of success in their
40
ESSENTIALS of Balanced Scorecard
4239_P-03.qxd 3/11/04 2:35 PM Page 40
change efforts.
10
We had discussed that the true measure of strategy is
successful implementation of the goals and the achievements. But inter-
mediary operational measures are necessary as a check and balance prior
to the result, which might be more long term. In managing executive
teams, measuring by the year will cause slippage year-to-year; measure-
ment by the month will cause slippage month-to-month. In other
words, the frequency of review is as important as the measure.
Measurement has had a bad reputation among the ranks because it
only means that people get fired or demoted based on performance.
However, measurement can be very valuable function in organizations
whose people look for accountability. Many organizations lack the con-
viction to institute measurement for fear of a culture clash, that is, un-
happy employees. But in further assessment, these organizations have
found that a lack of measurement only allows the weak players to exist
which further demoralizes the strong players who eventually leave the
organization. Measurement without management is dangerous as it only
becomes a static event. Management can transform measurement into a
motivating force by using measurement as
•
A gauge of performance rather than a tool for punishment
•
A reward system
•
A scorecard for learning and growth
•
An anticipatory tool to analyze future events and prepare for them
•
A tool for communicating priorities and what is important to
the organization
Balanced Scorecard needs performance measurement. The result of a
BSC exercise is a set of objectives with owners, measures, targets, and ini-
tiatives.As stated before, the hierarchy of relationships looks like this:
1. Vision
2. Mission
41
From Management to Performance Management
4239_P-03.qxd 3/11/04 2:35 PM Page 41
3. Values
4. Strategy and strategic thrusts/themes
5. Strategy mapping with perspectives
6. Objectives
7. Measures, targets, owners and initiatives
Given this hierarchy for the process, our next phase of discussion is per-
formance measures within each perspective.
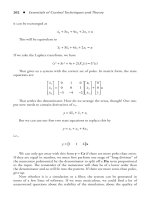
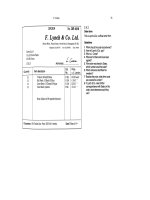
Exhibit 3.1 illustrates a perspective with an objective, measure, and
target. Note that a customer perspective has been used as an example. In
this exhibit, the following terms need to be addressed:
•
Objective
•
Measure
•
Target
42
ESSENTIALS of Balanced Scorecard
Sample Objective, Measures, and Targets
Strategic Theme 1
Children are healthy.
Objective 1
Pregnant women receive adequate care.
Performance Measures
•
Percent of low income women receiving prenatal care in the first
month of pregnancy
TARGET > x %
•
Percent of clients completing alcohol or drug treatment and are not
abusing
TARGET > y %
EXHIBIT 3.1
4239_P-03.qxd 3/11/04 2:35 PM Page 42
An objective is a goal to be achieved. In combination with other ob-
jectives, if achieved, it can achieve a strategic thrust.
A measure is a quantifiable formula whose variables define what needs
to be measured and monitored in order that a target is achieved. For ex-
ample, one measures the number of customers who were contacted or the
amount of dollars spent on training.The example of a measure could be
the number of customers with greater than 95 percent satisfaction.
A target is usually a numeric value to be achieved. It is a desired re-
sult of an objective executed. For example, an objective can have a tar-
get of 80 percent of customers with 95 percent satisfaction rating.
An initiative is a program, an activity, or a project that will meet an ob-
jective alone or in a combination with other initiatives. In the previous
example, the initiatives that are launched must be accomplished to ensure
that the objective is achieved. In this case, the initiatives look like this:
•
Establish a customer satisfaction survey capability by February
2004.
•
Deliver assessment at point-of-service.
•
Ensure department follows up to achieve 60 percent.
Types of Measures
Measures can be one of four types:
1. Output measures
2. Input measures
3. Outcome measures
4. Feedback measures
Output Measures
Output measures are numeric output of an activity. Consider an activity
titled “selling.” The number of sales calls is an example of the output
43
From Management to Performance Management
4239_P-03.qxd 3/11/04 2:35 PM Page 43
measure of the selling activity.Another example of an output measure is
the number of demonstrations with respect to sales. In engineering, the
number of bugs collected in a quality-testing evaluation could be an out-
put measure.
Input Measures
Time and percentage of time are examples of input measures. Budgets or
monies allocated to any activity are another example. Let’s use the same
example of “selling.” A sales team can now understand the percent of
time spent with selling customer A, customer B, and so on. In another
sense, this team can measure the cost of the total activity of selling and/or
the cost of selling customer A or B.
Outcome Measures
You might have met with the customer 100 times, but has the customer
purchased your product? Outcome measures ask if the desired result of an
activity has been achieved. Some nonprofit or government agencies have
output measures that lack outcome measures. For example, a relief
agency measured the number of times it assisted the needy in underde-
veloped countries, and the number was very impressive. Further investi-
gation revealed that many teams landed with little to no medical
supplies. Furthermore, whenever they had supplies, looters and thugs
stole these supplies. In this case, an output measure of the number of vis-
its, combined with an outcome measure of the number of people saved
with delivered medication, may work to understand the challenges.
Feedback Measures
A feedback measure is seldom discussed, but this measure has inherent
value to a long-drawn process or activity. If chosen carefully, feedback
measures help you gauge the quality of your output before an outcome
appears. For example, software engineering processes can be rather com-
44
ESSENTIALS of Balanced Scorecard
4239_P-03.qxd 3/11/04 2:35 PM Page 44
plicated exercises, especially when engineers are developing code rapid-
ly within teams. Testing these large amounts of software code is even
more challenging, given the short time horizons.When testing begins,
general experience indicates that the bugs cured or removed may seem
to generate stable software.
One example is when my engineering team developed a measure of
bugs called weighted-defect count.They measured the relative value of the bug
and the number of them as an equation.When the weighted defect count
went down, we may have been getting better but the outcome may not
have been stable code.This is because we had a few bugs that were show-
stoppers in the count that could stop the programs from performing at all.
Hence, the team used a feedback measure of “# of level 1 bugs”just to mea-
sure the progress of removing the high-priority fatal bugs out of the system.
Leading and Lagging Indicators
Leading indicators are really drivers of performance.They drive the be-
havior of an activity, program, or process. If you measure the number of
times we visit a client, that is an input measure and also one of many
leading indicators of success.As they say,“Showing up is half the battle.”
A leading indicator of the economic potential in the high-tech industry
is the book-to-bill ratio in the semiconductor industry. If the book-to-
bill ratio is increasing, the market is in an upturn.This further indicates
that if chip sales are up and growing, computer sales and retail sales will
follow and hence drive the entire industry to a possible upturn.Thus, this
ratio could be classified as a leading indicator. However, if you are in the
semiconductor industry, the book-to-bill ratio may be a lagging indica-
tor.You may have to find other leading indicators within your industry.
Are Measures Co-Related or Non–Co-Related?
Many BSCs fail because they use a large number of performance mea-
sures to describe or measure the same objective. Many measures are
45
From Management to Performance Management
4239_P-03.qxd 3/11/04 2:35 PM Page 45
46
ESSENTIALS of Balanced Scorecard
Criteria for Picking
Performance Measures
The most important decision a modeler or BSC champion can make
is in the choice of measures and items to measure. Hence, before
choosing, ask the questions:
•
Is the measure a leading or lagging indicator of performance?
•
What type of measure is it?
•
Why is this measure important? What does it tell me?
•
Is this a simple way to uncover performance of any activity?
•
What other measures that I am measuring give me the same
result in another form?
•
Can I get this measure regularly and automatically, or do I
have to find it manually?
•
What drives this measure?
•
Is this measure an equational measure—that is, does it need
to be formulated using a formula? Or is it just a single
number?
Furthermore, performance measures must fit the following simple
criteria for selection:
•
Easy to understand
•
Data source integrity—must come from a reliable and
repeatable source
•
Cause-and-effect driven
•
Frequency of change
•
Bounded variable—not too unstable behavior
•
Accurate
•
Representative of reality
•
Relevant to the objective and strategy
T
IPS
& T
ECHNIQUES
4239_P-03.qxd 3/11/04 2:35 PM Page 46
47
From Management to Performance Management
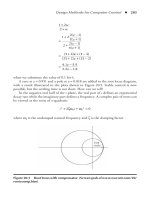
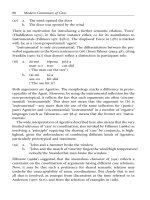
Each perspective will contain several strategic objectives within it.
Each objective may contain several measures, targets, and owners
within it. Each of these objectives may be cascaded throughout the
corporation and have scorecards associated with it also. Exhibit 3.2
illustrates such a construct. Note that this example covers a corpo-
rate objective to win in a particular business sector and has cas-
caded into marketing and sales. Marketing further cascades to
Marketing Communications objectives that still feed the overall
strategic theme. Not only is the strategic alignment evident, the per-
formance measures all line up to a corporate measure thus remov-
ing any random choices of measures throughout the corporation.
T
IPS
& T
ECHNIQUES CONTINUED
EXHIBIT 3.2
Strategic Theme
Achieve dominant
position in
semiconductors.
Objective
Drive sales to 2
times market by 2005.
Measure
Revenue
Target
$20 billion
Corporate
Strategic Theme
Achieve dominant
position in
semiconductors.
Objective
Capture majority
design wins.
Measure
Design win
opportu-
nities.
Target
4 out of 5
Sales
Strategic Theme
Achieve dominant
position in
semiconductors.
Objective
Generate significant
leads to match
revenue target.
Measure
Number
of leads
Target
10,000
warm/hot
leads
Marketing
Strategic Theme
Achieve dominant
position in
semiconductors.
Objective
Execute on
quarterly direct
mail campaign.
Measure
Number of
direct mailings
mailed per
quarter
Target
100,000
Marketing Communications
Cascading the Objectives, Measures, and Targets
Source: Adapted from Oregon Progress Board. Adapted with permission
4239_P-03.qxd 3/11/04 2:35 PM Page 47
inherently co-related—that is, they change in the same intervals. If one
is building a measurement, monitoring, and management model of your
strategy, co-relationship must be studied and understood.Why? In order
to answer this question, first ask if the accuracy of the measure or the
precision is more important. Many measures are accurate but not precise,
and that might be okay. In another case, the reverse is true. If the viewer
is less interested in the number than in whether the trends are up or
down, correlated numbers need not be displayed or measured. If the
numbers themselves are important and precision-oriented, then co-
relationship might not matter.
For example, a sales organization can measure the number of sales or-
ders as a lagging indicator of performance. But finance is measuring the
number of purchase orders as a leading indicator for the production de-
partment.These are co-related drivers that show very little significance.
Are Measures Co-Related or Causal?
Just because measures interact with each other does not assume causali-
ty. Seventy percent of performance measures can be found in an organi-
zation. In some cases, many parts of an organization measure the same
performance in different ways. Christopher D. Ittner and David Larcker,
professors at the Wharton School, ask that you survey your databases and
take inventory to clarify performance measures.
11
Furthermore, they rec-
ommend developing a causal model to isolate the performance drivers to
achieving the strategic plan.
Keeping Perspective
Measures in the Customer Perspective
If the mission, values, and vision are the heart of an organization, the cus-
tomers are the bloodstream that carries sustaining value to the organiza-
tion. How customers are acquired and maintained are the main activities
48
ESSENTIALS of Balanced Scorecard
4239_P-03.qxd 3/11/04 2:35 PM Page 48
of a company. But the customer perspective measures the underlying
goals/objectives that acquire, maintain, and grow customers. To under-
stand measures in this area, one must first understand the following:
•
Who is the ideal customer(s)?
•
Can these customers be segmented by industries, tastes, expec-
tations, age, agencies, function, business process, and so on?
•
Who influences their buying behavior?
•
Why do they buy—perceived and actual value/benefit of a
purchase?
•
When do they buy—budget cycles, timing of purchases?
•
What do they buy—product issues, service, company image
and positioning?
•
How do they buy—are they trained to buy? What is their
method of purchase?
The ultimate measurement of the success of a profit-centered organiza-
tion is, “Did you sell something?” If the market buys, mistakes are for-
given. If it doesn’t, they are not. Essentially, the binary nature of purchase
or a vote, or an endorsement of a bill, is the ultimate measure.
But what are possible measures of the customer perspective? Given
that we can set goals in this perspective that sets the tone for the key ac-
tions we take to ensure revenue, what would be the things we measure?
To find a customer, lead generation would be an acceptable measure,
namely, do we get 800 leads/quarter or don’t we? These leads would be a
lead indicator of revenue and a lag indicator of direct marketing cam-
paigns. Retaining and evaluating customer satisfaction may demand satis-
faction surveys. Research is indicating that just because your customers do
not switch, one cannot assume that they are content. It just may be that
they feel stuck with the solution that is offered. Hence, satisfaction reviews
may be one measure while customers attending user groups could be another.
The percentage return business is always a good measure of satisfaction.
49
From Management to Performance Management
4239_P-03.qxd 3/11/04 2:35 PM Page 49
Furthermore, buying customers may not indicate success when these cus-
tomers could be buying more from your competitors. Exclusive account
control could be another measure. Many measures are available.The art of
measurement in the customer perspective is to identify key objectives that
are derived from the main strategic thrusts as shown here:
A Strategic Thrust:
Win 50 percent market share in segment A by 2005
Customer Perspective Feeding This Could Be:
Be perceived as market leader in Technology B in segment A
by 2003
Performance Measures Could Be:
•
Percent market share in Technology B in segment B
•
Percent satisfaction derived from survey results for 80 percent
of installed base
Sample Customer Perspective Measures Are:
•
Brand equity measures
•
Market share
•
Share of mind
•
Total available market
•
Total accessible market
•
Customer retention
•
Customer satisfaction
•
Customer attrition
•
Average selling price
•
Lifetime value of customer
50
ESSENTIALS of Balanced Scorecard
4239_P-03.qxd 3/11/04 2:35 PM Page 50
•
Sales per employee
•
Customer profitability by channel by product
•
Design win (number of wins per year)
Measures in the Financial Perspective
Organizations are certainly not suffering from a lack of financial mea-
sures.Traditional measures still hold, but the relationship between goals,
initiatives, targets, and measures is the new learning with Balanced
Scorecard. Measures traditionally used in for-profit organizations to pre-
sent the financial perspective include the following:
•
Revenue
•
Profit margin
•
Gross margin
•
Cost
•
Cost of goods sold
•
Cost of services
•
Expense targets
•
Risk adjusted return on capital
•
Credit rating
•
Debt rating
•
Revenue per employee
•
Return on X (e.g., equity, investment, assets)
•
Cash flow
•
Debt to equity ratio
•
Earning before interest, taxes, depreciation, and amortization
(EBITDA)
•
Earnings
51
From Management to Performance Management
4239_P-03.qxd 3/11/04 2:35 PM Page 51
Nonprofit or government groups may use other measures:
•
Budget shortfalls
•
Expense targets
•
Allocation from donors
•
Allocation from legislatures
•
Cost to deliver service
•
Tax dollars/county
Measurement for the Internal Perspective
The internal perspective is associated with all the objectives and initia-
tives around the internal processes and capabilities of the organization.
Hence, every measure from engineering productivity to manufacturing
capability falls into this bucket. One should recognize that the common
measure still prevails:
•
Patents filed in engineering
•
Product lifecycle measures:
•
Mean time between failures of existing products
•
Spec to prototype cycle
•
Bug-count on release
•
Weighted defect count
•
Activity-based costs of major contributing activities and
outputs
•
Inventory turns
•
Number of new products in pipeline
•
R&D pipeline for new products
•
Number of returns
•
Percentage claims ratio (insurance company)
52
ESSENTIALS of Balanced Scorecard
4239_P-03.qxd 3/11/04 2:35 PM Page 52
Measures in the Learning
and Growth Perspective
One of the greatest side effects of the BSC framework is the emphasis
the Balanced Scorecard has placed on the fundamental participation of
learning and growth in the cause-and-effect relationships. We can see
that the learning and growth segment contributes to future capabilities
of the organization and is rarely acknowledged and is usually the first to
be cut in a tight market. Learning and growth measure examples are
•
Training by level
•
Retention numbers
•
Redeployment percent
•
Forced and unforced attrition
•
One-on-one interviews per employee
•
Employee and vendor satisfaction
•
Pay benchmarks
•
Rankings
•
Six-month performance after hire
•
Promotion from within
•
Personal development plan creation
Targets
A target is usually a numeric value representing a desired result of an ob-
jective, goal, activity or initiative. Being a desired result, a target must
have the following attributes:
•
Attainable but a stretch
•
Easily identifying and measurable
•
Could be a single number or a formula
53
From Management to Performance Management
4239_P-03.qxd 3/11/04 2:35 PM Page 53
•
Can be communicated to many leaders
•
Have value if attained to a x-functional management team
•
Linked to strategic variables
•
Static and unchanging during the measurement period
•
Benchmarkable with credible sources
Targets provide credibility to objectives and measures. One organization
set the growth target to be two times industry growth. Note that indus-
try growth is measurable and hence two times would fit the abovemen-
tioned criteria. Note also the target is static during the period and hence
can be measured year after year.
Initiatives
These are programs and campaigns or projects that are launched to meet
a target expectation. Objectives are sometimes high-level goals while ini-
tiatives ground these goals into necessary campaigns that need to be
done in order to achieve the goals.An ISO-9000 initiative might be nec-
essary to achieve manufacturing excellence for example. Initiatives dis-
play similar attributes to objectives such as these:
•
Are attainable and can be measured
•
Organization has the talent tools and time to perform them
•
Is manageable within time expected
•
Has an owner
•
Is repeatable
•
Is connected to the objective as a driver of the objective
54
ESSENTIALS of Balanced Scorecard
4239_P-03.qxd 3/11/04 2:35 PM Page 54