Study guide for come into my trading room phần 9 pps
Bạn đang xem bản rút gọn của tài liệu. Xem và tải ngay bản đầy đủ của tài liệu tại đây (196.7 KB, 21 trang )
Trade 7: International Business Machines IBM—Exit Question
160 CASE STUDIES
entry
long
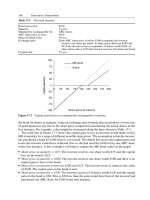
Chart Q7-c 22-day and 13-day EMAs, channel, 12-26-9 MACD-lines and
MACD-Histogram, 2-day Force Index
Cover this chart with a sheet of paper and move it one bar at a time,
from left to right. Identify entries, exits, and reentry points. Mark each
of them and write a brief comment. Do not go to the Answers pages
until you have finished this work.
We went long IBM near the fast EMA, in the area marked by an arrow
in October. Keep tracking IBM one day at a time and find where to take
profits and where to reestablish longs in this blue chip.
Answer on pages 190–191.
Trade 8: Biovail Corporation BVF—Entry Question
QUESTIONS 161
Mark at least two trading signals on the weekly as well as the daily charts and make a
trading decision at the right edge. Do not turn this page or look at the Answers pages
until you have documented your decision.
Answer on pages 192–193.
Chart Q8-a 26-week and 13-week EMAs, 12-26-9 MACD-lines and MACD-
Histogram
Chart Q8-b 22-day and 13-day EMAs, 12-26-9 MACD-lines and MACD-
Histogram, 2-day Force Index
Trade 8: Biovail Corporation BVF—Exit Question
162 CASE STUDIES
entry
long
Chart Q8-c 22-day and 13-day EMAs, channel, 12-26-9 MACD-lines and
MACD-Histogram, 2-day Force Index
Follow the usual pattern of covering this chart with a sheet of paper and
moving it, one bar at a time, from left to right. After each new bar
opens up, try to identify entries, exits, and reentry points. Mark each of
them, write a brief comment, and when you finish working through the
entire chart go to the Answers pages.
We went long BVF when it was straddling its EMAs, in the area
marked by an arrow in September. Keep tracking BVF one day at a time
and find where to take profits or reestablish longs.
Answer on pages 194–195.
SECTION
FOUR
LET’S TRADE:
ANSWERS
AND RATINGS
164 CASE STUDIES
Trade 1: Oracle Corp ORCL—Entry Answer
A Fallen Angel Ready to Fly
A
C
B
Chart A1-a
When the bull market in technology stocks ended in 2000, it gave way
to a vicious bear market. Many weak companies were delisted and went
bankrupt, but the decline also swept down shares of many well-run com-
panies. Oracle is one of America’s great technological corporations, not
some silly dot-com. Still, its shares were taken down from a high of 46
in 2000 to a low of 10 in 2001, a nearly 80% decline.
In early October 2001, weekly MACD-Histogram ticked up from a
higher bottom, completing a bullish divergence against a much lower
bottom in May, while prices traced a lower bottom. The fast 13-week
EMA turned flat. Even though the longer-term 26-week EMA continued
to decline, a bullish divergence of MACD-Histogram allowed us to
override the signal of the EMA.
The daily chart sports two bullish divergences. MACD-Histogram
keeps tracing more and more shallow bottoms, which show that bears
are becoming weaker even as prices grind lower. The more shallow bot-
toms of Force Index confirm that bears are running out of steam.
The blank area in September marks the week when the market was
closed, following the September 11th disaster. After the market reopened,
ANSWERS 165
many stocks went into a tailspin, but ORCL just flirted with the new lows
for a few days before rallying. During that rally, Force Index rose to its
highest peak since June, confirming that this stock was completely sold
out, bears had no more power, and the next move was likely to be up.
Entry Ratings
W
EEKLY CHART
A—Bullish divergence of MACD-Histogram: 1 point
B—Bullish divergence of MACD-lines: 1 point
C—Price below the EMA, in the undervalued zone: 1 point
D
AILY CHART
A—Bullish divergence of MACD-Histogram: 1 point
B—Bullish divergence of Force Index: 1 point
C—Rising 13-day EMA, price in the value zone between fast and
slow EMAs: 1 point
D
ECISION
Go long ORCL, with a stop below the month’s low, and observe
money management rules: 3 points.
P
ASS POINT 6
C
B
A
Chart A1-b
166 CASE STUDIES
Trade 1: Oracle Corp ORCL—Exit Answer
ORCL wasted little time before rallying above its moving averages. The
failure of the rally to reach the upper channel line lets you know that
the upmove is not likely to be very strong. The channel has been drawn
to contain the data during the decline in September. Back then, declines
used to punch the lower channel line. Now, the failure of prices to
reach the upper channel line shows that the rally is weak and profits
should be taken quickly instead of waiting for more, which you would
do in a powerful rally.
At point A, Force Index has completed a triple bearish divergence—
three lower tops during three uplegs of a rally. Prices still cannot reach
the upper channel line, making this a good spot to take profits and
employ your cash and attention elsewhere. The divergence deepens
at point B and gives a final ring at point C, after Force Index rises
above its centerline following the first nasty spill since the beginning of
the rally.
Overstaying a long trade in area C would have meant sitting through
an unpleasant decline below the EMA. That decline D actually creates
AB
C
DE
F
entry
long
Chart A1-c
another buying opportunity, followed by a bearish divergence of
MACD-Histogram in area E—a lower indicator peak during a higher
price peak.
A trader who oversleeps exit E gets one last chance in area F, where
the EMAs scream to sell when they turn down. Holding longs beyond
that point is strictly for losers.
Exit Ratings
D
AILY CHART A-1C
Sell longs in area A: 3 points
Sell longs in area B: 2 points
Sell longs in area C: 2 points
Reposition long in area D: 2 points
Sell longs in area E: 3 points
Sell longs in area F: 1 point
P
ASS POINT 7
Why do some casinos give players bonuses for spending more time
at the tables? They know that the longer you stay, the more likely you
are to leave your money in the casino. The best trades are fairly short.
You identify an island of order in the ocean of disorder, put on a trade
to capitalize on it, quickly pocket your winnings, and go looking for
another trade. There is no ideal exit, but generally, a fast exit is better
than a slow one.
ANSWERS 167
168 CASE STUDIES
Trade 2: Sun Microsystems SUNW—Entry Answer
Sold Down to Rock Bottom
A
B
C
Chart A2-a
This is another “fallen angel”—a high flier blown out of the sky by the
bear market in high-tech stocks. Many poor souls were desperate enough
to buy SUNW at 65, but few buyers came when SUNW hit its 7.50 low.
The average height of a bar reflects the level of trading activity. The bars
were much taller above 60 than below 10, reflecting greater public
interest in this stock near the top than near the bottom.
At the right edge of the weekly chart, MACD-Histogram has com-
pleted a bullish divergence A by ticking up from a much more shallow
bottom in 2001 than it reached in 2000, even though prices are much
lower. Moreover, there is a rarely seen bullish divergence B of MACD-
lines between the April and September bottoms. In area C, prices are
undervalued, below the EMA, and the latest bar of MACD-Histogram,
while pointing down, is shorter than the previous bar. This uptick com-
pletes a bullish divergence, telling us to look for an entry into a long
trade on the daily charts.
The daily chart shows a bullish divergence A between Force Index
and price, reflecting the weakness of bears during the late September
ANSWERS 169
low. In area B, both MACD-Histogram and MACD-lines are rising, con-
firming the strength of the bulls. At the right edge of the chart, in area
C, the fast EMA is already rising, a bullish sign. The slow EMA is still flat,
with prices in the value area between the two EMAs.
Entry Ratings
W
EEKLY CHART
A—Bullish divergence of MACD-Histogram: 1 point
B—Bullish divergence of MACD-lines: 1 point
C—Price below the EMA, in the undervalued zone: 1 point
D
AILY CHART
A—Bullish divergence of Force Index: 1 point
B—Rising MACD-Histogram and MACD-lines: 1 point
C—Rising 13-day EMA, price in the value zone between fast and
slow EMAs: 1 point
D
ECISION
Go long SUNW, with a stop below the month’s low, and observe
money management rules: 3 points.
P
ASS POINT 6
A
B
C
Chart A2-b
Trade 2: Sun Microsystems SUNW—Exit Answer
170 CASE STUDIES
As a rule, it pays to bracket the long moving average with an envelope
or a channel and use its walls as guidelines for taking profits. One of the
few proven behaviors of the market is its tendency to oscillate above
and below value. If we buy near the moving average, near value, then
our goal is to sell when the stock or commodity becomes overvalued,
near the upper channel line.
The first selling opportunity in SUNW comes in area A, after the stock
spends more than a week going nowhere, straddling its moving average.
Do we want to give the trade more time to work out, or close it and look
for another? If you trade a small account, it is important to free up your
capital. Even in a larger account, a stock that is going nowhere ties up
more than capital. It competes for the trader’s attention, taking his mind
off other, more promising, trades, almost like a sick child tends to get
the lion’s share of attention in the family.
If we continue to hold, SUNW presents a fantastic selling opportu-
nity in area B. Prices speed up to the upside, puncture the upper chan-
nel line with an unusually tall bar, only to weaken near the close and
end the day within the channel. Our goal is to sell above value, and this
A
BCD
entry
long
Chart A2-c
stab above the upper channel line shows that the market is overvalued
but cannot hold that level. MACD-Histogram ticks down the next day,
confirming that bulls are running out of breath.
A quick stab into the area between the two EMAs around Thanks-
giving, in area C, creates a buying opportunity since the weekly chart
still is in an uptrend. In area D, SUNW rises to a double top, while
MACD-Histogram traces a bearish divergence and gives a strong sell
signal. Prices fail to reach their upper channel line, while MACD-
Histogram diverges and even MACD-lines start to diverge. There is no
point in sticking around any longer; it is high time to take your winnings
off the table and switch your attention to another stock.
Exit Ratings
D
AILY CHART A-2C
Sell longs in area A: 3 points
Sell longs in area B: 5 points
Reposition long in area C: 3 points
Sell longs in area D: 3 points
P
ASS POINT 8
ANSWERS 171
Trade 3: Kroll Inc KROL—Entry Answer
KROL—On the Front Burner
172 CASE STUDIES
This trade illustrates the importance of fundamental analysis and the
value of personal networking. Shortly after the September 11 disaster, a
group of campers gathered for our regular monthly meeting in my
Manhattan apartment. We agreed that the investment/trading theme
for the next several months was likely to be security and I asked one of
our campers to come up with a complete list of all security-related
firms. I reviewed each of them, using the Triple Screen system. KROL
appeared to be the most attractive stock on the list, and I e-mailed my
analysis to everyone who was at our meeting.
Kroll, Inc. is an international corporate security firm. Its stock traded
above 41 in 1999 before sliding below 5 in 2000 when it made a few
unwise acquisitions. In 2001 it appeared completely sold out and list-
less, with narrow weekly ranges. MACD-Histogram and MACD-lines
have traced bullish divergences A and B, while prices have traced a
rounded bottom, known as a “saucer bottom” C, with a breakout at D.
The daily chart shows an upside gap immediately after the resumption
of trading in September, followed by a brief pullback. The huge peak of
Force Index, which makes its entire previous history appear as a flat line,
shows a tremendous bullish force and calls for higher prices ahead. Both
B
A
C
D
Chart A3-a
moving averages are rising at the right edge—bullish. MACD-Histogram
and MACD-lines are also rising, confirming the bullish power.
Entry Ratings
W
EEKLY CHART
A—Bullish divergence of MACD-Histogram: 1 point
B—Bullish divergence of MACD-lines: 1 point
C—Price below the EMA, in the undervalued zone: 1 point
D—Breakout: 1 point
D
AILY CHART
A—Bullish upswing of Force Index: 1 point
B—Rising MACD-Histogram and MACD-lines: 1 point
C—Rising 13-day and 22-day EMAs: 1 point
D
ECISION
Go long KROL, with a stop at the upper edge of the gap and observe
money management rules: 3 points.
Alternatively, wait to buy when a daily low touches the fast EMA, and
adjust buy orders daily: 3 points.
The reason we may consider buying KROL this high is that the market
underwent a sudden and massive fundamental change.
P
ASS POINT 7
ANSWERS 173
B
C
A
Chart A3-b
Trade 3: Kroll Inc KROL—Exit Answer
174 CASE STUDIES
The first selling opportunity in KROL comes in the area A, where the
stock penetrates its channel, while Force Index traces a bearish diver-
gence. There is a great reentry opportunity in area B, when KROL
returns to its fast EMA. We need to calculate this EMA daily, estimate its
value for tomorrow, and put our buy order in that area.
The rally in area C offers us a choice—take profits above the enve-
lope or continue to hold because peak C of Force Index is even higher
than peak A. When bulls grow stronger as prices rise, they tell us that
higher prices are likely ahead.
The pullback to the EMA in area D presents another good opportu-
nity to reestablish long positions or to add to existing ones. The rally in
area E creates the best exit opportunity for longs—bearish divergence
C-E of Force Index shows that bulls are running out of steam, while the
failure of prices to reach their upper channel line confirms this message.
MACD-Histogram also traces a bearish divergence, in tandem with
Force Index. It is the end of the game for the bulls, the bells are ringing,
warning you that the uptrend is ready to reverse.
entry
long
ABC DE F G
Chart A3-c
The sharp drop in area F must hit any sensible stop-loss or protect-
profit order. Both EMAs turn down in area G, screaming to sell. But this
exit is strictly for the beginners who goofed and missed much more
profitable earlier exits.
Exit Ratings
D
AILY CHART A-3C
Sell longs in area A: 3 points
Hold longs in area A: 3 points
Add to longs in area B: 3 points
Sell longs in area C: 3 points
Hold longs in area C: 3 points
Add to longs in area D: 3 points
Sell longs in area E: 5 points
Sell longs in area F: 1 point
Sell longs in area G: 1 point
P
ASS POINT 13
ANSWERS 175
Trade 4: Imclone Systems IMCL—Entry Answer
IMCL: A Steady Trend Against a Pervasive Enemy
176 CASE STUDIES
A key principle of the Triple Screen trading system is to make strategic
decisions on long-term charts, and then turn to short-term charts for tac-
tical decisions about entries and exits. The weekly chart of IMCL shows
a series of slow and steady swings, each lasting several months. If we
can get in gear with an upswing, we should trade from the long side as
long as it continues. If we get in gear with a downswing, we can con-
tinue shorting for as long as that downmove stays in force.
At the right edge of the weekly chart, in area A, both weekly EMAs
have turned up, giving buy signals. At the same time, MACD-Histogram
has ticked up, reinforcing the bullish message (this is an Impulse System
buy—both the EMA and MACD-Histogram point higher).
IMCL has been stuck in a flat trading range for the past two months.
The bottoms of MACD-Histogram have become shallow, showing that
bears are becoming weaker. Bulls, at the same time, have maintained
their strength—the rallies of MACD-Histogram above its centerline have
been rising to the same level during those two months. As prices push
higher, toward overhead resistance near the right edge, Force Index
A
Chart A4-a
rises to a new multimonth high, confirming bullish strength. At the same
time, prices punch up through the resistance, closing above that level.
This breakout turns resistance into support, which is likely to create a
bottom under any decline.
Entry Ratings
W
EEKLY CHART
A—An uptick of MACD-Histogram: 1 point
A—An uptick of both moving averages: 1 point
D
AILY CHART
A—Bullish upswing of MACD-Histogram: 1 point
B—New high of Force Index: 1 point
C—Upside breakout through overhead resistance: 1 point
D
ECISION
Go long IMCL, with a stop below the previous day’s low, and observe
money management rules: 3 points.
Alternatively, wait to buy when the low of a daily bar touches the fast
EMA; keep adjusting buy orders daily: 3 points.
P
ASS POINT 6
ANSWERS 177
A
B
C
Chart A4-b
Trade 4: Imclone Systems IMCL—Exit Answer
178 CASE STUDIES
IMCL offers a profit-taking opportunity at point A, just two days after the
entry. Prices blow outside of their channel, marking an overbought con-
dition, a selling opportunity. A decline that follows takes IMCL down
into the “sweet zone”—the value area between the fast and the slow
EMAs.
There is a window in September—a blank spot following the sus-
pension of trading after the terrorist acts of September 11. Most stocks
sank after the markets reopened, but not IMCL. Two days later Force
Index rallies to a fantastic peak, indicating a great buildup of buying
pressure. When a stock bucks the trend of the market, it sends a strong
message that it really wants to go its way, no matter what.
There is a decision to be made in area C—to take profits above the
envelope or to continue to hold. The great height of peak C of Force
Index indicates that higher prices are likely ahead because bulls grow
stronger as prices rise.
If you sell, IMCL provides a new buying opportunity in area D, where
it declines below its fast EMA, and an even better opportunity in area E.
The volatility decreases, and prices stay for a few days in that value
zone between the two EMAs, before embarking on a new rally.
entry
long
AB C D EF GHI
Chart A4-c
That rally, and the following one, starting from the bottom F, are
decidedly anemic affairs. IMCL is still trending higher, but losing its old
vigor. When the rally H approaches the upper channel line, it offers
a chance to take profits. There is one final good exit, in area I, where a
bearish divergence of Force Index is shouting to sell.
Exit Ratings
D
AILY CHART A-4C
Sell longs in area A: 3 points
Hold longs in area A: 3 points
Add to longs in area B: 3 points
Sell longs in area C: 3 points
Add to longs in area D: 3 points
Add to longs in area E: 3 points
Add to longs in area F: 1 point
Add to longs in area G: 1 point
Sell longs in area H: 3 points
Sell longs in area I: 3 points
P
ASS POINT 14
ANSWERS 179
Trade 5: Wheat—Entry Answer
Wheat—Everybody Eats It
180 CASE STUDIES
Commodities are the essential building blocks of the economy. Nobody
really needs a share of amazon.com—it may be a nice speculation, but
if AMZN disappears, somebody else will sell books and we’ll find some-
thing else to trade. On the other hand, we could not live our normal
lives without wheat, cotton, sugar, or other commodities.
Since commodity contracts expire every few months, we need to use
perpetual or continuous contracts to analyze long-term weekly charts.
Those are mathematical constructs that combine the nearby actual
contracts in a seamless transition. We use real contracts to study the
daily charts.
At the right edge of the weekly chart, wheat appears to be at the tail
end of a multiyear bear market—it is the cheapest it has been in more
than a decade. Both EMAs are declining, but MACD-Histogram is flash-
ing the only signal that can override the message of the EMAs—a bull-
ish divergence between the indicator and price. There is also a bullish
divergence by MACD-lines, rarely seen on the weekly charts.
At the right edge of the daily chart, wheat has just penetrated a his-
toric low, set a week ago, earlier in September. Wheat failed to follow
A
B
C
Chart A5-a