Building XML Web Services for the Microsoft .NET Platform phần 9 ppsx
Bạn đang xem bản rút gọn của tài liệu. Xem và tải ngay bản đầy đủ của tài liệu tại đây (192.58 KB, 38 trang )
306
{
// Implementation
}
catch(SystemException se)
{
// Causes the stack to unwind to this method call
throw se;
}
catch(ApplicationException ae)
{
// The recipient of the exception will have a full stack trace.
throw;
}
Your application might use code to which you do not have the source that improperly throws
an exception. To facilitate obtaining a full stack trace, you can configure Visual Studio .NET
to catch first-chance exceptions. Choose Debug, Exceptions to open the Exceptions dialog
box. Click Common Language Runtime Exceptions, and then select the Break Into The
Debugger option in the When The Exception Is Thrown section, as shown here:
Information the Debugger Needs
The debugger needs certain information in order to perform tasks such as setting
breakpoints and displaying the call stack. This information comes from three primary
sources: the metadata contained within the assembly, the program database, and the JIT
compiler tracking information.
In this section, I explain what types of information the debugger needs and how it uses the
information. I also explain how to ensure that the information is available for debugging a
Web service. Finally I offer recommendations for creating release and debug builds for Web
service projects. The goal for release builds is to create the information that the debugger
needs in order to effectively diagnose problems that might emerge in the production
environment.
307
Assembly Metadata
From the .NET assembly’s metadata, the debugger needs information about the types
defined within the assembly. The debugger uses this information to display the friendly name
of types, the methods they expose, and the names of instances of types and to populate the
call stack, local watch windows, and so on. This metadata is always cont ained within a .NET
assembly, so the debugger will always have enough information to display a call stack
composed of friendly names.
Program Database
Some debugging features require more information than what is provided by the metadata
contained within an assembly. For example, the assembly’s metadata does not contain
enough information to allow you to interactively step through the source code that
implements the Web service.
To facilitate source code–level debugging, the debugger needs information about how to
map the program image to its original source code. The program database, which can be
optionally generated by the compiler, contains a mapping between the Microsoft
intermediate language (MSIL) instructions within the assembly and the lines in the source
code to which they relate.
The program database is in a separate file with a .pdb file extension and typically has the
same name as the executable (.dll or .exe) with which it is associated. The .pdb file often
resides in the same directory as its associated .dll or .exe.
The executable and the associated .pdb file generated by the compiler are considered a
matched pair. The debugger will not let you use a .pdb file that is either newer or older than
the executable running in the targeted process. When the compiler generates the executable
and its associated .pdb file, it stamps both of them with a GUID, which the debugger uses to
make sure that the correct .pdb file is loaded.
There is no equivalent mechanism for associating the .pdb file with the version of the source
code from which it was created, so it is possible to interactively debug your application using
an incorrect version of the source code. To avoid this situation, you should maintain tight
version control over the executable, the .pdb file, and source control. At the very least, you
should check all three into your source control database before deploying the database on
an external machine.
The Visual C# compiler (csc.exe) generates a .pdb file if you specify the /debug switch.
Table 11-1 describes all the variations of the Visual C# compiler /debug switch.
Table 11-1: Visual C# Compiler Debugging Switches
Switch Description
/debug, /debug+, or /debug:full Specifies that the compiler will generate a .pdb file.
/debug- Specifies that the compiler will not generate a .pdb
file. This is the default setting.
/debug:pdbonly Specifies that the compiler will generate a .pdb file.
However, source-level debugging will be disabled by
default.
308
The first two items in the table are pretty straightforward. The third item requires further
explanation. In the next section, I discuss why the .pdb file generated by the /debug:pdbonly
switch cannot be used for source-level debugging by default.
You can also use the /optimize switch to specify whether your code will be optimized before
being executed. By default, optimization is disabled—the same as specifying the /optimize-
switch. However, this results in significant performance penalties.
You can enable optimization by specifying the /optimize+ switch. Doing so reduces the
fidelity of source-code debugging, however. For example, code might appear to execute out
of order or not at all. As a result, optimization is often disabled during development and then
enabled before the application ships.
You can specify whether optimization is enabled or whether a .pdb file will be created for a
Visual Studio .NET project by modifying the Generate Debugging Information and Optimize
Code project settings in the Project Settings dialog box. To open this dialog box, select a
project in the Solution Explorer and then choose Project, Properties, or right-click on the
project and choose Properties.
Visual Studio .NET will automatically create two configurations for your project, Debug and
Release. For the Debug configuration, Generate Debugging Information is set to true and
Optimize Code is set to false. For the Release configuration, Generate Debugging
Information is set to false and Optimize Code is set to true.
You will find that .pdb files can be invaluable for diagnosing problems, especially those that
appear only in production. I strongly encourage you to generate .pdb files for every assembly
you release to production. However, before I make recommendations about specific build
settings, I need to paint a more complete picture.
Tracking Information
So far, I have told you only half the story. In the previous section, I discussed the behavior of
the Visual C# complier as it relates to debugging. However, the Visual C# compiler does not
generate the code that is ultimately executed and therefore debugged. It generates MSIL,
and the resulting MSIL is compiled by the JIT compiler to native code before being executed
by the processor.
When you debug a Web service, you attach your debugger to the process that is executing
the output of the JIT compiler. The JIT compiler thus has just as much influence as the
Visual C# compiler does over your ability to interactively debug the code for a Web service.
Recall that the program database generated by the Visual C# compiler maps the generated
MSIL to the original source code. But because the MSIL is compiled by the JIT compiler
before it is executed, the program database does not contain enough information to facilitate
interactive debugging.
To facilitate interactive debugging, the debugger must be able to map the native code
executing within the process to the MSIL and then to the source code. Half of the mapping,
from the MSIL to the source code, is provided by the .pdb file. The other half, from the native
machine code instructions to the MSIL, must be created by the JIT compiler at run time.
The mapping created by the JIT compiler is referred to as tracking information. Tracking
information is generated whenever MSIL is compiled to native code by the JIT compiler. The
debugger uses the combination of the information in the .pdb file and the tracking
informat ion generated by the JIT compiler to facilitate interactive source-code debugging.
309
With tracking disabled, you cannot perform source-level debugging on the targeted
executable. When source code is compiled using the /debug switch, the resulting assembly
will be marked to enable tracking. The JIT compiler learns of this because the assembly is
decorated with the Debuggable attribute, whose IsJITTrackingEnabled property is set to
true. When the JIT compiler loads the assembly, it looks for this attribute; the value of true
for its IsJITTrackingEnabled property overrides the default behavior.
So why should you care whether tracking is enabled? Because when tracking is enabled, it
imposes a slight performance penalty when your application is executed. Specifically,
application warm-up is slightly slower because the JIT compiler has to generate the tracking
information in addition to compiling the MSIL the first time a method is called.
Once a method has been JIT compiled, no additional costs are associated with tracking.
Therefore, in most cases the benefits of improved debugging support for the Web service
will outweigh the costs associated with tracking, especially for Web services. An instance of
a Web service usually supports multiple requests from multiple clients, so the costs
associated with generating the tracking information are quickly amortized away.
In some situations, however, you might not want to incur the costs associated with tracking
unless the application is experiencing a problem. You can compile your application using the
/debug:pdbonly switch so that the resulting assembly will have an associated .pdb file
generated for it but will not have the Debuggable attribute’s IsJITTrackingEnabled property
set to true.
Note that you cannot configure the Visual Studio .NET build properties to invoke the same
behavior that the /debug:pdbonly switch does. If you want to generate a .pdb file and not set
the IsJITTrackingEnabled property within the assembly, you must use some other means of
building the application.
If you suspect a problem with an application that was compiled using the /debug:pdbonly
switch, you must enable tracking at run time. The two primary ways to enable tracking at run
time are by using the debugger and by configuring an .ini file. Note that with the current
version of .NET, modifications to the IsJITTrackingEnabled property take effect only when
the application is reloaded by the common language runtime. Both methods of configuring
tracking at run time require you to restart your application.
The first method of enabling tracking at run time is by creating an .ini file that is used to set
the JIT compiler debugging options. The .ini file should have the same name as the
application and should reside in the same directory. For example, the .ini file for
MyRemotingWebService.exe would be named MyRemotingWebService.ini. The contents of
the .ini file would look something like this:
[.NET Framework Debugging Control]
GenerateTrackingInfo=1
AllowOptimize=0
This example configures the JIT compiler to generate tracking information for the application.
As you can see, you can use the .ini file to control whether the JIT compiler generates
optimized code. This example does not allow the JIT compiler to generate optimized native
code.
The second method of enabling tracking at run time is by using a debugger. If the executable
is launched within a debugger such as Visual Studio .NET, the debugger will ensure that
tracking is enabled and optimization is disabled.
310
You can launch an executable in Visual Studio .NET by opening an existing project of type
Executable Files (*.exe). Select the executable you want to launch within the debugger.
When you start debugging, you will be required to save the newly created Visual Studio
.NET solutions file. Then Visual Studio .NET will launch the application with tracking
enabled.
The two methods of enabling tracking at run time are effective for .NET .exe applications
such as those that host Remoting Web services and clients that interact with Web services.
However, they do not work for applications hosted by ASP.NET, primarily because ASP.NET
applications are hosted within a worker process (aspnet_wp.exe). This worker process is
unmanaged and hosts the common language runtime.
The common language runtime host processes, such as ASP.NET, can programmatically
set the debugging options for the JIT compiler. But the current version of ASP.NET does not
provide a means of setting the debugging options at run time, so if you want to interactively
debug your ASP.NET-hosted Web service, you must build the component using the /debug
option.
The good news is that the performance costs associated with generating the tracking
information are much less relevant with respect to ASP.NET-hosted Web services. Methods
exposed by the Web service tend to be JIT compiled once and then executed many times.
The amortized cost of generating the tracking information becomes insignificant.
I encourage you to compile the release version of your Web services using the /debug
switch. You will not incur a performance penalty once your code has been JIT compiled.
And, in most cases, the ability to perform interactive source-level debugging will far outweigh
the slight performance penalty that tracking incurs during warm-up.
If the overhead related to tracking is a concern for your ASP.NET-hosted Web services,
consider building two release versions of your DLL, one using /debug:pdbonly and one using
/debug. The reason to build a .pdb file for both DLLs is in case future versions of the
ASP.NET runtime allow you to enable tracking at run time.
In general, you should compile the release version of your application using the /optimize+
switch. The optimizations performed by the JIT compiler will reduce the fidelity of interactive
source-level debugging. However, the performance costs associated with disabling
optimization are significant and span the entire lifetime of your application.
Debugging Dynamically Compiled Source Code
Recall that the implementation of a Web service can also be contained in the .as mx file itself.
In this case, the ASP.NET runtime generates the MSIL; you must tell the ASP.NET runtime
to generate the information needed to facilitate interactive source-code debugging.
You can enable support for debugging for a particular .asmx page, an entire directory, or an
entire application. Doing so will cause a program database and tracking information to be
generated at run time. In addition, optimization will be disabled.
You can enable debugging at the page level by setting the Debug attribute in the @
WebService directive. Here is an example:
<@ WebService Debug="true" Language="C#" Class="MyWebService" >
using System;
using System.Web.Service;
311
public class MyWebService
{
[WebMethod]
public string Hello()
{
return "Hello world.";
}
}
You can also enable debugging using the web.config file. Depending on where it is located,
you can use the web.config file to configure files either within a specific directory or within
the entire application, as shown here:
<configuration>
<system.web>
<compilation debug="true"/>
</system.web>
</configuration>
Enabling debugging also disables optimization, so the Web service will incur a performance
penalty. You should therefore disable debugging in production whenever possible.
Instrumenting Web Services
Although source-level debugging is very powerful for debugging applications, in plenty of
situations it is not practical. For example, if you interactively debug an ASP.NET Web
service, you effectively block all threads from servi cing other requests. This is not very
practical if the Web service is being hosted in a production environment and you have no
ability to isolate it.
In such situations, instrumentation can be invaluable. Instrumentation is the process of
generating output directed at the developer or administrator that provides information about
the running state of your Web service.
The .NET Framework offers developers many options for instrumenting Web services and
the applications that consume them. In this section, I cover three techniques that you can
use to instrument your Web service: tracing, the Event Log, and performance counters.
Tracing
Tracing is the process of recording key events during the execution of an application over a
discrete period of time. This information can help you understand the code path taken within
the application. Tracing information can also contain information about the changes made to
the state of the application.
Different levels of tracing are often needed during different phases of a product’s lifecycle.
For example, during development, the information might be quite verbose. But when the
application ships, only a subset of that information might be useful.
The System.Diagnostics namespace contains the Debug and Trace classes, which provide a
straightforward means of outputting tracing information from your application. These two
312
classes exhibit similar behavior. In fact, internally they both forward their calls to
corresponding static methods exposed by the private TraceInternal class. The primary
difference between them is that the Debug class is intended for use during development and
the Trace class is intended for use throughout the lifecycle of the application.
Table 11-2 describes the properties and methods exposed by the Debug and Trace classes.
I discuss most of the properties and methods in greater detail later in this section.
Table 11-2: Properties and Methods of the Debug and Trace Classes
Property Description
AutoFlush Specifies whether the Flush method should be called after every write
IndentLevel Specifies the level of indentation for writes
IndentSize Specifies the number of spaces of a single indent
Listeners Specifies the collection of listeners that monitor the debug output
Method Description
Assert Evaluates an expression and then displays the call stack and an optional
user-defined message in a message box if the expression is false
Close Flushes the output buffer and then closes the listener
Fail Displays the call stack and a user-defined message in a message box
Flush Flushes the output buffer to the collection of listeners
Indent Increases the value of the IndentLevel property by one
Unindent Decreases the value of the IndentLevel property by one
Write Writes information to the collection of listeners
WriteLine Writes information and a linefeed to the collection of listeners
WriteLineIf Writes information and a linefeed to the collection of listeners if an
expression evaluates to true
Each of the static methods exposed by the Debug and Trace classes is decorated with the
Conditional attribute. This attribute controls whether a call made to a particular method is
executed based on the presence of a particular preprocessing symbol.
The methods exposed by the Debug class are executed only if the DEBUG symbol is
defined. The methods exposed by the Trace class are executed only if the TRACE symbol is
defined.
You define symbols at compile time; you can define them within the source code or using a
compiler switch. The compiler will generate MSIL to call a method decorated with the
Conditional attribute only if the required symbol is defined. For example, a call to
Debug.WriteLine will not be compiled into MSIL unless the DEBUG symbol is defined.
With Visual C#, you can use the #define directive to define a symbol scoped to a particular
file. For example, the following code defines both the DEBUG and TRACE symbols:
#define DEBUG
#define TRACE
313
You can also define a symbol using the Visual C# compiler /define switch. Symbols defined
in this manner are scoped to all the source code files compiled into the executable. The
following command defines the DEBUG and TRACE symbols at compile time:
csc /define:DEBUG;TRACE /target:library MyWebServiceImpl.cs
In general, the DEBUG and TRACE symbols are defined when you compile debug builds,
and only the TRACE symbol is defined when you compile release builds. This is the default
in Visual Studio .NET. You can change which symbols are defined at compile time by
configuring the project settings under Configuration Properties, Build, and then Conditional
Compilation Constants.
Now that you know how to set the appropriate symbols, let’s look at how to use of some of
the key methods exposed by the Debug and Trace classes.
Asserting Errors
Developers often have to strike a balance between writing robust code and maximizing an
application’s performance. In an effort to write robust code, they often find themselves
writing a considerable amount of code that eva luates the state of the application.
Rich validation code can be invaluable for tracking down issues quickly during development,
but an overabundance of validation code can affect the application’s performance. In
general, publicly exposed Web services should validate the input parameters received from
the client. But in certain situations it is not necessary to validate member variables that are
considered implementation details of the Web service.
In cases where it makes sense to perform validation only during development, you can use
the Assert method exposed by the Debug and Trace classes. This method evaluates an
expression, and if the expression evaluates to false, it returns information about the
assertion. The error information includes text defined by the application as well as a dump of
the call stack.
The ability to programmatically generate error information that includes a dump of the call
stack is quite handy. There might be certain places in your code where you always want to
do this. For these situations, you can call the Fail method of the Debug and Trace classes.
Calling Fail is the equivalent of calling Assert where the expression always evaluates to
false.
Let’s take a look at an example. The following code demonstrates the use of the Assert and
Fail methods:
#define DEBUG
using System.Web.Services;
using System.Diagnostics;
public class Insurance
{
[WebMethod]
public double CalculateRate(int age, bool smoker)
{
StreamReader stream = File.OpenText("RateTable.txt");
Debug.Assert((stream.Peak() == -1),
314
"Error reading the rate table.",
"The rate table appears to be empty.");
try
{
// Implementation
}
catch(Exception e)
{
Debug.Fail("Unhandled exception.");
throw;
}
}
}
The code generates an assertion if the RateTable.txt file is empty or if an unhandled
exception is caught.
Because the Assert and Fail methods are called within a Web service, there is an issue with
the default behavior of these methods. By default, the Assert and Fail methods display
dialog boxes if the expression evaluates to false. But this is obviously not practical for
server-side code. You can alter the web.config file to redirect the output to a log file, as
shown here:
<configuration>
<system.diagnostics>
<assert assertuienabled="false"
logfilename="c:\Logs\Assert.log"/>
</system.diagnostics>
<! The rest of the configuration information >
</configuration>
This portion of the web.config file specifies an assert element to alter the default behavior of
the Assert and Fail methods. First I set the assertuienabled attribute to false to specify that
an assertion should not result in the display of a modal dialog box. I then specify the file
where the asserts will be written using the logfilename attribute. I also need to create the
Logs directory and give the ASPNET user sufficient permissions to create and write to the
Assert.log file because, by default, the ASPNET user does not have permissions to write to
the file system.
Finally, note that the default behavior of the Assert and Trace methods is to ignore the error
and continue. For this reason, do not use the Assert and Fail methods as a substitute for
throwing an exception.
Conditional Preprocessor Directives
315
Recall that the Conditional attribute provides a means of defining methods that should be
called only if a particular preprocessing symbol is defined. However, at times you might want
to have finer-grained control over implementation that is compiled into an application when a
particular preprocessing symbol is defined. For example, you might want to have extended
test routines embedded within your code during development. You can gain this finer-
grained control by specifying conditional preprocessor directives within your application.
Conditional preprocessor directives mark blocks of code that will be compiled into MSIL only
if a particular symbol is defined. Table 11-3 describes the key conditional preprocessor
directives used to do this.
Table 11-3: Conditional Preprocessor Directives
Directive Description
#if Begins a conditional compilation block. Code following the #if directive will
be compiled only if the condition evaluates to true.
#else Specifies statements that should be compiled only if the condition specified
by the #if directive evaluates to false.
#endif Terminates a conditional compilation block.
#define Defines a preprocessing symbol.
#undef Negates the definition of a preprocessing symbol.
For public Web services, there is rarely a good reason to return a stack trace to the user in
the event of an exception. A stack trace offers minimal benefit to an external user of your
Web service, plus the information provided by the stack trace can be used against you to
probe for security vulnerabilities within your Web service. During development, however, this
additional information can be helpful for debugging.
The following example uses conditional preprocessor directives to return stack trace
information only if the application was compiled with the DEBUG symbol defined:
#define DEBUG
using System.Web.Services;
using System.Web.Services.Protocols;
public class Insurance
{
[WebMethod]
public double CalculateRate(int age, bool smoker)
{
try
{
// Implementation
}
catch(Exception e)
{
#if DEBUG
316
throw new SoapException
("An unhandled exception was encountered.",
SoapException.ServerFaultCode, e);
#else
throw new SoapException
("An unhandled exception was encountered.",
SoapException.ServerFaultCode);
#endif
}
// Implementation
}
}
The example throws a SoapException if an unhandled exception is caught. The data
returned within the SoapException depends on whether the DEBUG symbol is defined. If the
DEBUG symbol is defined, a new instance of the SoapException class is initialized with the
caught exception. If the DEBUG symbol is not defined, a new instance of the class is
initialized with only a generic error message.
Trace Log
So far, I have focused mostly on error conditions. However, instrumenting normal operations
of an application can be equally valuable. The Debug and Trace classes provide a set of
methods and properties for logging tracing information within your application.
Output is written to the log using the Write, WriteLine, and WriteLineIf methods. The Write
method outputs text to the trace log, and WriteLine outputs text followed by a linefeed. If text
should be written to the trace log only if a certain condition is met, you can use the
WriteLineIf method.
The Debug and Trace classes also expose properties and methods to control the format of
the output. You can use the IndentLevel property to set the number of times a new line of
text is indented. The Indent and Unindent methods increment and decrement the
IndentLevel property, respectively. The IndentSize property specifies the number of spaces
in an indent.
You can specify when the output buffer will be flushed to the trace log by calling the Flush
method. You can also set the AutoFlush property to true to cause the output buffer to be
flushed after every write to the trace log.
Recall that the Debug and Trace classes defer their implementation to the TraceInternal
class. Therefore, modifying the static variables using one class affects the other. For
example, setting Debug.IndentSize to 4 also affects the indent size of the Trace class.
The following example shows the use of the trace methods within the context of a Web
service:
#define TRACE
using System.Diagnostics;
317
using System.Web.Services;
public class WebService
{
public WebService()
{
Trace.IndentSize = 4;
Trace.AutoFlush = true;
}
[WebMethod]
public void MyWebMethod(string param)
{
Trace.WriteLine("MyWebMethod");
Trace.Indent();
Trace.WriteLine("Start: " + DateTime.Now);
// Implementation
Trace.WriteLine("End: " + DateTime.Now);
Trace.Unindent();
}
}
Both the IndentSize and AutoFlush properties are set within the constructor of the method.
You can also set them at run time within the web.config file, as shown here:
<configuration>
<system.diagnostics>
<trace autoflush="true" indentsize="0"/>
</system.diagnostics>
</configuration>
You can use the trace element to set the initial value of the AutoFlush and IndentSize
properties. Any changes made to these properties by the application will override these
default settings.
You should be aware of one issue when you call the WriteLineIf method. Consider the
following code fragment:
Trace.WriteLineIf(someCondition, "Some error message.",
someLargeObject.ToString());
Because the text that will be written to the logs is passed to the WriteLineIf method, the
someLargeObject object must be serialized to a string even if the condition evaluates to
false. To avoid unnecessary processing, we can rewrite the code as follows :
318
#if TRACE
if(someCondition)
{
Trace.WriteLine("Some error message.",
someLargeObject.ToString());
}
#endif
The someLargeObject object will be serialized to a string only if the someCondition variable
is equal to true. This ensures that the costs associated with serializing someLargeObject are
incurred only if the resulting text will be written to the trace log.
Trace Listeners
The Debug and Trace classes support outputting the tracing log to multiple listeners. A
listener must inherit from the TraceListener class. The .NET Framework provides three
listeners: DefaultTraceListener, EventLogTraceListener, and TextWriterTraceListener.
The DefaultTraceListener is added to the collection of listeners by default. It generates
output that can be captured by debuggers for managed and unmanaged code. The tracing
information is sent to managed code debuggers via the Debugger.Log method and to
unmanaged code debuggers by means of the OutputDebugString Win32 API. In the case of
Visual Studio .NET, the output is displayed in the Output window.
You can add or remove listeners using the Listeners property of the Debug and Trace
classes. The following example removes the instance of the DefaultTraceListener and adds
an instance of the TextWriterTraceListener to the collection of listeners:
// Remove instance of the DefaultTraceListener.
Debug.Listeners.Remove(Debug.Listeners[0]);
// Add instance of the TextWriterTraceListener.
System.IO.FileStream fs =
System.IO.File.OpenWrite(@"c:\Logs\Tracing.log");
Debug.Listeners.Add(new TextWriterTraceListener(fs));
You can also add or remove listeners at run time. The following example performs the same
task as the previous code, but by modifying the web.config file, as you see here:
<configuration>
<system.diagnostics>
<trace>
<listeners>
<add name="Text"
type="System.Diagnostics.TextWriterTraceListener,System"
initializeData="c:\Logs\Tracing.log"/>
<remove
type="System.Diagnostics.DefaultTraceListener,System"/>
</listeners>
319
</trace>
</system.diagnostics>
</configuration>
In either case, you will need to create the Logs directory and give the ASPNET user
sufficient permissions to create and write to the Tracing.log file because, by default, the
ASPNET user does not have permissions to write to the file system.
Trace Switches
The DEBUG and TRACE preprocessing symbols allow you to configure the level of tracing
generated by an application at compile time. However, sometimes you might need finer-
grained levels of tracing or you might need to change the level of tracing at run time. For
example, you might want to record errors and warnings only under normal operating
conditions, but when an issue arises, you might want to enable more verbose tracing without
having to recompile the code.
You can achieve this functionality by leveraging classes that inherit from the Switch class
within your code. The .NET Framework includes two such classes, BooleanSwitch and
TraceSwitch. Much like the preprocessing symbols, the BooleanSwitch class provides a
mechanism to indicate whether tracing should be enabled. However, you can indicate this at
run time by modifying the application configuration file.
For example, suppose I want to create an instance of the BooleanSwitch class that allows
me to control whether trace information is displayed about when the beginning and ending of
a method is reached.
using System;
using System.Diagnostics;
public class Application
{
private static BooleanSwitch profileMethodsSwitch =
new BooleanSwitch("ProfileMethods", "Controls whether
start and end times are displayed for each method.");
static public void Main(string[] args)
{
Application.DoSomething("test", 3);
}
private void DoSomething(string param1, int param2)
{
Trace.WriteLineIf(profileMethodsSwitch.Enabled,
"Start DoSomething: " + DateTime.Now);
// Implementation
320
Trace.WriteLineIf(profileMethodsSwitch.Enabled,
"End DoSomething: " + DateTime.Now);
}
}
I define a BooleanSwitch to determine whether method-profiling information should be
written to the tracing log. First I create a static variable of type BooleanSwitch and define the
name and description of the switch within the constructor. When the switch’s constructor is
called, it will read the application configuration file to determine its value (true or false).
Next I use profileMethodsSwitch as the condition of the calls to WriteLineIf that display
method profile information. Notice that this switch can be used by the WriteLineIf method of
both the Trace and Debug classes. For that matter, the switch can be specified by any
conditional statement within the application.
Once the switch has been defined, you can configure it within the application’s configuration
file. The configuration file shown on the next page enables the ProfileMethods switch.
<configuration>
<system.diagnostics>
<switches>
<add name="TraceMethods" value="1" />
</switches>
</system.diagnostics>
</configuration>
I enable the TraceMethods switch by specifying an add element with its name attribute set to
the same string used to initialize the constructor of the switch. If the TraceMethods switch is
not listed in the configuration file, the default value will be 0 or false.
If you want to achieve more granularity when you configure which tracing information to
display, you can use the TraceSwitch class. You can set an instance of a TraceSwitch class
to a numeric value to indicate the level of tracing information that should be displayed.
The TraceSwitch class supports five levels of tracing, from 0 through 4. Table 11-4 describes
these tracing levels.
Table 11-4: Properties and Their Associated Tracing Levels
Property Tracing Level Description
N/A 0 Tracing is turned off.
TraceError 1 Error messages only.
TraceWarning 2 Warning and error messages.
TraceInfo 3 Informational, warning, and error messages.
TraceVerbose 4 Verbose.
Setting an instance of the TraceSwitch class to a particular value is cumulative. For
example, if the value is set to 3, not only is TraceInfo enabled, but TraceWarning and
TraceError are enabled as well.
321
Event Log
Some tracing information should be recorded regardless of switch settings or what
preprocessing symbols are defined. You should trace, for example, a critical error
encountered by a Web service that needs the immediate attention of a system administrator.
Critical information about the execution of an application should be written to the Event Log.
The Event Log provides a common repository for storing events from multiple sources. By
default, the system has three logs: the Application Log, the Security Log, and the System
Log. Events raised by your application should typically be posted to the Application Log.
Because the Event Log is an infrastructure component provided by the operating system, it
comes with supporting infrastructure that you would otherwise have to create yourself. For
example, an Event Log Service will automatically control the size of individual logs so that
you never have to truncate the log yourself. You can use the Event Log Viewer to view and
sort the entries in the log. You can also obtain additional tools that operate on the Event Log
and perform such tasks as notifying the system administrator in the event of an application
failure.
You can use the EventLog class to post messages to the Event Log. But before you write to
the Event Log, you must first register an event source. The event source is usually
associated with your application. The following code shows how to register an event source:
if(! EventLog.SourceExists("My Web Service"))
{
EventLog.CreateEventSource("My Web Service", "Application");
}
The preceding code first determines whether a particular event source is already registered.
If it is not, the code will register it. You can then write entries to the Event Log, as shown in
this code:
EventLog.WriteEntry("My Web Service",
"Unable to connect to the database", EventLogEntryType.Error);
This code writes a warning event to the Application Log. The three categories of events are
errors, warnings, and informational events. You can also include additional information with
the event, including an application-defined event ID and category ID as well as raw binary
data that can be helpful when you try to diagnose the problem.
By default, the ASPNET user does not have permissions to write to the event log. To provide
these permissions, set the
\\HKEY_LOCAL_MACHINE\SYSTEM\CurrentControlSet\Services\Eventlog\Application\Rest
rictGuestAccess registry key to 0 and reboot the machine.
By default, the ASPNET user also does not have permissions to create event sources. You
can overcome this limitation by registering the event source as part of the installation
procedure of your Web service. If you want to register event sources at run time, you need to
grant the ASPNET user read/write permissions to the
\\HKEY_LOCAL_MACHINE\SYSTEM\CurrentControlSet\Services\Eventlog registry key as
well as all of its subkeys.
The EventLog class also supports additional functionality such as receiving notification when
a new entry is created. Table 11-5 describes the properties, methods, and event exposed by
the EventLog class.
322
Table 11-5: Class Properties, Methods, and Event
Property Description
EnableRaisingEvents Specifies whether the instance of the EventLog class will
receive EntryWritten event notifications
Entries Retrieves a collection of instances of the EventLogEntry
class
Log Specifies the name of the event log that will be accessed
LogDisplayName Retrieves the friendly name of the event log
MachineName Specifies the name of the machine where the targeted
event log resides
Source Specifies the name of the source of the events written to
the event log
Method Description
Clear Removes all entries from the targeted event log
Close Closes the handle to the event log
CreateEventSource Registers a new event source within the system registry
Delete Deletes the specified event log
DeleteEventSource Unregisters a new event source
Exists Indicates whether the specified event log exists
GetEventLogs Retrieves an array of EventLog objects from the targeted
machine
LogNameFromSourceName Retrieves the name of the Event Log associated with a
particular event source
SourceExists Indicates whether the specified event source is registered
WriteEntry Writes an entry to the event log
Event Description
EntryWritten Fires when an event is written to the Event Log on the
local machine
Performance Counters
So far, I have limited my discussion of the methods of instrumentation to asynchronous
forms of communication. The application writes data to a text file or the Event Log, and then
the client opens the information source and reads the data. However, at times the client
might need to monitor the state of the application in real time.
For example, suppose I develop a Web service that accepts purchase orders from my
customers. I might be interested in knowing the number of requests per second that my Web
service receives. Information such as this can be communicated using performance
counters.
323
As you probably know, many applications publish a lot of data using performance counters.
ASP.NET is no exception. It publishes numerous counters about its run-time state, including
the number of applications currently running and the number of worker processes running.
ASP.NET also publishes numerous counters about the run-time state of individual
applications that it is hosting. These counters include the number of requests per second,
the number of requests queued, and the average request execution time.
If the Web service I just described accepts only purchase orders, I can monitor the number
of requests received per second without writing a single line of code. I can simply use an
application that ships with Windows called Performance Monitor. (The steps required to
launch Performance Monitor vary depending on your operating system, so consult online
help.)
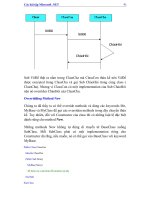
With Performance Monitor running, you can add counters that you want to have charted.
First click the button with the plus sign to open the Add Counters dialog box. Select
ASP.NET Applications in the Performance Object drop-down list, and then select the
Requests/Sec counter. Then select the instance that corresponds to the application you
want to monitor. The name of the application will be associated with the name of the
directory in which the application lives.
The Add Counters dialog box should look similar to this:
You can also create your own performance counters by using the
PerformanceCounterCategory and the PerformanceCounter classes. The following example
shows how to use the PerformanceCounterCategory class to register a new performance
counter:
if(! PerformanceCounterCategory.Exists("My Web Service"))
{
PerformanceCounterCategory.Create("My Web Service",
"Performance counters published by My Web Service.",
"Total Purchase Orders Processed",
"The total number of purchase orders processed.");
}
The preceding code registers a category called My Web Service and a counter called Total
Purchase Orders Processed if the category does not already exist.
324
After the counter is registered, you can publish to it using an instance of the
PerformanceCounter class. The following code creates a performance counter object and
increments the counter by one:
PerformanceCounter processedPOs =
new PerformanceCounter("My Web Service",
"Total Purchase Orders Processed", false);
processedPOs.Increment();
I create an instance of the PerformanceCounter class and initialize it to enable writes to the
Total Purchase Orders Processed counter. I then increment the counter by 1 by invoking the
object’s Increment method.
This is fine, but my goal is to publish the average number of purchase orders processed per
second. If my Web service exposes more than one Web method, I will not be able to
leverage the Requests/Sec counter exposed by ASP.NET to achieve my purpose. I need to
create another custom counter.
To create this new custom counter, I must leverage the CounterCreationData class to
register the counter. This class allows me to set the type of counter I need. The following
example registers counters to monitor total purchase orders processed as well as the
amount processed per second:
if(! PerformanceCounterCategory.Exists("My Web Service"))
{
CounterCreationDataCollection counterCDC =
new CounterCreationDataCollection();
counterCDC.Add(new CounterCreationData
("Purchase Orders Processed/sec",
" The number of purchase orders processed per second.",
PerformanceCounterType.RateOfCountsPerSecond32));
counterCDC.Add(new CounterCreationData
("Total Purchase Orders Processed",
" The total number of purchase orders processed.",
PerformanceCounterType.NumberOfItems32));
PerformanceCounterCategory.Create("My Web Service",
" Performance counters published by My Web Service.",
counterCDC);
}
First I create an instance of the CounterCreationDataCollection class that will be used to
pass the counters I want to register. I then create two instances of the CounterCreationData
class to register the counters. Notice that I do not have to write any code to calculate the
average number of purchase order requests per second. This is handled for me by the
Performance Monitor.
By default, the ASPNET user has permissions to write to a particular performance counter
but not to create performance counters and categories. You can overcome this limitation by
registering the performance counters as part of the installation procedure of your Web
service.
325
Sometimes you might want to create performance counters at run time. For example, you
might want to associate an instance of a performance counter with a particular instance of
your Web service or possibly with a particular user. In order to register a performance
counter at run time, you need to grant the ASPNET user read/write permissions to the
\\HKEY_LOCAL_MACHINE\SOFTWARE\
Microsoft\Windows NT\CurrentVersion\Perflib registry key as well as all of its subkeys.
Tables 11-6, 11-7, and 11-8 describe the properties and methods exposed by the
CounterCreationData, PerformanceCounter, and PerformanceCounterCategory classes,
respectively.
Table 11-6: CounterCreationData Class Properties
Property Description
CounterHelp Specifies the help string that describes the counter
CounterName Specifies the name of the counter
CounterType Specifies the type of counter
Table 11-7: PerformanceCounter Class Properties and Methods
Property Description
CategoryName Specifies the name of the cat egory in which the counter is registered
CounterHelp Retrieves the counter help text
CounterName Specifies the name of the counter
CounterType Retrieves the type of the counter
InstanceName Specifies the name of the instance with which the counter is
associated
MachineName Specifies the name of the machine with which the counter is
associated
RawValue Specifies the uncalculated value of this counter
ReadOnly Specifies whether the counter is read-only
Method Description
BeginInit Used by Visual Studio .NET to start the initialization of a counter
Close Closes the counters and releases any acquired resources
Decrement Decrements the counter by one within an atomic operation
EndInit Used by Visual Studio .NET to end the initialization of a counter
Increment Increments the counter by one within an atomic operation
IncrementBy Increments the counter by the specified value within an atomic
operation
NextSample Retrieves the uncalculated value of a counter sample
NextValue Retrieves the calculated value of a counter sample
RemoveInstance Removes the category instance associated with the counter
326
Table 11-8: PerformanceCounterCategory Class Properties and Methods
Property Description
CategoryHelp Retrieves the category help text
CategoryName Specifies the name of the category
MachineName Specifies the machine on which the category exists
CounterExists Indicates whether a specific counter is registered under a
particular category
Create Registers a category and one or more counters
Delete Deletes the category and its registered counters
Exists Indicates whether a particular category is registered
GetCategories Retrieves the list of registered categories
GetCounters Retrieves the list of registered counters for the particular category
GetInstanceNames Retrieves the list of instances for a particular category
InstanceExists Indicates whether a particular instance of the category is
registered
ReadCategory Gets the instance data associated with each counter registered
under the category
Tips and Tricks for Debugging
Some of the information that can aid in your efforts to debug Web services does not clearly
belong in any of the previous sections, so I present it in the following list:
§ When you use Microsoft Internet Explorer to view documents that are automatically
generated by the runtime (such as WSDL and results returned from the ASP.NET test
harness), you should disable the display of friendly error messages, WSDL, and the
results of any display-friendly error messages. Doing so will allow you to see the actual
error message returned. Simply take the following steps:
§ In Internet Explorer, choose Tools, Internet Options.
§ On the Advanced tab of the Internet Options dialog box, deselect Show
Friendly HTTP Error Messages.
§ If Internet Explorer serves you a blank page, view the source. Sometimes an error
message returned by the runtime will not display in the browser. To see these error
messages, view the underlying source directly by clicking the View menu item and then
selecting
§ View Source.
§ When you debug a Web service that is accessed through a proxy, you should increase
the timeout value of the proxy to a large value. For ASP.NET proxies that derive from
the SoapHttpClientProtocol class or for Remoting wrapped proxies that derive from the
RemotingClientProxy class, set the Timeout property to −1 (infinity). Before you release
the client application to production, be sure to set the timeout value back to a
reasonable value.
§ Visual Studio .NET allows you to debug multiple types of code within an application,
including ASP, ASP.NET, unmanaged code, and SQL Server stored procedures. Make
sure that the appropriate debugging options are selected within your project settings.
For example, if you have an ASP.NET Web service that calls unmanaged code and you
327
want to debug the entire implementation of the Web service, be sure to enable
debugging support for both ASP.NET and unmanaged code.
Summary
This chapter covers interactive source-code debugging, the information needed by the
debugger, and how to instrument your applications.
First I describe some core features of the Visual Studio .NET debugger that help simplify the
task of developing Web services. One of the unique requirements for debugging Web
services is strong support for remote debugging. The key features that Visual Studio .NET
provides for supporting remote debugging include these:
§ Visual Studio .NET automatically attaches to the remote ASP.NET process hosting the
Web service.
§ It allows you to configure the target server to allow remote debugging.
§ It can display a logical call stack that spans multiple threads.
§ It ensures that you get a complete call stack when an unhandled exception occurs
within your application.
Next I explain what information the debugger needs in order to perform essential tasks.
Specifically, it needs information for creating a readable call stack; that information is
contained within the metadata in the module that contains the types that compose the call
stack.
Interactive source-code debugging requires mapping between the original source code and
the machine code generated by the JIT compiler. One half of the mapping, between the
source code and the MSIL, is provided by the program database (.pdb) file. The other half of
the mapping, between the MSIL and the native machine code, is provided by the tracking
information generated by the JIT compiler.
The tracking information is generated when the MSIL is JIT compiled into native code.
Because the compiled native code is unaffected by the generation of the tracking
information, the slight performance penalty associated with tracking occurs only during
application warm-up.
You can also specify whether the JIT compiler generates optimized code. If optimization is
turned on, you might experience a loss of fidelity between the compiled machine code and
the original source code. Because you incur a significant performance hit as a result of
generating machine code that is not optimized, I suggest that you enable optimization for
release builds.
Finally I explain the various technologies provided by .NET for instrumenting your Web
services and the client applications that interact with them. I explain the similarities and
differences between the Debug and Trace classes and show you how to add and remove
listeners at compile time as well as at run time.
I also explain how to leverage the Event Log for communicating important information to the
system administrator, and I demonstrate how to use performance counters to publish real-
time information about the current state of the application.
328
Chapter 12: Scalability and Availability
Overview
The primary reason for developing Web services is so that developers will use them to build
solutions for their customers. No matter how cool or useful your Web service is, it can’t
provide any value if it is down. For a Web service to be adopted by developers, it must be
reliable.
As your Web service becomes more popular, it must scale to meet the increasing demands
of its clients, particularly if your Web service either indirectly or directly generates revenue
for your company.
For example, suppose Woodgrove Bank allows its customers to transfer funds electronically
from one account to another. And suppose the bank develops a Web service, called
Banking, that allows its customers to request that funds be transferred. If the Banking Web
service is consumed by personal financial management software packages such as
Microsoft Money, it might need to support hundreds of thousands or possibly millions of
clients.
The overall scalability and availability of a Web service is determined by its weakest link.
Nontrivial Web services often leverage multiple resources such as databases and directory
services. If a particular resource does not scale to meet the needs of the Web service, the
Web service itself will not scale to meet the needs of its clients.
The Banking Web service relies on multiple resources to process a customer’s request.
These resources include a SQL Server database that holds customer account information as
well as a legacy line-of-business (LOB) application that is used to coordinate the transfer of
funds with other banks.
In this chapter, I present techniques for increasing the scalability and availability of your Web
services as well as the resources they use. I also examine scalability and availability from
the perspective of the client and explore ways to minimize the risks associated with using a
Web service that is not under your direct control.
Scaling Your Web Service
To be successful, your Web service must scale to handle an increasing number of client
requests. If your Web service is hosted on the Internet, you might eventually have enormous
numbers of requests from clients from all over the world.
You should establish scalability goals early in the project. One classic mistake is setting
scalability goals based on the average number of requests over a period of time. You should
instead establish goals based on the total number of peak requests.
For example, let’s say the Securities Web service has an expected usage of 300,000
requests per month. Assuming a 30-day month, that equates to 10,000 requests per day.
However, 40 percent of the transfers occur on the 1st and 15th days of the month, when
customers typically get paid. This means that the Web service should actually be capable of
handling 60,000 requests per day.
In the following sections, I examine two strategies for scaling a Web service and the
resources it uses: scaling up and scaling out.
329
Scaling Up
Scaling up a Web service involves moving it to a bigger, faster, more powerful machine to
accommodate increased workloads. One main advantage of this strategy is that it makes the
infrastructure easier to manage: it does not increase the number of servers the system
administrator has to maintain.
One of the main disadvantages of the scale-up strategy is cost. You typically pay premium
prices for higher-end computers, so the cost per transaction for high-end servers is often
higher than for their commodity counterparts. This is further compounded when redundant
servers are required to meet availability requirements.
Another disadvantage of the scale-up strategy is that you can scale only as much as the
fastest machine will allow. Also, high-end servers are often multiprocessor boxes, so
resources must be designed to take advantage of multiprocessors to fully utilize the box.
In general, you should consider a scale-up strategy for resources that are difficult to scale
out. (I address the scale-out strategy in the next section.) For example, stateful resources
such as relational databases are often difficult to scale out, especially if the data is dynamic,
highly relational, and shared across multiple clients.
Recall that the Banking Web service stores all user state within a SQL Server database. You
can often scale up the machine hosting SQL Server and still keep hardware expenditures
within reasonable levels. If so, the scale-up strategy is probably your ideal course of action.
For resources that are difficult to scale up, look for opportunities to minimize the work they
execute. For example, avoid implementing business logic within database stored procedures
or performing data transformations within the database engine itself. Instead, move these
activities out of the database and into a business logic layer that can be more easily scaled
out.
Scaling Out
When scaling up is not feasible, you can scale out a resource by hosting it on a cluster of
machines and then distributing the requests made to that resource across multiple machines
in the cluster. As the load on the resource increases, you can add more computers to the
cluster to accommodate the increase. (I realize that you might be accustomed to a more
specific definition of cluster, but here I use the word in a broader sense, to refer to a group of
computers that are used to host a particular resource.)
One advantage of the scale-out strategy is that you can often achieve near- linear scalability
as you add more computers. The cost per transaction remains relatively constant as the
infrastructure is scaled.
One disadvantage of scaling out is increased complexity. Instead of maintaining a single
box, you must maintain multiple machines in the cluster. For example, you must install and
maintain each Web server in the Web farm.
You can use products such as Microsoft Application Center to help reduce the costs
associated with maintaining multiple machines in a cluster. The primary goal of Application
Center is to allow an administrator to maintain a clustered resource as if it were installed on
a single system. Application Center provides out-of-the-box support for Web-based
applications, so it is well suited for deploying and managing HTTP-based Web services.
Network Load Balancing
330
A clustering technology known as network load balancing (NLB) involves distributing
requests across the nodes in the cluster at the network protocol level. The client sends a
request to a particular IP address, and the NLB system intercepts the request and ensures
that only one node in the cluster processes it.
Because the requests are handled at the network protocol level, the client sees the resource
as a single system image. The client is oblivious to which node is actually handling the
request, so in most cases it is not required to make any changes in the way the resource is
accessed.
One common use of NLB is in the creation of a Web farm. A Web farm is a cluster of Web
servers that are front-ended by a hardware- or software-based NLB system. Because a Web
farm is designed to handle HTTP requests, you can use it to host an HTTP -based Web
service.
NLB is not limited to distributing HTTP requests; you can use it to distribute network
requests for a variety of protocols, including such non-HTTP resources as an FTP server or
even a Common Internet File System (CIFS) file share.
To ensure that your network load–balanced resource offers the highest degree of availability,
make sure it has the characteristics described in the following three sections.
The Nodes in the Cluster Should Be Independent of One Another Each node needs to
be capable of handling the client’s request independently of the other nodes in the cluster
because any node could fail at any time. Such a failure should not hinder any other nodes
from processing requests.
For example, a node is not independent if it has data stored locally that is required for
completion of the client’s request. If the node fails, no other node in the cluster can complete
the request.
Any Node Should Be Able to Handle Any Request If a request can be handled by any
node in the cluster, the load balancing system can more evenly distribute the requests
across the nodes in the cluster. This characteristic also ensures that nodes can be easily
added or removed, allowing the cluster to be expanded or contracted to meet changes in
demand.
For any node to be able to handle any request, a resource cannot rely on state stored locally
between requests. If the resource is stateful, all requests from a given client must be routed
to the same node in the cluster. The following code shows an example of a stateful Web
service:
using System;
using System.Web.Services;
class Banking : WebService
{
[WebMethod(EnableSession=true)]
public void Initialize(int accountNumber)
{
this.Session["AccountNumber"] = accountNumber;
}