Handbook of Industrial Automationedited - Chapter 9 pdf
Bạn đang xem bản rút gọn của tài liệu. Xem và tải ngay bản đầy đủ của tài liệu tại đây (1.03 MB, 79 trang )
Chapter 9.1
Perspectives on Designing Human Interfaces for Automated
Systems
Anil Mital
University of Cincinnati, Cincinnati, Ohio
Arunkumar Pennathur
University of Texas at El Paso, El Paso, Texas
1.1 INTRODUCTION
1.1.1 Importance and Relevance of Human
Factors Considerations in Manufacturing
Systems Design
The design and operation of manufacturing systems
continue to have great signi®cance in countries with
large and moderate manufacturing base, such as the
United States, Germany, Japan, South Korea,
Taiwan, and Singapore. It was widely believed in the
1980s that complete automation of manufacturing
activities through design concepts such as ``lights-out
factories,'' would completely eliminate human in¯u-
ence from manufacturing, and make manufacturing
more productive [1]. However, we now see that com-
plete automation of manufacturing activities has not
happened, except in a few isolated cases. We see three
basic types of manufacturing systems present and
emergingÐthe still somewhat prevalent traditional
manual manufacturing mode with heavy human in-
volvement in physical tasks, the predominant hybrid
manufacturing scenario (also referred to traditionally
as the mechanical or the semiautomatic systems) with
powered machinery sharing tasks with humans, and
the few isolated cases of what are called computer-
integrated manufacturing (CIM) systems with very
little human involvement, primarily in supervisory
capacities. Indeed, human operators are playing, and
will continue to play, important roles in manufacturing
operations [2].
Another important factor that prompts due consid-
eration of human factors in a manufacturing system,
during its design, is the recent and continuous upward
trend in nonfatal occupational injuries that has been
observed in the manufacturing industry in the United
States [3]. While these injuries may not be as severe and
grave as the ones due to accidents such as the
Chernobyl Nuclear Reactor accident (the Three Mile
Island nuclear accident prompted an upswing in
human factors research, especially in nuclear power
plants and in process industry settings), the increasing
trend in injuries leaves the claim that ``automation'' of
manufacturing has resulted in softer jobs for manufac-
turing workers questionable. In fact, many manufac-
turing researchers and practitioners believe that an
increase in severe injuries in manufacturing is primarily
due to the automation of simpler tasks, leaving the
dicult ones for the humans to perform. This belief
is logical as the technology to automate dicult tasks
is either unavailable or expensive.
The factors discussed suggest that manufacturing
systems (our de®nition of a system is broad; a system
may thus be a combination of a number of equipment/
machines and/or humans) be designed with human
limitations and capabilities in mind, if the system is
to be productive, error-free, and safe, and result in
749
Copyright © 2000 Marcel Dekker, Inc.
quality goods and services, all vital goals for manufac-
turing organizations.
1.1.2 The Human±Machine System Framework
for Interface Design
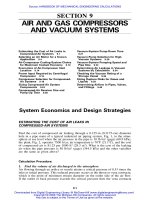
Traditionally, system designers have accounted for
human limitations and capabilities by considering the
human operator as an information processor having
sensory and motor capabilities and limitations
(Fig. 1). It can be readily seen from Fig. 1 that the
key elements to the ecient and error-free functioning
of a human±machine system are the provision of infor-
mation to human operators in the system, and the
provision for control of the system by humans.
Displays provide information about the machine or
the system to human operators, and controls enable
human operators to take actions and change machine
or system states (conditions). Operator feedback is
obtained through interaction with the controls (tactile
sensing, for instance). Thus, in the classical view,
human interaction with automation is mediated
through displays and controls for a two-way exchange
of information.
The recent view of the human±machine system,
resulting out of advances in computerized informa-
tion systems, sees the human operator as a super-
visory controller [4] responsible for supervisory
functions such as planning, teaching, monitoring,
intervening,learning,etc.(Fig.2).Eventhough,in
such a view, the human operator has a changed role,
displays and controls still provide the fundamental
medium for human interaction with the system.
Indeed, properly designed displays and controls are
fundamental to the ecient and error-free functioning
750 Mital and Pennathur
Figure 1 Traditional representation of human interaction with machine.
Copyright © 2000 Marcel Dekker, Inc.
of manufacturing systems. Ergonomics, which we
de®ne as the study of issues involved in the application
of technology to an appropriate degree to assist the
human element in work and in the workplace, provides
recommendations for interface design based on
research in human sensory and motor capabilities
and limitations.
1.1.3 Scope of This Chapter
Even though displays and controls, and their eective
design, are fundamental to the ecient and error-free
operation of the system, a number of important activ-
ities need to be carried out before one can think of
displays and controls. These activities stem from the
central need to build systems to suit human limita-
tions and capabilities. Some of these activities, such
as ``user needs analysis,'' are relatively new concepts
and form the core of what is called the ``usability
engineering approach'' to design. Techniques asso-
ciated with other activities, such as task analysis
and function allocation between humans and auto-
mated equipment, are an integral part of designing
``good'' jobs, and have been in existence for some
time. We present some of these techniques and meth-
ods.
Inherent throughout our presentation is the essence
of the ``human-centered interface design approach.''
We ®rst present elements of this approach and con-
trast it with the ``system-centered interface design
approach.'' It is recommended that this concept of
human-centered design guide the designer at both
the system, as well as at the nuts-and-bolts, design
levels.
Displays and controls, the selection, design, and
evaluation of which will be the theme for the remainder
of the chapter, form a part of aids, equipment, tools,
devices, etc., that are necessary for a system to operate
satisfactorily. Due to the wide variety of available tech-
nologies, and due to the fact that most ergonomics
recommendations for the design of displays and con-
trols remain the same regardless of the technology used
(e.g., recommendations on the design of lettering
remain the same whether the recommendation is for
a conventional hand-held meter, a visual display unit,
or printed material), we provide only general recom-
mendations for dierent types of displays and controls,
without reference to commercial products and
equipment.
A few other notes about the scope of this chapter:
due to the vast literature available in the area of
design of human±machine systems, our emphasis in
this chapter is on the breadth of coverage rather
than depth in any area. This emphasis is deliberate,
and is motivated, in addition, by our intention to
provide the reader a taste of the process of design
and evaluation of a modern human±machine system.
Readers interested in more detail in any one area or
technique should refer to our recommended reading
list. Also, even though the recommendations and
guidelines summarized in this chapter come from
research in human±machine settings other than hard-
core manufacturing settings, they are equally applic-
able to manufacturing systemsÐthe general
framework and the speci®c recommendations we
have collected and provided in this chapter for
design of human±machine systems are applicable
across systems.
Human Interfaces for Automated Systems 751
Figure 2 The latest notion of human as a supervisory
controller.
Copyright © 2000 Marcel Dekker, Inc.
1.2 APPROACHES TO DESIGNING
SYSTEMS FOR HUMAN±MACHINE
INTERFACE
1.2.1 The System-Centered Design Approach
The system-centered design approach, as the name sug-
gests, analyzes the system currently in use, designs and
speci®es the new system based on this analysis, builds
and tests the new system, and delivers the system and
makes minor changes to the system (Fig. 3). The focus
is on the goals of the system and the goals of the orga-
nization within which the system is to perform.
Designers following this approach fail to consider the
users before designing the system. As a result, users of
such systems are required to remember too much infor-
mation. Also, typically, these systems are intolerant of
minor user errors, and are confusing to new users.
More often than not, such systems do not provide
the functions users want, and force the users to per-
form tasks in undesirable ways. New systems designed
the system-centered way have also been shown to cause
unacceptable changes to the structure and practices in
entire organizations [5].
1.2.2 The Human-Centered Design Approach
The human-centered design approach to human±
machine interaction, unlike the system-centered
approach, puts the human attributes in the system
ahead of system goals. In other words, the entire
system is built around the user of the systemÐthe
human in the system. This approach has been var-
iously called the ``usability engineering approach,''
the ``user-centered approach'' or the ``anthropocentric
approachtoproductionsystems,''etc.Figure4pro-
vides our conception of the human-centered approach
to interface design. The ®rst step in this design
approach is information collection. Information
about user needs, information about user cognitive
and mental models, information on task demands,
information on the environment in which the users
have to perform, information on the existing interface
between the human operator (the user of the system)
and the machine(s), requirements of the design, etc.,
are some of the more important variables about
which information is collected. This information is
then used in the detailed design of the new interface.
The design is then evaluated. Prototype development
and testing of the prototype are then performed just as
in any other design process. User testing and evalua-
tion of the prototype, the other important characteris-
tic of this design process which calls for input from the
end user, is then carried out. This results in new input
to the design of the interface, making the entire design
process iterative in nature.
Even though the human-centered design approach
is intended to take human capabilities and limitations
into account in system design and make the system
usable, there are a number of diculties with this
approach. The usability of the system is only as good
as its usability goals. Thus, if the input from the users
about the usability goals of the system are inappropri-
ate, the system will be unusable. One approach to over-
come this problem is to include users when setting
usability goals; not just when measuring the usability
goals. Another common diculty with this approach is
the lack of provision to take into account qualitative
data for designing and re®ning the design. This is due
to the de®ciency inherent in the de®nition of usability
which calls for quantitative data to accurately assess
the usability of a system. There is also the drawback
that this approach is best suited for designing new
systems, and that it is not as eective for redesign of
existing systems.
Despite these limitations, the human-centered
design approach merits consideration from designers
because it proactively takes the user of the product
(displays and controls with which we are concerned,
and which make up the interfaces for human±machine
interaction, are products) into the system design
process, and as a result, engineers usability, into the
product.
752 Mital and Pennathur
Figure 3 System-centered approach to design.
Copyright © 2000 Marcel Dekker, Inc.
1.3 THE PROCESS OF SOLVING HUMAN±
MACHINE INTERFACE PROBLEMS
Even though displays and controls are the ®nal means
of information exchange between humans and
machines in a system, the actual design of the hard-
ware and software for displays and controls comes
only last in order, in the process of solving human±
machine interface problems. The other key steps in
this process include user-needs analysis, task analysis,
situation analysis, and function allocation decisions,
after which the modes of information presentation
and control can be decided. In the following sections,
we discuss each of these steps.
1.3.1 User-Needs Analysis
The goal of user-needs analysis is to collect informa-
tion about users and incorporate it into the design
process for better design of the human±machine
interface. User-needs analysis typically involves the
following activities: characterization of the user,
characterization of the task the user performs, and
characterization of the situation under which the user
Human Interfaces for Automated Systems 753
Figure 4 Human-centered approach.
Copyright © 2000 Marcel Dekker, Inc.
has to perform the task. What follows are guide-
lines and methods for performing each of these three
activities prior to designing the system.
1.3.1.1 Characterization of the User
Table 1 provides a user characterization checklist.
Included in this checklist are questions to elicit infor-
mation about the users, information about users' jobs,
information about users' backgrounds, information
about usage constraints, and information about the
personal preferences and traits of the users.
As is obvious from the nature of the questions in
the checklist, the goal of collecting such information
is to use the information in designing a usable
system.
1.3.1.2 Characterization of the Task
Characterization of the tasks users have to perform to
attain system goals is done through task analysis. Task
analysis is defned as the formal study of what a human
operator (or a team of operators) is required to do to
achieve a system goal [6]. This study is conducted in
terms of the actions and/or the cognitive processes
involved in achieving the system goal. Task analysis
is a methodology supported by a number of techniques
to help the analyst collect information about a system,
organize this information, and use this information to
make system design decisions. Task analysis is an
essential part of system design to ensure ecient and
eective integration of the human element into the
system by taking into account the limitations and cap-
abilities in human performance and behavior. This
integration is key to the safe and productive operation
of the system.
The key questions to ask when performing task ana-
lysisactivitiesareshowninTable2.Thetaskanalysis
methodology ®nds use at all stages in the life cycle of a
systemÐfrom initial conception through the prelimin-
ary and detailed design phases, to the prototype and
actual product development, to the storage and demo-
lition stage. Task analysis is also useful for system
evaluation, especially in situations involving system
safety issues, and in solving speci®c problems that
may arise during the daily operations of a system.
Task analysis can be carried out by system designers
or by the operations managers who run the system on a
day-to-day basis.
754 Mital and Pennathur
Table 1 User Characteristics Checklist
Data about users What is the target user group?
What proportion of users are male and what proportion are female?
What is average age/age range of users?
What are the cultural characteristics of users?
Data about job What is the role of the user (job description)?
What are the main activities in the job?
What are the main responsibilities of the user?
What is the reporting structure for the user?
What is the reward structure for the user?
What are the user schedules?
What is the quality of output from the user?
What is the turnover rate of the user?
Data about user What is the education/knowledge/experience of the user relevant to the job?
background What are the relevant skills possessed by the user?
What relevant training have the users undergone?
Data about usage Is the current equipment use by users voluntary or mandatory?
constrains What are the motivators and demotivators for use?
Data about user What is the learning style of the user?
personal What is the interaction style of the user?
preferences and What is the aesthetic preference of the user?
traits What are the personality traits of the user?
What are the physical traits of the user?
Adapted from Ref. 5.
Copyright © 2000 Marcel Dekker, Inc.
While many dierent task analysis techniques exist
to suit the dierent design requirements in systems, our
primary focus here is on techniques that help in design-
ing the interface. The key issues involved in designing a
human interface with automated equipment are asses-
sing what will be needed to do a job (the types of
information that human operators will need to under-
stand the current system status and requirements; the
types of output that human operators will have to
make to control the system), and deciding how this
willbeprovided.Table3providesasummaryofthe
important activities involved in the process of interface
design and the corresponding task analysis technique
to use in designing this activity. We present brief sum-
maries of each of these techniques in the following
sections. The reader should refer to Kirwan and
Ainsworth [6], or other articles on task analysis, for a
detailed discussion of the dierent task analysis tech-
niques.
Hierarchical Task Analysis. This enables the analyst
to describe tasks in terms of operations performed by
the human operator to attain speci®c goals, and
``plans'' or ``statements of conditions'' when each of
a set of operations has to be carried out to attain an
operating goal. Goals are de®ned as ``desired states of
Human Interfaces for Automated Systems 755
Table 2 Checklist for Task Analysis Activities
Goals What are the important goals and supporting tasks?
For every important task:
Intrinsics of the task What is the task?
What are the inputs and outputs for the task?
What is the transformation process (inputs to outputs)?
What are the operational procedures?
What are the operational patterns?
What are the decision points?
What problems need solving?
What planning is needed?
What is the terminology used for task speci®cation?
What is the equipment used?
Task dependency and What are the dependency relationships between the current task and the other tasks and systems?
criticality What are the concurrently occurring eects?
What is the criticality of the task?
Current user problems What are the current user problems in performing this task?
Performance criteria What is the speed?
What is the accuracy?
What is the quality
Task criteria What is the sequence of actions?
What is the frequency of actions?
What is the importance of actions?
What are the functional relationships between actions?
What is the availability of functions?
What is the ¯exibility of operations?
User discretion Can the user control or determine pace?
Can the user control or determine priority?
Can the user control or determine procedure?
Task demands What are the physical demands?
What are the perceptual demands?
What are the cognitive demands?
What are the envirornmental demands?
What are the health and safety requirements?
Adapted from Ref. 5.
Copyright © 2000 Marcel Dekker, Inc.
systems under control or supervision'' (e.g., maximum
system productivity). Tasks are the elements in the
method to obtain the goals in the presence of con-
straints (e.g., material availability). Operations are
what humans actually do to attain the goals. Thus,
hierarchical task analysis is ``the process of critically
examining the task factors, i.e., the human operator's
resources, constraints and preferencesÐin order to
establish how these in¯uence human operations in
the attainment of system goals.'' System goals can be
described at various levels of detail (or subgoals), and
hence the term ``hierarchical.'' The hierarchical task
analysis process begins with the statement of overall
goal, followed by statements of the subordinate opera-
tions, and the plans to achieve the goal. The subordi-
nate operations and the plans are then checked for
adequacy of redescription (of the goal into subopera-
tions and plans). The level of detail necessary to ade-
quately describe a goal in terms of its task elements
determines the ``stopping rule'' to use when redescrib-
ing. A possible stopping rule could be when the prob-
ability of inadequate performance multiplied by the
costs involved if further redescription is not carried
out, is acceptable to the analyst.
Activity Sampling. This is another commonly used
task analysis method for collecting information about
the type and the frequency of activities making up
atask.Figure5showsthestepsinvolvedinactivity
sampling.
Samples of the human operator's behavior at speci-
®ed intervals are collected to determine the proportion
of time the operator spends performing the identi®ed
activities. Two key factors for the activity sampling
method to work include the requirements that the
task elements be observable and distinct from one
another, and that the sampling keep pace with the
performance of the task. Typically, the analyst per-
forming activity sampling, classi®es the activities
involved, develops a sampling schedule (these two
aspects form the core of the design of activity samp-
ling), collects and records information about activities,
and analyzes the collected activity samples. Activity
sampling has its advantages and disadvantages.
Objectivity in data recording and collection, ease
of administering the technique, and the ability of the
technique to reveal task-unrelated activities that need
analysis, are some of the advantages of the method.
Requirements of a skilled analyst (for proper identi®-
cation and description of the task elements), and the
inability of the technique to provide for analysis of
cognitive activities are the main disadvantages of the
technique.
Task Decomposition. This is a method used to exactly
state the tasks involved in terms of information con-
756 Mital and Pennathur
Table 3 Summary of Task Analysis Activities and Methods Involved in
Interface Design
Activity Task analysis method
Gathering task information Hierarchical task analysis
representing the activities within the task Activity sampling
Stating required information, actions, Work study
and feedback Task decomposition
Decision/action diagrams
Checking adequacy of provisions for Table-top analysis
information ¯ows for successful Simulation
completion of the task Walk-through/talk-through
Operator modi®cations surveys
Coding consistency surveys
Identifying links between attributes Link analysis
(total system check) to ensure system Petri nets
success Mock-ups
Simulator trials
Provide detailed design Person speci®cation
recommendations Ergonomics checklists
Modi®ed from Ref. 6.
Copyright © 2000 Marcel Dekker, Inc.
tent, and actions and feedback required of the opera-
tor. Once a broad list of activities and the tasks
involved have been generated using either hierarchical
task analysis or activity sampling, task decomposition
can be used to systematically expand on the task
descriptions. The various steps involved in task decom-
positionarepresentedinFig.6.
Decision±Action Diagram. This is one of the most
commonlyusedtoolsfordecisionmaking.Figure7
is an example of a decision±action diagram [7]. The
decision±action diagram sequentially proceeds through
a series of questions (representing decisions) and pos-
sible yes/no answers (representing actions that can be
taken). The questions are represented as diamonds,
and the possible alternatives are labeled on the exit
lines from the diamond. A thorough knowledge of
the system components, and the possible outcomes of
making decisions about system components is essential
for constructing complete and representative decision±
action diagrams.
Table-Top Analysis. As the name implies, this is a
technique through which experts knowledgeable
about a system discuss speci®c system characteristics.
In the context of interface design, this task analysis
methodology is used for checking if the information
¯ows identi®ed during the initial task analysis and
task description, is adequate for successful task com-
pletion. Table-top analysis, hence, typically follows the
initial hierarchical or other forms of task analysis
which yield task descriptions, and provides informa-
tion input for the decomposition of the tasks. A num-
ber of group discussion techniques exist in practice,
including the Delphi method, the group consensus
approach, the nominal group technique, etc., for con-
ducting table-top analysis, each with its own merits
and demerits.
Walk-Through/Talk-Through Analysis. These ana-
lyses involve operators and other individuals having
operational experience with the system, walking and
talking the analyst through observable task com-
ponents of a system in real time. Walk-through is
normally achieved in a completely operational system
or in a simulated setting or even in a mock-up setting.
Talk-through can be performed even without a simula-
tion of the systemÐthe only requirements are drawing
and other system speci®c documentation to enable the
analysts to set system and task boundaries while per-
forming the talk-through analysis. For more informa-
tion on walk-through and talk-through analyses, refer
to Meister [8].
Human Interfaces for Automated Systems 757
Figure 5 Activities involved in activity sampling.
Copyright © 2000 Marcel Dekker, Inc.
Operator Modi®cation Surveys. These surveys are
performed to gather input from the actual users,
(i.e., the operators) of the system, to check if there
will be diculties in using the system, and of what
types. This checking of the adequacy of the interface
design of the system from the users' perspective is
done through surveys conducted on similar already
operational systems. In general, operators and other
users of systems maintain and provide information on
design inadequacies through memory aids, such as
their own labels on displays to mark safe limits, per-
ceptual cues, such as makeshift pointers, and organi-
zational cues, such as grouping instruments through
the use of lines. These makeshift modi®cations done
by the operators indicate design de®ciencies in the
system, and can be planned for and included in the
redesign of the existing system or in the design of a
new system.
Coding Consistency Surveys. These surveys are used
to determine if the coding schemes in use in the
system are consistent with the associated meanings,
and if and where additional coding is needed. The
recommendation when performing coding consis-
tency surveys is to record the description of the loca-
tion of the item, a description of the coding used for
that item (intermittent siren sound), a description of
any other coding schemes used for that item (inter-
758 Mital and Pennathur
Figure 6 The task decomposition process.
Copyright © 2000 Marcel Dekker, Inc.
mittent siren sound accompanied by a yellow ¯ash-
ing light), and a complete description of the function
being coded.
Link Analysis. This is a technique used to identify
and represent the nature, frequency, and/or the impor-
tance of relationships or links existing between indivi-
dual operators and some portion of the system [9].
Link analysis has been found to be particularly useful
in applications where the physical layout of equipment,
instruments, etc., is important to optimize the inter-
action of the human operator with the system. Link
analysis does not require extensive resources to
perform (in fact, paper and pencil are the only
resources required to perform a link analysis). Link
analysis proceeds by ®rst collecting information
about the system components used during task perfor-
mance. This information is then used to develop a
complete list of links between individual system ele-
ments. The links thus established are then diagramed
and ranked for importance. The order of importance
may be determined based on the frequency of activity
between two links, or based on other appropriate mea-
sures decided by the system expert. The nature of the
links to be studied (is it a movement of attention or
position between parts of the system?), and the level of
detail to include in de®ning each link are important
factors that determine the overall structure and useful-
ness of the links established. Link analysis does not
need observational data collection; a mere description
of the procedures in the form of a technical manual is
sucient for identifying and establishing the links. The
extensive graphical and tabular representations
involved in link analysis, however, limits the use of
this technique for large systems with involved linkages
in the system.
Simulator Analysis. The goal of simulation studies is
to replicate, and observe, system (including operator
and operating environment) performance while mak-
ing the performance environment as representative and
close to the real-time environment as possible.
Dierent forms of simulations exist depending on the
platform or the simulator used for the simulation: a
simple paper-and-pencil simulation, to a mock-up of
a system that may or may not be dynamic, to a
dynamic simulation which will respond in real time.
Whatever the method of simulation used, the key con-
sideration in simulation studies is the trade-o between
the ®delity of simulation (deciding the features of the
system that need ®delity is an issue too), and the cost of
involved in building high-®delity simulations. Despite
this limitation, simulation analysis can be useful when
designing task situations that are dangerous for
humans to perform, or dicult to observe.
Person Speci®cation. The goal of person speci®cation
is to detail the key physical and mental capabilities, the
key qualifcations and personality traits, and experi-
ence, required of the operator to perform specif ed
tasks. Person speci®cation is similar to the user char-
Human Interfaces for Automated Systems 759
Figure 7 Generic function allocation analysis ¯owchart.
Copyright © 2000 Marcel Dekker, Inc.
760 Mital and Pennathur
Figure 7 (continued)
Copyright © 2000 Marcel Dekker, Inc.
Human Interfaces for Automated Systems 761
Figure 7 (continued)
Copyright © 2000 Marcel Dekker, Inc.
acterization exercise described in Sec. 1.3.1.1; the
checklist used for user characterization can be used
for person speci®cation also. One of the widely used
techniques for person speci®cation is the position ana-
lysis questionnaire. Broadly, position analysis ques-
tionnaires require the operator to identify for their
speci®ed tasks andjobs, the information input, the
mental processes, the work output, the context of the
job, the relationship with other personnel in the sys-
tem, and any other relevant job characteristics. Using
the responses from the operators, the skill content of
tasks and jobs can be determined, and can help in
designing personnel selection and training programs
to ensure optimal human±machine interaction.
Ergonomics Checklists. These checklists are generally
used to ascertain if a particular system meets ergo-
nomic principles and criteria. Ergonomics checklists
can check for subjective or objective information and
can cover issues ranging from overall system design to
the design of individual equipment. Checklists can also
range in detail from the broad ergonomic aspects to
theminutedetail.Table4providesanexampleofa
checklist for equipment operation. A number of
other standard checklists have also been developed
by the ergonomics community. Important among
these are the widely used and comprehensive set of
checklists for dierent ergonomics issues by
Woodson [10,11], MIL-STD 1472C [12] which covers
equipment design (written primarily for military equip-
ment, but can be used as a guide to develop checklists),
EPRI NP-2360 [13] which is a checklist for mainte-
nance activities in any large-scale system, NUREG-
0700 [14] which is a comprehensive checklist for con-
trol room design, the HSE checklist [15] which deals
with industrial safety and human error, and the numer-
ous checklists for CRT displays and VDUs [16,17].
1.3.1.3 Characterization of the Situation
Apart from the user and the task variables that could
aect system performance, the external environment in
which the system functions can also in¯uence the
human±systeminteractionperformance.Table5pro-
vides a representative checklist for the most commonly
encountered situations for which the system analyst
must obtain answers, and attempt to provide for
these situations in design.
1.3.2 Allocation of Functions
In designing the human±machine interface, once com-
prehensive information about the users and the activ-
ities/tasks these users will perform is known (through
the use of tools presented in the earlier sections), the
speci®c activities and tasks need to be assigned either
to the humans or to the machines. The allocation of
functions is a necessary ®rst step before any further
design of the interface in the human±machine system
can be carried out.
The need for solving the function allocation pro-
blem directly stems from the need to decide the extent
of automation of manufacturing activities. This is so
because, in the present day manufacturing scenario,
the decision to make is no longer whether or not to
automate functions in manufacturing, but to what
extent and how.
The function allocation problem is perhaps as old as
the industrial revolution itself. Fitts' list, conceived in
1951(Table6),wasthe®rstmajoreorttoresolvethe
function allocation problem.
However, while Fitts' list provided fundamental and
generic principles that researchers still follow for
studying function allocation problems, its failure to
provide quantitative criteria for function allocation
resulted in its having little impact on engineering
design practices. The development of practical and
quantitative criteria for allocating functions is com-
pounded by an important issue: unless one can
describe functions in engineering terms, it is impossible
to ascertain if a machine can perform the function;
and, if one can describe human behavior in engineering
terms, it may be possible to design a machine to do the
job better (than the human). But many functions can-
not be completely speci®ed in engineering (numerical)
terms. This implies that those functions that cannot be
speci®ed in engineering terms should be allocated to
humans, with the rest allocated to the machines. In
addition, for the practitioner, function allocation con-
siderations have been limited due to the lack of [19]:
1. Systematic and step-by-step approaches to deci-
sion making during function allocation
2. Systematic and concise data for addressing
issues such as the capability and limitations of
humans and automated equipment, and under
what circumstances one option is preferable
over the other
3. Methodology for symbiotic agents such as man-
ufacturing engineers and ergonomists, to inte-
grate human and machine behaviors
4. Uni®ed theory addressing domain issues such as
roles, authorities, etc
5. Integration of other decision-making criteria
(such as the economics of the situation) so
762 Mital and Pennathur
Copyright © 2000 Marcel Dekker, Inc.
Human Interfaces for Automated Systems 763
Table 4 Example of an Ergonomics Checklist for Equipment Operation
Compromise but
Characteristic Satisfactory acceptable Unsatisfactory
Console shape/size
Desk height, area
Control reach
Display view
Body, limb
clearance
Panel location
Frequency of use
Sequence of use
Emergency response
Multioperator use
Panel layout
Functional grouping
Sequential
organization
Identi®cation
Clearance spacing
Displays
Functional
compatibility for
intended purposes
Intelligibility of
information content
Control interaction
Legibility; ®gures,
pointers, scales
Visibility;
illumination,
parallax
Location
Identi®cation
Controls
Functional
compatibility for
intended purposes
Location, motion
excursion, and force
Display interaction
Spacing, clearance,
size
Identi®cation
Adapted from Ref. 10.
Copyright © 2000 Marcel Dekker, Inc.
that the function allocation decision is not made
in isolation
6. Easily usable tools to simulate dierent con®g-
urations of humans and machines.
In spite of these shortcomings, research on function
allocation has permitted the following general infer-
ences for the practitioner:
1. Function allocation cannot be accomplished
by a formulaÐor example, rules which may
apply in one situation may be irrelevant in
another.
2. Function allocation is not a one-shot deci-
sionÐthe ®nal assignment depends on activ-
ities at the levels of the tasks, the con¯ation
of tasks into jobs, the relationships of jobs
within a larger workgroup, and the likely
changes in the higher level manufacturing pro-
cesses themselves.
3. Function allocation can be systematizedÐit is
clear that there are a number of sequential
steps that can be taken to best allocate func-
tions.
4. Both humans and machines can be good or
bad at certain tasks.
5. Using analogies can facilitate the function
allocation process.
6. Function allocation can be targeted to a spe-
ci®c time frame.
7. Function allocation depends on the nature of
the taskÐit varies based on whether the task is
perceptual, cognitive, or psychomotor.
8. Function allocation decisions must be based
on sound economic analyses of options as
well as the capabilities and limitations of
humans and machines.
9. Human and machine performances are not
always antithetical.
10. Function allocation decisions must consider
technology advances within a given time
frame.
11. In cases where both humans and machines can
perform a function, the system should be
designed in such a way so that humans can
delegate the function to machines, or can
764 Mital and Pennathur
Table 5 Checklist for Situation Analysis
What are the likely situations that
could arise during system use and how
will these aect use of the system?
Equipment Falls short of target performance
Falls short of speci®cation
Fails
Availability Data is missing
Materials are missing
Personnel are missing
Support is missing
Overloads Of people/machines
Of data, information, materials, etc.
Interruptions The process breaks down
Complete restart of process required
Environment Changes: in physical or social
environment
Policy changes Changes in laws, rules, standards and
guidelines
Adapted from Ref. 5.
Table 6 Fitts' List
Humans appear to surpass present-day machines with respect to the following:
Ability to detect small amounts of visual or acoustic energy
Ability to perceive patterns of light or sound
Ability to improvise and use ¯exible procedures
Ability to store very large amounts of information for long periods and to recall relevant facts at the appropriate time
Ability to reason inductively
Ability to exercise judgment
Present-day machines appear to surpass humans with respect to the following:
Ability to respond quickly to control signals, and to apply great force smoothly and precisely
Ability to perform repetitive, routine tasks
Ability to store information brie¯y and then to erase it completely
Ability to reason inductively, including computational ability
Ability to handle complex operations, i.e., to do many dierent things at once
Adapted from Ref. 18.
Copyright © 2000 Marcel Dekker, Inc.
take over the function when circumstances
demand it.
A number of approaches have been suggested in the
literature for solving the function allocation problem.
Some of the promising approaches include function
allocation criteria based on speci®c performance mea-
sures (time required to complete tasks, for example)
[20±24], criteria based on comparison of capabilities
and limitations of humans with particular attention
given to knowledge, skills, and information sources
and channels [25±34] criteria based on economics (allo-
cate the function to the less expensive option),
[21,35,36], and criteria based on safety (to the human
operator in the system) [37±39].
Experiments with these approaches suggest that
functions that are well-proceduralized permitting algo-
rithmic analysis, and requiring little creative input, are
prime candidates for automation. On the other hand,
functions requiring cognitive skills of a higher order,
such as design, planning, monitoring, exception hand-
ling, etc., are functions that are better performed by
humans. The prime requirements for automating any
function are the availability of a model of the activities
necessary for that function, the ability to quantify that
model, and a clear understanding of the associated
control and information requirements. Clearly, there
are some functions that should be performed by
machines because of:
1. Design accuracy and tolerance requirements.
2. The nature of the activity is such that it cannot
be performed by humans.
3. Speed and high production volume require-
ments.
4. Size, force, weight, and volume requirement.
5. Hazardous nature of the activity.
Equally clearly, there are some activities that should be
performed by humans because of:
1. Information-acquisition and decision-making
needs
2. Higher level skill needs such as programming
3. Specialized manipulation, dexterity, and sensing
needs
4. Space limitations (e.g., work that must be done
in narrow and con®ned spaces)
5. Situations involving poor equipment reliability
or where equipment failure could prove
catastrophic
6. Activities for which technology is lacking.
Mital et al. [7] provide a generic methodology in the
form of decision-making ¯owcharts for the systematic
allocation of functions between humans and machines.
Figure7,presentedearlierisapartofthese¯owcharts.
These ¯owcharts are based on the requirements of
complex decision making, on a detailed safety analysis,
and on a comprehensive economic analysis of the alter-
natives. These function allocation ¯owcharts are avail-
able for dierent manufacturing functions such as
assembly, inspection, packaging, shipping, etc., and
should be consulted for a detailed analysis of the ques-
tion of manufacturing function allocation.
1.3.3 Information Presentation and Control
1.3.3.1 The Scienti®c Basis for Information
Input and Processing
Reduced to a fundamental level, human interaction
with automation can be said to be dependent upon
the information processing ability of the human, and
upon the exchange of information among the dierent
elements in a system. Over the years, behavioral scien-
tists have attempted to explain human information
processing through various conceptual models and
theories. One such theory is the information theory
[40] Information, according to information theory, is
de®ned as the reduction of uncertainty. Implicit in
this de®nition is the tenet that events that are highly
certain to occur provide little information; events that
are highly unlikely to occur, on the other hand, pro-
vide more information. Rather than emphasize the
importance of a message in de®ning information,
information theory considers the probability of occur-
rence of a certain event in determining if there is infor-
mation worth considering. For instance, the ``no-
smoking'' sign that appears in airplanes before takeo,
while being an important message, does not convey
much information due to the high likelihood of its
appearance every time an aircraft takes o. On the
other hand, according to information theory, messages
from the crew about emergency landing procedures
when the plane is about to perform an emergency land-
ing convey more information due to the small like-
lihood of such an event. Information is measured in
bits (denoted by H). One bit is de®ned as the amount of
information required to decide between two equally
likely alternatives.
When the dierent alternatives all have the same
probability, the amount of information (H) is given by
H log
2
N
Human Interfaces for Automated Systems 765
Copyright © 2000 Marcel Dekker, Inc.
where N is the number of alternatives. For example,
when an event only has two alternatives associated
with it, and when the two alternatives are equally
likely, by the above equation, the amount of informa-
tion, in bits, is 1.0.
When the alternatives are not equally likely (i.e., the
alternatives have dierent probabilities of occurrence),
the information conveyed by an event is given by
h
i
log
2
1=p
i
where h
i
is the information associated with event i, and
p
i
is the probability of occurrence of event i.
The average information (H
av
conveyed by a series
of events having dierent probabilities is given by
H
av
p
i
log
2
1=p
i
where p
i
is the probability of the event i.
Just as a bit is the amount of information, redun-
dancy is the amount of reduction in information from
the maximum due to the unequal probabilities of
occurrence of events. Redundancy is expressed as a
percentage, and is given by
% Redundancy 1 ÀH
av
=H
max
Â100
Information theory, while providing insight into
measuring information, has major limitations when
applied to human beings. It is valid only for simple
situations which can split into units of information
and coded signals [41]. It does not fully explain the
stimulus-carrying information in situations where
there are more than two alternatives, with dierent
probabilities.
The channel capacity theory, another theory explain-
ing information uptake by humans, is based on the
premise that human sense organs deliver a certain
quantity of information to the input end of a channel,
and that the output from the channel depends upon the
capacity of the channel. It has been determined that if
the input is small, there is very little absorption of it by
the channel, but that if the input rises, it reaches the
threshold channel capacity, beyond which the output
from the channel is no longer a linear function of the
input [41]. Experimental investigations have shown
that humans have a large channel capacity for infor-
mation conveyed to them through the spoken word
than through any other medium. A vocabulary of
2500 words requires a channel capacity of 34 to 42
bits per second [42]. Designers must keep in mind
that in this day and age of information technology,
the central nervous system of humans is subjected to
more information than the information channel can
handle, and that a considerable reduction in the
amount of information must be carried out before
humans process the information.
In addition to theories such as the information
theory and the channel capacity theory that explain
information uptake, many conceptual models of
human information processing have been proposed
byresearchersoverthelastfourdecades.Figure8
shows one such fundamental model (most other
models contain elements of this basic model) depicting
the stages involved in information processing [43]. The
key elements of the model are perception, memory,
decision making, attention, response execution, and
feedback. The following is a brief discussion of each
of these elements.
Perception may involve detection (determining
whether or not a signal is present), or identi®cation
and detection (involving detection and classi®cation).
The theory of signal detection [43±45] through the con-
cept of noise in signals, attempts to explain the process
of perception and response to the perceived signals.
Four possible outcomes are recognized in signal detec-
tion theory: (1) hit (correctly concluding that there is a
signal when there is one), (2) false alarm (concluding
that there is a signal when, in actuality, there is none),
(3) miss (concluding that there is no signal when, in
actuality, there is one and (4) correction rejection (cor-
rectly concluding that there is no signal when there is
none). The fundamental postulate of signal detection
theory is that humans tend to make decisions based on
criteria whose probabilities depend upon the probabil-
ities of the outcomes above. The probability of observ-
ing a signal, and the costs and bene®ts associated with
the four possible outcomes above, determine the
responses of the human to the signal. The resolution
of the human sensory activities (ability to separate the
noise distribution from the distribution of the signal)
has also been found to aect the signal detection cap-
ability of the human.
Memory, in humans, has been conceptualized as
consisting of three processes, namely, sensory storage,
working memory, and long-term memory [43].
According to this conception, information from sen-
sory storage must pass through working memory
before it can be stored in long-term memory. Sensory
storage refers to the short-term memory of the stimu-
lus. Two types of short-term memory storage are well
knownÐiconic storage associated with visual senses,
and echoic storage associated with the auditory senses
[46]. Sensory storage or short-term memory has been
shown to be nearly automatic requiring no sustained
attention on the part of the human to retain it.
766 Mital and Pennathur
Copyright © 2000 Marcel Dekker, Inc.
Information transfer from sensory storage to working
memory is brought about through attention (to the
process). Information from stimuli is believed to be
stored in the working memory primarily in the form
of either visual, phonetic, or semantic codes. It is also
believed that the capacity of working memory is ®ve to
nine chunks of information (similar units regardless of
the size) [47]. Researchers recommend presenting ®ve
to nine meaningful and distinct chunks of information
for improved recall. It has also been determined that
there is a linear relationship between the number of
items in a memorized list and the time required to
search the list of items in the working memory [48].
Also, all items in the working memory are searched
one at a time, even if a match is found early in the
search process. The transfer of information from work-
ing memory to the long-term memory is believed to
take place through semantic coding, i.e., by analyzing,
comparing, and relating information in the working
memory to past stores of knowledge in the long-term
memory [46]. The extent to which information can be
retrieved from long-term memory depends on the
extent of organization of the information in the long-
term memory.
Rational decision making is de®ned as the process
that involves seeking information relevant to the
decision at hand, estimating the probabilities of
various alternatives, and attaching values to the
anticipated alternatives. A number of biases, however,
have been identi®ed to exist among humans that often
makesdecisionmakingirrational.Table7listssomeof
these biases.
Attention is another key factor in¯uencing human
information input and processing. Research has
identi®ed four types of tasks or situations requiring
attention. These are selective attention, focused
attention, divided attention, and sustained attention.
When several information sources are to be monitored
to perform a single task, attention is said to be selective
(e.g., a process control operator scanning several
instrument panels before detecting a deviant value).
Table8providesguidelinesforimprovingperform-
ances in tasks requiring selective attention. When a
human has to focus attention on one source of infor-
mation and exclude all other sources of information
for task performance, attention is said to be focused.
Task performance under focused attention is aected
by the physical proximity of the sources of informa-
tion. While physical proximity enhances performance
in tasks requiring selective attention, it impedes
performance in tasks requiring focused attention.
Table9providesguidelinesforimprovingperform-
ances in tasks requiring focused attention. When
humans do more than one task at a time, their atten-
Human Interfaces for Automated Systems 767
Figure 8 Fundamental model of human information processing.
Copyright © 2000 Marcel Dekker, Inc.
tion is said to be divided (among the tasks). While
much of the theoretical base for explaining perform-
ance of tasks requiring divided attention is still evol-
ving [43,49], some guidelines for designing tasks that
require divided attention are available, and are pro-
videdinTable10.Whenhumansmaintainattention
and remain vigilant to external stimuli over prolonged
periods of time, attention is said to be sustained.
Nearly four decades of research in vigilance and vigi-
lance decrement [50±53] has provided guidelines for
improving performance in tasks requiring sustained
attention(Table11).
In addition to the factors discussed above, consider-
able attention is being paid to the concept of mental
workload (which is but an extension of divided atten-
tion). Reviews of mental workload measurement tech-
niques are available [54±56], and should be consulted
for discussions of the methodologies involved in men-
tal workload assessment.
1.3.3.2 The Scienti®c Basis for Human Control
of Systems
Humans respond to information and take controlling
actions. The controlling actions of the human are
mediated through the motor system in the human
body. The human skeletal system, the muscles, and
the nervous system help bring into play motor skills
that enable the human to respond to stimuli. Motor
skill is defned as ``ability to use the correct muscles
with the exact force necessary to perform the desired
response with proper sequence and timing'' [57]. In
addition, skilled performance requires adjusting to
changing environmental conditions, and acting con-
sistently from situation to situation [58]. A number
of dierent types of human movements have been
recognized in the literature [46]. These include discrete
movements (involving a single reaching movement to a
target that is stationary), repetitive movements (a
single movement is repeated), sequential movements
768 Mital and Pennathur
Table 7 Common Human Biases
Humans attach more importance to early information than subsequent information.
Humans generally do not optimally extract information from sources.
Humans do not optimally assess subjective odds of alternative scenarios.
Humans have a tendency to become more con®dent in their decisions with more information, but do not necessarily become
more accurate.
Humans tend to seek more information than they can absorb.
Humans generally treat all information as equally reliable.
Humans seem to have a limited ability to evaluate a maximum of more than three or four hypotheses at a time.
Humans tend to focus only on a few critical factors at a time and consider only a few possible choices related to these critical
factors.
Humans tend to seek information that con®rms their choice of action than information that contradicts or discon®rms their
action.
Human view a potential loss more seriously than a potential gain.
Humans tend to believe that mildly positive outcomes are more likely than mildly negative or highly positive outcomes.
Humans tend to believe that highly negative outcomes are less likely than mildly negative outcomes.
Adapted from Ref. 43.
Table 8 Recommendations for Designing Tasks Requiring Selective Attention
Use as few signal channels as possible, even if it means increasing the signal rate per channel.
Inform the human the relative importance of various channels for eective direction of attention.
Reduce stress levels on human so more channels can be monitored.
Inform the human beforehand where signals will occur in future.
Train the human to develop optimal scan patterns.
Reduce scanning requirements on the human by putting multiple visual information sources close to each other, and by making
sure that multiple sources of auditory information do not mask each other.
Provide signal for a sucient length of time for individual to respond; where possible, provide for human control of signal rate.
Adapted from Ref. 46.
Copyright © 2000 Marcel Dekker, Inc.
(a number of discrete movements to stationary
targets), continuous movements (involving muscular
control adjustments during movement), and static
positioning (maintaining a speci®c position of a body
member for a speci®ed period of time). In addition,
certain theoretical models of human motor responses
explain the control aspects of human responses based
on only two fundamental types of movementsÐfast
and slow. Closed-loop theories [59,60], whether the
movement be fast or slow, use the concept of sensory
feedback (sensory information available during or
after the motor response) to explain motor responses
(to correct/reduce errors obtained through feedback).
The sensory receptors for feedback and feedforward
(sensory information available prior to the action
that regulates and triggers responses), are believed to
be located in the muscle spindles (for sensing the
muscle length and the rate of change of length)
[58,61], tendons (the Golgi tendons inhibit muscle
contraction and regulate muscle action), joints (the
tension in the joints in¯uences the generation of
nerve impulses), cutaneous tissue (skin is believed to
have receptors that aect joint movement), and the
eyes (important for timing of responses) [62]. Open-
loop theories, on the other hand, are based on the
belief that there are higher-level structured motor
programs containing information necessary for
patterning the dierent movements [63,64]. Dierent
de®ciencies, such as the error of selection (where a
person calls the wrong motor program for a control-
ling action) and the error of execution (where the
correct motor program fails during execution of
controlling actions) have been identi®ed with motor
programs [65]. Much of the development in under-
standing human controlling actions in response to
stimuli is still in its infancy, but has important practical
consequences (how to improve skilled performance,
for example).
The time it takes for the human to respond to stimuli
is another critical factor that has been studied exten-
sively in the literature [46]. An understanding of
response time of the human is essential for good design
of the tasks involved in human interaction with auto-
mated systems. Response time is, in general, composed
of reaction time, and movement time. Reaction time is
de®ned as the time from the signal onset calling for a
response, to the beginning of the response. Simple reac-
tion time (reaction time in the presence of a single
source of stimulus) has been shown to be between
0.15 sec and 0.20 sec. The mode through which the
single stimulus occurs (visual, auditory etc.,) the
detectability of the stimulus (intensity, duration, and
size), the frequency, the preparedness (of the human
for the stimulus), the age, and the location of the
stimulus (location in the peripheral ®eld of view, for
instance) are among the factors that have been shown
to aect simple reaction time. Choice reaction time
(reaction time in the presence of one of several possible
stimuli each with dierent possible responses), is a
function of the probability of a stimulus occurring,
i.e., the reaction time is faster for events with greater
probability. It has been shown to increase by about
0.15 sec for each doubling of the number of possible
Human Interfaces for Automated Systems 769
Table 9 Recommendations for Designing Tasks Requiring
Focused Attention
Make the dierent channels of information as distinct as
possible from the channel to which the human must
attend.
Physically separate the channel of interest from the other
channels.
Reduce the number of competing channels.
Make the channel of interest prominent by making it larger
in size, or brighter, or louder, or by locating it centrally.
Adapted from Ref. 46.
Table 10 Recommendations for Designing Tasks Requiring
Divided Attention
Minimize the potential sources of information.
Provide human with a relative priority of tasks to optimize
the strategy of divided attention.
Keep the level of diculty of tasks low.
Make tasks as dissimilar as possible in terms of task demands
on the human.
Adapted from Ref. 46.
Table 11 Recommendations for Designing Tasks Requiring
Sustained Attention
Provide appropriate work±rest schedules.
Provide task variation by interpolating dierent activities.
Make the signal larger, and/or more intense, and/or longer in
duration, and/or distinct.
Reduce uncertainty in time and place of occurrence of signal.
Use arti®cial signals and provide feedback to humans on
their performance.
Reduce the rate of presentation of stimuli if it is high.
Provide optimal environmental conditions such as lighting,
noise level, etc.
Provide adequate training to humans to clarify the nature of
signals to be identi®ed.
Copyright © 2000 Marcel Dekker, Inc.
alternative stimuli [66]. Choice reaction time has been
shown to be in¯uenced by a numerous factors, includ-
ing the degree of compatibility between stimuli and
responses, practice, presence or absence of a warning
signal, the type and complexity of the movement
involved in the responses, and whether or not more
than one stimulus is present in the signal. Movement
time is defned as the time from the beginning of the
response to its completion. It is the time required to
physically make the response to the stimulus.
Movements based on pivoting about the elbow have
been shown to take less time, and have more accuracy,
than movements based on upper-arm and shoulder
action. Also, it has been determined that movement
time is a logarithmic function of distance of movement,
when target size is a constant, and further that move-
ment time is a logarithmic function of target size, when
the distance of movement is constant. This ®nding is
popularly known as Fitts' law [67], and is represented
as
MT a b log
2
2D=W
where MT is the movement time, a and b are empirical
constants dependent upon the type of movement, D is
the distance of movement from start to the center of
the target, and W is the width of the target.
Human response to stimuli is not only dependent
upon the speed of the response, but also on the
accuracy of the response. The accuracy of the human
response assumes special importance when the
response has to be made in situations where there is
no visual feedback (a situation referred to as ``blind
positioning''). Movements that take place in a blind
positioning situation have been determined to be
more accurate when the target is located dead-ahead
than when located on the sides. Also, targets below the
shoulder height and the waist level are more readily
reachable than targets located above the shoulder or
the head [68]. The distance and speed of movement
have also been found to in¯uence the accuracy of the
response [69,70].
1.3.3.3 Displays
Types of Displays. A display is de®ned as any indirect
means of presenting information. Displays are gener-
ally one of the following four types: visual, auditory,
tactual, and olfactory. The visual and the auditory
modes of displaying information are the most
common. Displays based on tactile and olfactory
senses are mostly used for special task or user
situations (e.g., for the hearing impaired).
Selecting the mode of display whether it should be
visual or auditory in nature) is an important factor due
to the relative advantages and disadvantages certain
modes of display may have over other modes, for spe-
ci®c types of task situations (auditory mode is better
than visual displays in vigilance), environment (light-
ing conditions), or user characteristics (person's infor-
mation handling capacity). Table 12 provides general
guidelines for deciding between two common modes of
information presentation, namely, auditory and visual.
The types of displays to use to present information
also depend on the type of information to present.
Dierent types of information can be presented using
displays when the sensing mode is indirect.
Information can either be dynamic or static.
Dynamic information is categorized by changes
occurnng in time (e.g., fuel gage). Static information,
770 Mital and Pennathur
Table 12 Guidelines for Deciding When to Use Visual
Displays and When to Use Auditory Displays
Visual Auditory
Characteristics displays displays
Message characteristics
Simple message
p
Complex message
p
Short message
p
Long message
p
Potential reference
value of message
High
p
Low
p
Immediacy of action
requirement of message
High
p
Low
p
Message deals with
p
events in time
Message deals with
p
locations in space
Human capability
Auditory system
p
overburdened
Visual system
p
overburdened
Environmental factors
Location too bright or
p
too dark requiring
signi®cant adaptation
Location too noisy
p
Adapted for Ref. 71.
Copyright © 2000 Marcel Dekker, Inc.
on the other hand, does not change with time (e.g.,
printed safety signs). A number of other types of infor-
mation are also recognized in the literature. Table 13
provides a list of these types along with a brief descrip-
tion of the characteristics of these types of information.
In the following sections, we discuss recommenda-
tions for the design of dierent types of visual and
auditory displays (we restrict our attention in this
chapter only to these two common modes). We ®rst
provide a brief discussion of the dierent factors aect-
ing human visual and auditory capabilities. We then
present speci®c display design issues and recommenda-
tions for these two broad types of displays.
Visual displays: factors affecting design. Accommo-
dation refers to the ability of the lens in the eye to focus
the light rays on the retina. The distance (of the target
object from the eye) at which the image of the object
becomes blurred, and the eye is not able to focus the
image any further, is called the near point. There is
also a far point (in®nity, in normal vision) beyond
which the eye cannot clearly focus. Focal distances
are measured in diopters. One diopter is 1/(distance
of the target in meters). Inadequate accommodation
capacity of the eyes result either in nearsightedness
(the far point is too close) or in farsightedness (the
near point is too close). Literature recommends an
average focusing distance of 800 mm at the resting
position of the eye (also known as the resting accom-
modation) [72]. Due to changes in the iris (which con-
trols the shape of the lens), aging results in substantial
receding of the near point, the far point remaining
unchangedorbecomingshorter.Figure9showshow
the mean near point recedes with age. It is recom-
mended that the designer use this information when
designing visual displays.
Visual acuity is de®ned as the ability of the eye to
separate ®ne detail. The minimum separable acuity
refers to the smallest feature that the eye can detect.
Visual acuity is measured by the reciprocal of the
visual angle subtended at the eye by the smallest detail
that the eye can distinguish. Visual angle (for angles
less than 108) is given by
Visual angle in minutes3438H=D
where H is the height of the stimulus detail, and D is
the distance from the eye, both H and D measured in
the same units of distance. Besides minimum separable
visual acuity, there are other types of visual acuity
measure, such as vernier acuity (ability to dierentiate
lateral displacements), minimum perceptible acuity
(ability to detect a spot from its background), and
stereoscopic acuity (ability to dierentiate depth in a
single object). In general, an individual is considered to
have normal visual acuity if he or she is able to resolve
a separation between two signs 1
H
of arc wide. Visual
acuity has been found to increase with increasing levels
of illumination. Luckiesh and Moss [73] showed that
increasing the illumination level from approximately
10 l to 100 l increased the visual acuity from 100
to 130%, and increasing the illumination level from
approximately 10 l to 1000 l increased the visual
acuity from 100 to 170%. For provision of maximum
visual acuity, it is recommended that the illumination
level in the work area be 1000 lÂ. Providing adequate
contrast between the object being viewed and the
immediate background, and making the signs and
Human Interfaces for Automated Systems 771
Table 13 Commonly Found Types of Information and Their Characteristics
Type of information Characteristics
Quantitative information Information on the quantitative value of a variable
Qualitative information Information on the approximate value, trend, rate of change, direction of change, or other
similar aspects of a changeable variable
Status information Information on the status of a system, information on a one of a limited number of conditions,
and information on independent conditions of some class
Warning and signal Information on emergency or unsafe conditions, information on presence or absence of some
information conditions
Representational Pictorial or graphic representations of objects, areas, or other con®gurations
information
Identi®cation information Information in coded form to identify static condition, situation, or object
Alphanumeric and Information of verbal, numerical, and related coded information in other forms such as
Symbolic information signs, labels, placards, instructions, etc.
Time-phased information Information about pulsed or time-phased signals
Adapted from Ref. 46.
Copyright © 2000 Marcel Dekker, Inc.
characters (in the object being viewed) sharp, will also
increase visual acuity. The general recommendation is
to use dark symbols and characters on a bright back-
ground than vice versa, as the former increases the
visual acuity. Visual acuity has also been shown to
decrease with age [74]. Figure 10 illustrates how visual
acuity decreases with age.
Contrast sensitivity is another factor that has impli-
cations for design of the interface. It is the ability of the
eye to dierentiate lightness between black and white.
Contrast sensitivity is generally expressed as the
reciprocal of the threshold contrast, where the
threshold contrast is the level of contrast that just
stops short of making the colors appear homogeneous.
Other measures for contrast sensitivity include
modulation contrast computed as
C L
max
À L
min
=L
max
L
min
where L
max
and L
min
are the maximum and the mini-
mum luminances in the pattern. The literature provides
certain general rules to follow when designing displays
in order to provide the best possible contrast
sensitivity. Since contrast sensitivity is greater for
larger areas, it is recommended that the viewing area
be made as large as possible. Also, making the object
boundaries sharper will increase contrast sensitivity.
The surrounding luminance, and the intensity of light
(or the level of illumination), have been shown to have
an eect on contrast sensitivity. Contrast sensitivity
772 Mital and Pennathur
Figure 9 Effect of age on near point for visual accomodation.
Figure 10 Effect of age on visual acuity.
Copyright © 2000 Marcel Dekker, Inc.
has been determined to be the largest when
the surrounding luminance is within the range of
70 cd/m
2
, and more than 1000 cd/m
2
[75]. Also,
Luckiesh and Moss [73] showed that increasing the
illumination level from approximately 10 l to
100 1Â increased the contrast sensitivity from 100 to
280%, and increasing the illumination level from
approximately 10 l to 1000 l increased the contrast
sensitivity from 100 to 450%. The literature [41] also
recommends that the background be at least 2%
brighter or darker than the target for optimal contrast
sensitivity. As brie¯y described above, visual acuity
and contrast sensitivity are aected by a number of
factor, such as luminance level (in general, the higher
the luminance, the more the visual acuity and contrast
sensitivity), contrast, exposure time, motion of the
target, age (there is a decline in both visual acuity
and contrast sensitivity with age), and training
(through surgery of the eye or through corrective
lenses, etc.).
Adaptation is another factor that aects the visual
capability of the human eye. It is de®ned as the
changes in the sensitivity of the eye to light. A mea-
sure of adaptation is the time it takes for the eye to
adapt to light or dark. It has been found that, in
general, adaptation to light occurs more quickly than
adaptation to the dark. Darkness adaptation has
been found to be quick in the ®rst 5 min of expo-
sure; nearly 80% of the adaptation to darkness has
been shown to take about 25 min with full adapta-
tion taking as much as one full hour [41].
Adaptation can also be partial (depending on
whether the visual ®eld contains a dark or a bright
area), and can aect the sensitivity of the retina and
the vision. For optimal adaptation, the overall
recommendation is to provide the same order of
brightness on all important surfaces, and provide a
stable and non¯uctuating levels of illumination. It is
also important to avoid the eects of glare (which is
a process of overloading the adaptation processes of
the eye). This can be achieved by avoiding excessive
brightness contrasts, avoiding excessive brightness in
the light source, and providing for transient
adaptation.
The ability of the eye to discriminate between dif-
ferent colors is called color discrimination. Color dis-
crimination de®ciency is due to the reduced sensitivity
of the particular (to a color) cone receptors. While it is
dicult to measure precisely the type and degree of a
person's color de®ciency, it is important from the
perspective of designing tasks which require perception
of colored targets for task performance.
The ability to read, and the ability to perceive mean-
ing, are the other key factors that have to be accounted
for when designing visual displays.
Design recommendations for visual displays. As
already mentioned, visual displays are classi®ed on
the basis of the type of information they present to
the user. Information presented to the user can be
static or dynamic in nature. Display of dynamic infor-
mation will require capture of the changing nature of
the information (for example, continuous changes in
speed indicated by the tachometer in the car). Static
displays do not display, in real time, the changes in the
information content in time. (Note that, in static dis-
plays, the displays themselves do not change with time.
However, static displays can be used to present, in the
form of graphs, for example, changes in information
content over time, after the event has occurred; static
displays do not provide information in real time.)
Almost all dynamic visual displays contain elements
of one of the more fundamental forms of static infor-
mation displays, namely, textual information, informa-
tion in the form of graphical displays, information in
some coded form, or symbolic information. In the fol-
lowing sections, we ®rst brie¯y present recommenda-
tions on design of these four forms of static visual
displays. We then provide guidelines on designing
dynamic information displays.
Static visual displays. The literature distinguishes
between two forms of textual displaysÐtextual
displays in hardcopy format, and textual displays in
visual display terminals or computer screens [46].
While there are differences in performance based on
whether the display is in hardcopy form or in a visual
display unit, there are three essential characteristics of
any display in the form of text; the textual display
should be visible, legible, and readable. Visibility of
the text refers to the characteristic that makes a
character or a symbol distinguishable and separate
from its surroundings. Legibility of the text refers to
the characteristic of alphanumeric characters that
makes it possible to identify one character from the
other. The stroke width, the character format, con-
trast, illumination etc., in¯uence the legibility of the
text. Readability of the text refers to the characteristic
of alphanumeric characters that enables organization
of the content into meaningful groups (of information)
such as words and sentences.
Various factors in¯uence the visibility, the legibility,
and the readability of textual information presented in
hardcopy form. They are typography, size, case,
layout, and reading ease.
Human Interfaces for Automated Systems 773
Copyright © 2000 Marcel Dekker, Inc.