Risk and Return ppsx
Bạn đang xem bản rút gọn của tài liệu. Xem và tải ngay bản đầy đủ của tài liệu tại đây (96.15 KB, 11 trang )
CHAPTER 8
Risk and Return
Answers to Practice Questions
1. a. False – investors demand higher expected rates of return on stocks with
more nondiversifiable risk.
b. False – a security with a beta of zero will offer the risk-free rate of return.
c. False – the beta will be: (1/3)×(0) + (2/3)×(1) = 0.67
d. True.
e. True.
2. In the following solution, security one is Coca-Cola and security two is Reebok.
Then:
r
1
= 0.10 σ
1
= 0.315
r
2
= 0.20 σ
2
= 0.585
Further, we know that for a two-security portfolio:
r
p
= x
1
r
1
+ x
2
r
2
σ
p
2
= x
1
2
σ
1
2
+ 2x
1
x
2
σ
1
σ
2
ρ
12
+ x
2
2
σ
2
2
Therefore, we have the following results:
x
1
x
2
r
p
σ
p1
when ρ = 0
σ
p1
when ρ = 1
σ
p1
when ρ = -1
1.0 0.0 0.10 0.315 0.315 0.315
0.9 0.1 0.11 0.289 0.342 0.225
0.8 0.2 0.12 0.278 0.369 0.135
0.7 0.3 0.13 0.282 0.396 0.045
0.6 0.4 0.14 0.301 0.423 0.045
0.5 0.5 0.15 0.332 0.450 0.135
0.4 0.6 0.16 0.373 0.477 0.225
0.3 0.7 0.17 0.420 0.504 0.315
0.2 0.8 0.18 0.472 0.531 0.405
0.1 0.9 0.19 0.527 0.558 0.495
0.0 0.0 0.20 0.585 0.585 0.585
71
72
Correlation = 0
0.0%
5.0%
10.0%
15.0%
20.0%
25.0%
0.0% 20.0% 40.0% 60.0% 80.0%
Standard Deviation
Expect ed Ret urn
Correlation = 1
0.0%
5.0%
10.0%
15.0%
20.0%
25.0%
0.0% 20.0% 40.0% 60.0% 80.0%
Standard Deviation
Expect ed Ret urn
Correlation = -1
0.0%
5.0%
10.0%
15.0%
20.0%
25.0%
0.0% 20.0% 40.0% 60.0% 80.0%
Standard Deviation
Expect ed Ret urn
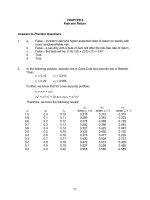
3. a.
Portfolio r
σ
1 10.0% 5.1%
2 9.0 4.6
3 11.0 6.4
b. See the figure below. The set of portfolios is represented by the curved
line. The five points are the three portfolios from Part (a) plus the two
following two portfolios: one consists of 100% invested in X and the other
consists of 100% invested in Y.
c. See the figure below. The best opportunities lie along the straight line.
From the diagram, the optimal portfolio of risky assets is portfolio 1, and
so Mr. Harrywitz should invest 50 percent in X and 50 percent in Y +
4. a. Expected return = (0.6 × 15) + (0.4 × 20) = 17%
Variance = (0.6)
2
×(20)
2
+ (0.4)
2
× (22)
2
+ 2(0.6)(0.4)(0.5)(20)(22) = 327
Standard deviation = (327)
(1/2)
= 18.1%
b. Correlation coefficient = 0 ⇒ Standard deviation = 14.9%
Correlation coefficient = -0.5 ⇒ Standard deviation = 10.8%
c. His portfolio is better. The portfolio has a higher expected return and a
lower standard deviation.
73
0
0.05
0.1
0.15
0
0.02
0.04
0.06
0.08
0.1
Standard Deviation
Expected Return
5. Internet exercise; answers will vary depending on time period.
6. Internet exercise; answers will vary depending on time period.
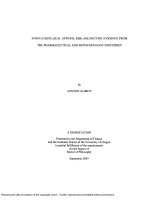
7. a.
b. Market risk premium = r
m
- r
f
= 0.12 - 0.04 = 0.08 = 8.0%
c. Use the security market line:
r = r
f
+ β(r
m
- r
f
)
r = 0.04 + [1.5×(0.12 - 0.04)] = 0.16 = 16.0%
d. For any investment, we can find the opportunity cost of capital using the
security market line. With β = 0.8, the opportunity cost of capital is:
r = r
f
+ β(r
m
- r
f
)
r = 0.04 + [0.8×(0.12 - 0.04)] = 0.104 = 10.4%
The opportunity cost of capital is 10.4 percent and the investment is
expected to earn 9.8 percent. Therefore, the investment has a negative
NPV.
e. Again, we use the security market line:
r = r
f
+ β(r
m
- r
f
)
0.112 = 0.04 + β(0.12 - 0.04) ⇒ β = 0.9
8. Internet exercise; answers will vary depending on time period.
9. Internet exercise; answers will vary.
74
0
5
10
15
20
0 0.5 1 1.5 2
Beta
Expected Ret urn
10. a. Percival’s current portfolio provides an expected return of 9 percent with
an annual standard deviation of 10 percent. First we find the portfolio
weights for a combination of Treasury bills (security 1: standard deviation
= 0 percent) and the index fund (security 2: standard deviation = 16
percent) such that portfolio standard deviation is 10 percent. In general,
for a two security portfolio:
σ
P
2
= x
1
2
σ
1
2
+ 2x
1
x
2
σ
1
σ
2
ρ
12
+ x
2
2
σ
2
2
(0.10)
2
= 0 + 0 + x
2
2
(0.16)
2
x
2
= 0.625 ⇒ x
1
= 0.375
Further:
r
p
= x
1
r
1
+ x
2
r
2
r
p
= (0.375 × 0.06) + (0.625 × 0.14) = 0.11 = 11.0%
Therefore, he can improve his expected rate of return without changing
the risk of his portfolio.
b. With equal amounts in the corporate bond portfolio (security 1) and the
index fund (security 2), the expected return is:
r
p
= x
1
r
1
+ x
2
r
2
r
p
= (0.5 × 0.09) + (0.5 × 0.14) = 0.115 = 11.5%
σ
P
2
= x
1
2
σ
1
2
+ 2x
1
x
2
σ
1
σ
2
ρ
12
+ x
2
2
σ
2
2
σ
P
2
= (0.5)
2
(0.10)
2
+ 2(0.5)(0.5)(0.10)(0.16)(0.10) + (0.5)
2
(0.16)
2
σ
P
2
= 0.0097
σ
P
= 0.985 = 9.85%
Therefore, he can do even better by investing equal amounts in the
corporate bond portfolio and the index fund. His expected return
increases to 11.5% and the standard deviation of his portfolio decreases
to 9.85%.
11. No. Every stock has unique risk in addition to market risk. The unique risk reflects
uncertain events that are unrelated to the return on the market portfolio. The
Capital Asset Pricing Model does not predict these events. If the events are
favorable, the stock will do better than the model predicts. If the events are
unfavorable, the stock will do worse.
12. a. True
b. True
c. True
75
13. a. True. By definition, the factors represent macro-economic risks that
cannot be eliminated by diversification.
b. False. The APT does not specify the factors.
c. True. Investors will not take on nondiversifiable risk unless it entails a
positive risk premium.
d. True. Different researchers have proposed and empirically investigated
different factors, but there is no widely accepted theory as to what these
factors should be.
e. True. To be useful, we must be able to estimate the relevant parameters.
If this is impossible, for whatever reason, the model itself will be of
theoretical interest only.
14. For Stock P ⇒ r = (1.0)×(6.4%) + (-2.0)×(-0.6%) + (-0.2)×(5.1%) = 6.58%
For Stock P
2
⇒ r = (1.2)×(6.4%) + (0)×(-0.6%) + (0.3)×(5.1%) = 9.21%
For Stock P
3
⇒ r = (0.3)×(6.4%) + (0.5)×(-0.6%) + (1.0)×(5.1%) = 6.72%
15. a. Factor risk exposures:
b
1
(Market) = (1/3)×(1.0) + (1/3)×(1.2) + (1/3)×(0.3) = 0.83
b
2
(Interest rate) = (1/3)×(-2.0) +(1/3)×(0) + (1/3)×(0.5) = -0.50
b
3
(Yield spread) = (1/3)×(-0.2) + (1/3)×(0.3) + (1/3)×(1.0) = 0.37
b. r
P
= (0.83)×(6.4%) + (-0.50)×(-0.6%) + (0.37)×(5.1%) = 7.5%
16. r
CC
= 3.5% + (0.82 × 8.8%) + (-0.29 × 3.1%) + (0.24 × 4.4%) = 10.87%
r
XON
= 3.5% + (0.50 × 8.8%) + (0.04 × 3.1%) + (0.27 × 4.4%) = 9.21%
r
P
= 3.5% + (0.66 × 8.8%) + (-0.56 × 3.1%) + (-0.07 × 4.4%) = 7.26%
r
R
= 3.5% + (1.17 × 8.8%) + (0.73 × 3.1%) + (1.14 × 4.4%) = 21.08%
76
Challenge Questions
1. [NOTE: In the first printing of the seventh edition of the text, footnote 4 states
that, for the minimum risk portfolio, the investment in Reebok is 21.4%. This
figure is incorrect. The correct figure is 16.96%, as shown below.]
In general, for a two-security portfolio:
σ
p
2
= x
1
2
σ
1
2
+ 2x
1
x
2
σ
1
σ
2
ρ
12
+ x
2
2
σ
2
2
and:
x
1
+ x
2
= 1
Substituting for x
2
in terms of x
1
and rearranging:
σ
p
2
= σ
1
2
x
1
2
+ 2σ
1
σ
2
ρ
12
(x
1
- x
1
2
) + σ
2
2
(1 - x
1
)
2
Taking the derivative of σ
p
2
with respect to x
1
, setting the derivative equal to zero
and rearranging:
x
1
(σ
1
2
- 2σ
1
σ
2
ρ
12
+ σ
2
2
) + (σ
1
σ
2
ρ
12
- σ
2
2
) = 0
Let Coca-Cola be security one (σ
1
= 0.315) and Reebok be security two
(σ
2
= 0.585). Substituting these numbers, along with ρ
12
= 0.2, we have:
x
1
= 0.8304
Therefore:
x
2
= 0.1696
2. a. The ratio (expected risk premium/standard deviation) for each of the four
portfolios is as follows:
Portfolio A: (34.6 – 10.0)/110.6 = 0.222
Portfolio B: (21.6 – 10.0)/30.8 = 0.377
Portfolio C: (19.0 – 10.0)/23.7 = 0.380
Portfolio D: (13.4 – 10.0)/14.6 = 0.233
Therefore, an investor should hold Portfolio C.
77
b. The beta for Amazon relative to Portfolio C is equal to the ratio of the risk
premium of Amazon to the risk premium of the portfolio times the beta of
the portfolio:
[(34.6% - 10.0%)/(19% - 10%)] × 1.0 = 2.733
Similarly, the betas for the remainder of the holdings are as follows:
β
Amazon
= 2.733
β
Boeing
= 0.333
β
Dell
= 1.800
β
EX-M
= 0.200
β
GE
= 0.889
β
McD
= 0.444
β
Pfizer
= 0.533
β
Reebok
= 1.111
c. If the interest rate is 5%, then Portfolio C remains the optimal portfolio, as
indicated by the following calculations:
Portfolio A: (34.6 – 5.0)/110.6 = 0.268
Portfolio B: (21.6 – 5.0)/30.8 = 0.539
Portfolio C: (19.0 – 5.0)/23.7 = 0.591
Portfolio D: (13.4 – 5.0)/14.6 = 0.575
The betas for the holdings in Portfolio C become:
β
Amazon
= 2.114
β
Boeing
= 0.571
β
Dell
= 1.514
β
EX-M
= 0.486
β
GE
= 0.929
β
McD
= 0.643
β
Pfizer
= 0.700
β
Reebok
= 1.071
78
3 Whether the APT can be used to make money is a question related to competition in
the financial markets. Given sufficient competition, no widely-known model will
provide an advantage (i.e., enable someone to make a return above that
expected, given the level of risk undertaken). So, whether an economic model
enables one to make money is not relevant to the validity of that model. To put
this somewhat differently, the validity of an economic model hinges on whether
the model enables us to better identify and understand relationships among key
parameters, not whether the model can be used to make money.
4. Let r
x
be the risk premium on investment X, let x
x
be the portfolio weight of X (and
similarly for Investments Y and Z, respectively).
a. r
x
= (1.75)×(0.04) + (0.25)×(0.08) = 0.09 = 9.0%
r
y
= (-1.00)×(0.04) + (2.00)×(0.08) = 0.12 = 12.0%
r
z
= (2.00)×(0.04) + (1.00)×(0.08) = 0.16 = 16.0%
b. This portfolio has the following portfolio weights:
x
x
= 200/(200 + 50 - 150) = 2.0
x
y
= 50/(200 + 50 - 150) = 0.5
x
z
= -150/(200 + 50 - 150) = -1.5
The portfolio’s sensitivities to the factors are:
Factor 1: (2.0)×(1.75) + (0.5)×(-1.00) – (1.5)×(2.00) = 0
Factor 2: (2.0)×(0.25) + (0.5)×(2.00) – (1.5)×(1.00) = 0
Because the sensitivities are both zero, the expected risk premium is zero.
c. This portfolio has the following portfolio weights:
x
x
= 80/(80 + 60 - 40) = 0.8
x
y
= 60/(80 + 60 - 40) = 0.6
x
z
= -40/(80 + 60 - 40) = -0.4
The sensitivities of this portfolio to the factors are:
Factor 1: (0.8)×(1.75) + (0.6)×(-1.00) – (0.4)×(2.00) = 0
Factor 2: (0.8)×(0.25) + (0.6)×(2.00) – (0.4)×(1.00) = 1.0
The expected risk premium for this portfolio is equal to the expected risk
premium for the second factor, or 8 percent.
79
d. This portfolio has the following portfolio weights:
x
x
= 160/(160 + 20 - 80) = 1.6
x
y
= 20/(160 + 20 - 80 ) = 0.2
x
z
= -80/(160 + 20 - 80) = -0.8
The sensitivities of this portfolio to the factors are:
Factor 1: (1.6)×(1.75) + (0.2)×(-1.00) - (0.8)×(2.00) = 1.0
Factor 2: (1.6)×(0.25) + (0.2)×(2.00) – (0.8)×(1.00) = 0
The expected risk premium for this portfolio is equal to the expected risk
premium for the first factor, or 4 percent.
e. The sensitivity requirement can be expressed as:
Factor 1: (x
x
)(1.75) + (x
y
)(-1.00) + (x
z
)(2.00) = 0.5
In addition, we know that:
x
x
+ x
y
+ x
z
= 1
With two linear equations in three variables, there is an infinite number of
solutions. Two of these are:
1. x
x
= 0 x
y
= 0.5 x
z
= 0.5
2. x
x
= (6/11) x
y
= (5/11) x
z
= 0
The risk premiums for these two funds are:
r
1
= 0×[(1.75 × 0.04) + (0.25 × 0.08)]
+ (0.5)×[(-1.00 × 0.04) + (2.00 × 0.08)]
+ (0.5)×[(2.00 × 0.04) + (1.00 × 0.08)] = 0.14 = 14.0%
r
2
= (6/11)×[(1.75 × 0.04) + (0.25 × 0.08)]
+(5/11)×[(-1.00 × 0.04) + (2.00 × 0.08)]
+0 × [(2.00 × 0.04) + (1.00 × 0.08)] = 0.104 = 10.4%
These risk premiums differ because, while each fund has a sensitivity of
0.5 to factor 1, they differ in their sensitivities to factor 2.
80
f. Because the sensitivities to the two factors are the same as in Part (b),
one portfolio with zero sensitivity to each factor is given by:
x
x
= 2.0 x
y
= 0.5 x
z
= -1.5
The risk premium for this portfolio is:
(2.0)×(0.08) + (0.5)×(0.14) – (1.5)×(0.16) = -0.01
Because this is an example of a portfolio with zero sensitivity to each
factor and a nonzero risk premium, it is clear that the Arbitrage Pricing
Theory does not hold in this case.
A portfolio with a positive risk premium is:
x
x
= -2.0 x
y
= -0.5 x
z
= 1.5
81