Essentials of Clinical Research - part 2 doc
Bạn đang xem bản rút gọn của tài liệu. Xem và tải ngay bản đầy đủ của tài liệu tại đây (317.78 KB, 36 trang )
26 S.P. Glasser
more appropriate when studies are used to detect rare or late consequences of
interventions.
Discussion
One should now be able to begin to understand the key differences, and therefore
limitations, of each study design; and, circumstances where one design might be
preferable to another. Let’s, for example, use the exposure of electromagnetic
energy (EME) and cancer outcome (e.g. leukemia). With a cross-sectional study, a
population is identified (target population), cancer rates determined, and exposure
and lack of exposure to EME is ascertained in a sample. One then analyzes the
exposure rates in subjects with cancer and those that are cancer free. If the cancer
rate is higher in those who were exposed, an association is implied. This would be
a relatively inexpensive way to begin to look at the possible association of these
variables, but limitations should be obvious. For example, since there is no tempo-
rality in this type of design, and since biologically, exposure to EME if it did cause
cancer would likely have to occur over a long period of time, one could easily miss
an association.
In summary, it should be evident that observational studies (e.g. cross-sectional,
case-control, and cohort studies) have a major role in research. However, despite their
important role, von Elm et al. discussed the lack of important information that was
either missing or unclear in prior published observational studies; and why this lack
of information lead to a guideline document for reporting observational studies (the
STROBE statement – the Strengthening and Reporting of Observational Studies in
Epidemiology). The STROBE statement was designed after the CONSORT – the
Consolidated Standards of Reporting Trials –; this statement outlines the guidelines
for reporting RCTs. The STROBE statement is a checklist of 22 items that are to be
considered essential for good reporting of observational studies.
9
References
1. Parker_Palmer. />2. Vickers AJ. Michael Jordan won’t accept the null hypothesis: notes on interpreting high P val-
ues. Medscape. 2006; 7(1).
3. The Null Logic of Hypothesis Testing. />4. Blackstone. Cited in The Null Logic of Hypothesis Testing. 2 Bl. Com. C. 27, margin page 358,
ad finem. Available at: />5. Connolly HM, Crary JL, McGoon MD, et al. Valvular heart disease associated with fenflu-
ramine-phentermine. N Engl J Med. Aug 28, 1997; 337(9):581–588.
6. Cited in Sartwell P and Nathanson N. Epidemiologic Reviews. 1993.
7. Sacks FM, Pfeffer MA, Moye LA, et al. The effect of pravastatin on coronary events after
myocardial infarction in patients with average cholesterol levels. Cholesterol and recurrent
events trial investigators. N Engl J Med. Oct 3, 1996; 335(14):1001–1009.
2 Introduction to Clinical Research and Study Designs 27
8. Doll R. Cohort studies: history of the method. II. Retrospective cohort studies. Soz Praventivmed
2001; 46(3):152–160.
9. von Elm E, Altman DG, Egger M, Pocock SJ, Gotzsche PC, Vandenbroucke JP. The
Strengthening the Reporting of Observational Studies in Epidemiology (STROBE) statement:
guidelines for reporting observational studies. Ann Intern Med. Oct 16, 2007;
147(8):573–577.
Chapter 3
Clinical Trials*
Stephen P. Glasser
Abstract The spectrum of evidence imparted by the different clinical research
designs ranges from ecological studies through observational epidemiological
studies to randomized control trials (RCTs). This chapter addresses the definition
of clinical research, the major aspects of clinical trials eg ethics, randomization,
masking, recruitment and retention of subjects enrolled in a clinical trial, patients/
subjects lost to follow-up during the trial etc. Although this chapter focuses on
the weaknesses of clinical trials, it is emphasized that the randomized, placebo-
controlled, double blind clinical trial is the design that yields the greatest level of
scientific evidence.
A researcher is in a gondola of a balloon that loses lift and lands in the middle of a field near
a road. Of course, it looks like the balloon landed in the middle of nowhere. As the researcher
ponders appropriate courses of action, another person wanders by. The researcher asks,
‘Where am I?’ The other person responds, ‘You are in the gondola of a balloon in the middle
of a field.’ The researcher comments, ‘You must design clinical trials.’ ‘Well, that’s amazing,
how did you know?’ ‘Your answer was correct and precise and totally useless.’
Introduction
The spectrum of evidence imparted by the different clinical research designs ranges
from ecological studies through observational epidemiological studies to rand-
omized control trials (RCTs). The differences in clinical research designs and the
different weights of evidence are exemplified by the post-menopausal hormone
replacement therapy (HRT) controversy. Multiple observational epidemiological
studies had shown that HRT was strongly associated with the reduction of athero-
sclerosis, myocardial infarction risk, and stroke risk.
1-3
subsequently, 3 clinical tri-
als suggested that HRT was not beneficial, and might even be harmful.
4-6
This latter
observation raises a number of questions, including: why can this paradox occur?
what can contribute to this disagreement?; and, why do we believe these 3 RCT’s
more than so many well-done observational trials?
* Over 50% of this chapter is taken from “Clinical trial design issues: at least 10 things you should
look for in clinical trials”
7
with permission of the publisher.
S.P. Glasser (ed.), Essentials of Clinical Research, 29
© Springer Science + Business Media B.V. 2008
30 S.P. Glasser
Before addressing these above questions it is appropriate to point out that fre-
quently, there is confusion about the difference between clinical research and clinical
trials. A clinical trial is one type of clinical research. A clinical trial is a type of experi-
mental study undertaken to assess the response of an individual (or in the case of
group clinical trials-a population) to interventions introduced by an investigator.
Clinical trials can be randomized or non-randomized, un-blinded, single-blinded, or
double-blinded; comparator groups can be placebo, active controls, or no treatment
controls, and RCTs can have a variety of designs (eg parallel group, crossover, etc.).
That being said, the RCT remains the ‘gold-standard’ study design and its results are
appropriately credited as yielding the highest level of scientific evidence (greatest
likelihood of causation). However, recognition of the limitations of the RCT is also
important so that results from RCTs are not blindly accepted. As Grimes and Schultz
point out, in this era of increasing demands on a clinician’s time it is ‘difficult to stay
abreast of the literature, much less read it critically. In our view, this has led to the
somewhat uncritical acceptance of the results of a randomized clinical trial’.
8
Also,
Loscalzo, has pointed out that ‘errors in clinical trial design and statistical assessment
are, unfortunately, more common that a careful student of the art should accept’.
9
What leads the RCT to the highest level of evidence and what are the features of
the RCT that renders it so useful? Arguably, one of the most important issues in clini-
cal trials is having matched groups in the interventional and control arms; and, this is
best accomplished by randomization. That is, to the degree that the 2 groups under
study are different, results can be confounded, while when the 2 groups are similar,
confounding is reduced (See chapter 17 for a discussion of confounding). It is true
that when potential confounding variables are known, one can relatively easily adjust
for them in the design or analysis phase of the study. For example, if smoking might
confound the results of the success of treatment for hypertension, one can build into
the design a stratification scheme that separates smokers form non-smokers, before
the intervention is administered and in that way determine if there are differential
effects in the success of treatment (e.g. smokers and non-smokers are randomized
equally to the intervention and control). Conversely, one can adjust after data collec-
tion in the analysis phase by separating the smokers from the non-smokers and again
analyze them separately in terms of the success of the intervention compared to the
control. The real challenge of clinical research, is not how to adjust for known con-
founders, but how to have matched (similar groups- how to adjust) in the intervention
and control arms, when potential confounders are not known. Optimal matching is
accomplished with randomization, and this is why randomization is so important.
More about randomization later, but in the meanwhile one can begin to ponder how
un-matching might occur even in a RCT. In addition to randomization, there are a
number of important considerations that exist regarding the conduct of a clinical trial,
such as: is it ethical? what type of comparator group should be used? what type of
design and analysis technique will be utilized? how many subjects are needed and
how will they be recruited and retained? etc.
Finally, there are issues unique to RCTs (eg intention-to-treat analysis, placebo
control groups, randomization, equivalence testing) and issues common to all
clinical research (eg ethical issues, blinding, selection of the control group, choice
3 Clinical Trials 31
of the outcome/endpoint, trial duration, etc) that must be considered. Each of these
issues will be reviewed in this chapter (Table 3.1). To this end, both the positive
and problematic areas of RCTs will be highlighted.
Ethical Issues
Consideration of ethical issues is key to the selection of the study design chosen for
a given research question/hypothesis. For RCTs ethical considerations can be par-
ticularly problematic, mostly (but by no means solely) as it relates to using a pla-
cebo control. A full discussion of the ethics of clinical research is beyond the scope
of this book, and for further discussion one should review the references noted
here.
10-12
(There is also further discussion of this issue under the section entitled
Traditional vs. Equivalence Testing and Chapters 4 and 7). The opinions about
when it is ethical to use placebo controls is quite broad. For example, Rothman and
Michaels are of the opinion that the use of placebo is in direct violation of the
Nuremberg Code and the Declaration of Helsinki,
12
while others would argue that
placebo controls are ethical as long as withholding effective treatment leads to no
serious harm and if patients are fully informed. Most would agree that placebo is
unethical if effective life-saving or life-prolonging therapy is available or if it is
likely that the placebo group could suffer serious harm. For ailments that are not
likely to be of harm or cause severe discomfort, some would argue that placebo is
justifiable.
11
However, in the majority of scenarios, the use of a placebo control
Table 3.1 Issues of importance for RCTs
Ethical considerations
Randomization
Eligibility criteria
Efficacy vs effectiveness
Compliance
Run-in periods
Recruitment and retention
Masking
Comparison groups
Placebo
‘Normals’
Analytical issues
ITT
Subgroup analysis
Losses to follow-up
Equivalence vs traditional testing
Outcome selection
Surrogate endpoints
Composite endpoints
Trial duration
Interpretation of results
Causal inference
The media
32 S.P. Glasser
is not a clear-cut issue, and decisions need to be made on a case-by-case basis. One
prevailing standard that provides a guideline for when to study an intervention
against placebo is when one has enough confidence in the intervention that one is
comfortable that the additional risk of exposing a subject to the intervention is low
relative to no therapy or the ‘standard’ treatment; but, that there is sufficient doubt
about the intervention that use of a placebo or active control (‘standard treatment’)
is justified. This balance, commonly referred to as equipoise, can be difficult to
come by and is likewise almost always controversial. Importantly, equipoise needs
to be present not only for the field of study (i.e. there is agreement that there is not
sufficient evidence of the superiority of an alternative treatments), but equipoise
also has to be present for individual investigators (permitting individual investiga-
tors to ethically assign their patients to treatment at random).
Another development in the continued efforts to protect patient safety is the Data
Safety and Monitoring Board (DSMB-see chapter 9). The DSMB is now almost
universally used in any long-term intervention trial. First a data and safety monitor-
ing plan (DSMP) becomes part of the protocol, and then the DSMB meets at regular
and at ‘as needed’ intervals during the study in order to address whether the study
requires early discontinuation. As part of the DSMP, stopping rules for the RCT
will have been delineated. Thus, if during the study, either the intervention or con-
trol group demonstrates a worsening outcome, or the intervention group is showing
a clear benefit, or adverse events are greater in one group vs the other (as defined
within the DSMP) the DSMB can recommend that the study be stopped. But, the
early stopping of studies can also be a problem. For example, in a recent systematic
review by Montori et al, the question was posed about what was known regarding
the epidemiology and reporting quality of RCTs involving interventions stopped for
early benefit.
13
Their conclusions were that prematurely stopped RCTs often fail to
adequately report relevant information about the decision to stop early, and that one
should view the results of trials that are stopped early with skepticism.
13
Randomization
Arguably, it is randomization that results in the RCT yielding the highest level of
scientific evidence (i.e. resulting in the greatest likelihood that the intervention is
causally related to the outcome). Randomization is a method of treatment allocation
that is a distribution of study subjects at random (i.e. by chance). As a result, rand-
omization results in all randomized units (e.g. subjects) having the same and
independent chance of being allocated to any of the treatment groups, and it is impos-
sible to know in advance to which group a subject will be assigned. The introduction
of randomization to clinical trials in the modern era can probably be credited to the
1948 trial of streptomycin for the treatment of tuberculosis (Fig. 1.1).
14
In this trial,
55 patients were randomized to either streptomycin with bed rest, or to treatment with
bed rest alone (the standard treatment at that time). To quote from that paper, ‘deter-
mination of whether a patient would be treated by streptomycin and bed rest (S case)
3 Clinical Trials 33
or bed rest alone (C case), was made by reference to a statistical series based on
random sampling numbers drawn up for each sex at each center by Professor
Bradford Hill; the details of the series were unknown to any of the investigators or to
the co-coordinator and were contained in a set of sealed envelopes each bearing on
the outside only the name of the hospital and a number. After acceptance of a patient
by the panel and before admission to the streptomycin centre, the appropriate num-
bered envelope was opened at the central office; the card inside told if the patient was
to be an S or C cases, and this information was then given to the medical officer at
the centre’. Bradford Hill was later knighted for his contributions to science including
the contribution of randomization.
With randomization the allocation ratio (number of units-subjects- randomized
to the investigational arm versus the number randomized to the control arm) is usu-
ally 1:1. But a 1:1 ratio is not required, and there may be advantages to unequal
allocation (e.g. 2:1 or even 3:1). The advantages of unequal allocation are: one
exposes fewer patients to placebo, and one gains more information regarding the
safety of the intervention. The main disadvantage of higher allocation ratios is
the loss of power.
There are 3 general types of randomization: simple, blocked, and stratified.
Simple randomization can be likened to the toss of an unbiased coin-ie heads group
A, tails group B. This is easy to implement, but particularly with small sample
sizes, could result in substantial imbalance (for example if one tosses a coin 10
times, it is not improbable that one could get 8 heads and 2 tails. If one tosses the
coin 1000 times it is likely that the distribution of heads to tails would be close to
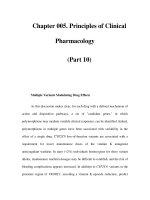
Confounder (SES)
CHD (CHD risk)Risk Factor (Estrogen)
Confounders of relationships in
Randomized Clinical Trials
In a RCT,
those with and
without the
confounder as
assigned to the
risk factor at
random
It now doesn’t matter if the confounder (SES) is related to
CHD risk, because it is not related to the risk factor
(estrogen) it cannot be a confounder
Fig. 3.1 The relationship of confounders to outcome and how they are eliminated in a RCT
34 S.P. Glasser
500 heads and 500 tails). Blocked randomization (sometimes called permuted
block randomization) is a technique common to multi-center studies. Whereas the
entire trial might intend to enroll 1000 patients, each center might only contribute
10 patients to the total. To prevent between center bias (recall each sample popula-
tion has differences even if there is matching to known confounders) blocked rand-
omization can be utilized. Blocked randomization means that randomization occurs
within each center ensuring that about 5 patients in each center will be randomized
to the intervention and 5 to the control. If this approach was not used, one center
might enroll 10 patients to the intervention and another center, 10 patients to the
control group. Recall that the main objective of randomization is to produce
between-group comparability. If one knows prior to the study implementation that
there might be differences that are not equally distributed between groups (again
particularly more likely with small sample sizes) stratified randomization can be
used. For example, if age might be an important indicator of drug efficacy, one can
randomize within strata of age groups (e.g. 50–59, 60–69 etc.). Within each stra-
tum, randomization can be simple or blocked.
In review, simple randomization is the individual allocation of subjects into the
intervention and control groups, block randomization creates small groups
(blocks) in which there are equal numbers in each treatment arm so that there are
balanced numbers throughout a multi-center trial, and stratified randomization
addresses the ability to separate known confounders into strata so that they can no
longer confound the study results. Again, randomization is likely the most impor-
tant key to valid study results because (if the sample size is large enough), it dis-
tributes known, and more importantly unknown, confounders equally to the
intervention and control groups.
Now, as to the problems associated with randomization. As prior discussed, the
issue of confounders of relationships is inherent in all clinical research. A con-
founder is a factor that is associated with both the risk factor and the outcome, and
leads to a false apparent association between the risk factor and outcome (See Fig. 3.2).
In observational studies, there are two alternative approaches to remove the effect
of confounders:.
●
Most commonly used in case/control studies, one can match the case and control
populations on the levels of potential confounders. Through this matching the
investigator is assured that both those with a positive outcome (cases) and a
negative outcome (controls) have similar levels of the confounder. Since, by
definition, a confounder has to be associated with both the risk factor and the
outcome; and, since through matching the suspected confounder is not associ-
ated with the outcome – then the factor cannot affect the observed differences in
the outcome. For example, in a study of stroke, one may match age and race for
stroke cases and community controls, with the result that both those with and
without strokes will have similar distributions for these variables, and differ-
ences in associations with other potential predictors are not likely to be con-
founded, for example, by higher rates in older or African American
populations.
3 Clinical Trials 35
●
In all types of observational epidemiological studies, one can statistically/
mathematically ‘adjust’ for the confounders. Such an adjustment allows for
the comparison between those with and without the risk factor at a ‘fixed
level’ of the confounding factor. That is, the association between the exposure
and the potential confounding factor is removed (those with and without the
exposure are assessed at a common level of the confounder), and as such the
potential confounder cannot bias the association between the exposure and the
outcome. For example, in a longitudinal study assessing the potential impact
of hypertension on stroke risk, the analysis can ‘adjust’ for race and other
factors. This adjustment implies that those with and without the exposure
(hypertension) are assessed as if race were not associated with both the expo-
sure and outcome.
The major shortcoming with either of these approaches is that one must know
what the potential confounders are in order to match or adjust for them; and,
it is the unknown confounders that represent a bigger problem. Another issue
is that even if one suspects a confounder, one must be able to appropriately
measure it. For example, a commonly addressed confounder is socio-eco-
nomic status (usually a combination of education and income); but, clearly
this is an issue in which there is disagreement and, which measure or cut-
point is appropriate. The bottom line is that one can never perfectly measure
all known confounders and certainly one cannot measure or match for
unknown confounders. As mentioned, the strength of the RCT is that rand-
omization (performed properly and with a large enough sample size) balances
both the known and unknown confounders between the interventional and
control groups. But even with an RCT, randomization can be further compro-
mised as will be discussed in some of the following chapters, and by the fol-
lowing example from “Student’s” Collected Papers regarding the Lanarkshire
Milk Experiment:
15
“Student” (ie, the great William Sealy Gosset) criticized the experiment for it’s loss of
control over treatment assignment. As quoted: Student’s “ contributions to statistics, in
spite of a unity of purpose, ranged over a wide field from spurious correlation to Spearman’s
correlation coefficient. Always kindly and unassuming, he was capable of a generous rage,
an instance of which is shown in his criticism of the Lancashire Milk Experiment. This was
a nutritional experiment on a very large scale. For four months 5,000 school children
received three-quarters of a pint of raw milk a day, 5,000 children the same quantity of
pasteurized milk and 10,000 other children were selected as controls. The experiment, in
Gosset’s view, was inconclusive in determining whether pasteurized milk was superior in
nutritional value to raw milk.
This was due to failure to preserve the random selection of controls as originally
planned. “In any particular school where there was any group to which these methods
(i.e., of random selection) had given an undue proportion of well-fed or ill-nourished
children, others were substituted to obtain a more level selection.” The teachers were
kind-hearted and tended to select ill-nourished as feeders and well-nourished as con-
trols. Student thought that among 20,000 children some 200–300 pairs of twins would
be available of which some 50 pairs would be identical-of the same sex and half the
remainder nonidentical of the same sex. The 50 pairs of identicals would give more
36 S.P. Glasser
reliable results than the 20,000 dealt with in the experiment, and great expense would
be saved. It may be wondered, however, whether Student’s suggestion would have
proved free from snags. Mothers can be as kind-hearted as teachers, and if one of a
pair of identical twins seemed to his mother to be putting on weight. . .
Implications of Eligibility Criteria
In every study there are substantial gains in statistical power by focusing the inter-
vention in a homogenous patient population likely to respond to treatment, and to
exclude patients that could introduce ‘noise’ by their inconsistent responses to
treatment. Conversely, at the end of a trial there is a need to generalize the findings
to a broad spectrum of patients who could potentially benefit from the superior
treatment. These conflicting demands introduce an issue of balancing the inclu-
sion/exclusion (eligibility criteria) such that the enrolled patients are as much alike
as possible; but, on the other hand to be as diverse as possible in order to be able
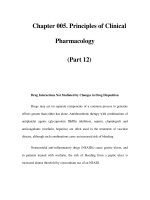
to apply the results to the more general population (i.e. generalizability). Fig. 3.2
outlines this balance. What is the correct way of achieving this balance? There
really is no correct answer, there is always a tradeoff between homogeneity and
generalizability; and each study has to address this, given the availability of
subjects, along with other considerations. This process of sampling represents one
of the reasons that scientific inquiry requires reproducibility of results, that is, one
study generally cannot be relied upon to portray ‘truth’ even if it is a RCT. The
process of sampling embraces the concept of generalizability. The issue of
generalizability is nicely portrayed in a video entitled ‘A Village of 100’.
16
If one
Implications of Eligibility Criteria
Homogeneity
•
Divergent subgroup of
patients (i.e., “weird”
patients) can distort
findings for the majority
•
Restriction of
population reduces
“noise” and allows study
to be done in a smaller
sample size
Restrict population to
homogenous group
Generalizability
• At the end of the study,
it will be important to
apply findings to the
broad population of
patients with the disease
•
It is questionable to
generalize the findings
to those excluded from
the study
Have broad inclusion
criteria “welcoming” all
What is the correct answer?
There is no correct answer!
Fig. 3.2 The balance of conflicting issues involved with patient selection
3 Clinical Trials 37
wanted to have a representative sample of the world for a study, this video (although
predominately focused upon tolerance and understanding), is an excellent way of
understanding the issue of generalizability. The central theme of the video asks the
question ‘if we shrunk the earth’s population to a village of precisely 100 people,
with all existing ratios remaining the same, what would it look like?’ To para-
phrase, if we maintained the existing ratios of the earth’s population in a study of
100 people, what would our sample look like? The answer–there would be 57
Asians, 21 Europeans, 14 from the Western Hemisphere, 51 females and 49 males,
70 non-white and 30 white, 70 non Christians and 30 Christians, 89 heterosexuals,
50% of the worlds wealth would belong to 6 citizens of the USA, 80 would live in
sub-standard housing, 70 would be unable to read (a potential problem with IRB
approval), 50 would be malnourished, 1 would have a college education, and 4
would own a computer. When is the last time a study had a population representa-
tive of the Village of 100?
For an example of sampling issues, most of the major studies assessing the effi-
cacy of the treatment of extracranial atherosclerosis with endarterectomy had
excluded octogenarians on the basis that this patient population may have a response
to the challenges of surgery that is different than their younger counterparts.
17, 18
Exclusion of these patients may have contributed to the successful completion of
‘positive’ trials (finding a benefit for the new treatment – endarterectomy). However,
now that the trials are complete, there is not ‘level 5’ evidence (data that is a result
from RCTs) to guide the management of octogenarians with extracranial atheroscle-
rosis, one of the subpopulations where the need for this information is important. In
the absence of this information, thousands of endarterectomies are performed in this
older patient population each year under the assumption that the findings from a
younger cohort are generalizable to those at older ages. For another example, let’s
presume that in a multicenter trial that included Framingham Mass., and Birmingham,
AL, that a representative sample of each was recruited into a study. The makeup of
the sample from each is illustrated in Table 3.2. As one can see, there are significant
Table 3.2 Birmingham vs Framingham: comparison of key variables
Birmingham Framingham
Population 242,800 62,910
% African-American 73.5 5.1
Age
25–44 30 35
45–64 20 22
65-> 14 13
Median Income $ 26,700 55,300
Education
<High School 25 13
High School 28 23
>High School 48 64
CVD 528–582 336–451
38 S.P. Glasser
differences in the representative sample populations, and these differences could
affect not only the success of the intervention or confound its relationship.
Efficacy vs Effectiveness
Another limitation of RCTs is that they are designed to test safety and efficacy (i.e.
does the drug work under optimal circumstances?) and not to answer questions
about the effectivenessof a drug, the more relevant question for clinicians and eco-
nomic analysts (i.e. does the drug work under ordinary circumstances of use?).
Thus, the increased use of effectiveness trials has been suggested, to more closely
reflect routine clinical practice. Effectiveness trials use a more flexible dosage regimen,
and a ‘usual care’ comparator instead of a placebo comparator. (Two approaches to
this more ‘real world trial’ is the phase 4 trial- see Chapter 5) or the prospective,
randomized, open-label, blinded end-point –PROBE-Trial. The PROBE Trial is
further discussed in the next section entitled Degree of Masking). As to phase 4 tri-
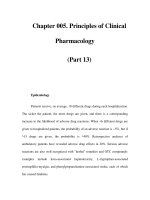
als, they are surrounded by some controversy as well. Fig. 3.3 compares efficacy
and effectiveness trials in terms of some of their more important variables.
Patient Compliance
Run-in Periods
Another issue surrounding RCTs, and one which is almost unique to clinical trials,
is the use of run-in periods and their impact on who is eligible to be randomized.
Efficacy vs Effectiveness Trials:
The Effect on Generalizability and Internal Validity
Generalizability Increases
Internal Validity Increases
Efficacy Trials
Effectiveness Trials
Fig. 3.3 Efficacy vs Effectiveness
3 Clinical Trials 39
Pre-randomization run-in periods are frequently used to select or exclude patients
in clinical trials, but the impact of run-in periods on clinical trial interpretation and
generalization has not been systematically studied. The controversy regarding run-
in periods also addresses the issue of efficacy vs. effectiveness, as the run-in period
allows one to exclude patients that are less compliant, or do not tolerate placebo (or
whatever other intervention is used in the active comparison group). Although this
issue has not been systematically studied, intuitively one can see that the potential
for over-estimating the impact of an investigational drug is present when run-in
periods are utilized, as the run-in period will likely exclude patients from the study
who would not have ideally responded.
A study can achieve high compliance in at least 3 general ways: designing a
simple protocol (complexity makes compliance more difficult); the use of compliance
aids such as automatic reminders, telephone calls, calendars, etc; or by selecting
subjects based upon pre-study or pre-randomization compliance. Of course, high
compliance is a desirable characteristic of any research. High compliance attenu-
ates the argument of whether to use intention to treat vs. compliance only as the
primary analysis. Also, high compliance will optimize the studies power as the
diluting effect of non-compliers will not be manifest (all other things being equal).
While the run-in period increases the proportion of compliers in the trial, it may
introduce important differences in the outcomes, particularly if compliers and non-
compliers are inherently different in the way they would respond to the intervention
of interest. Thus, the effect of run-in periods on generalizability should be consid-
ered carefully before implementation. Lang
19
has listed some recommendations for
helping to decide whether to use a run-in as part of a clinical trial, including:
1. Consider a run-in whenever the contact between study staff and participants is low
2. Consider a run-in period for a primary prevention trial because compliance is
likely to be harder compared to therapeutic trials
3. For any trial, list the key features of the study protocol and see which features
compliance could be directly tested prior to randomization
4. Before using active agents during a run-in, consider both the expected frequency
of occurrence of side effects and the postulated effect of the agent on the out-
come of interest
5. All trials can use any available pre-randomization period for the simultaneous
purpose of characterizing patients and evaluating compliance, whether of not the
compliance information will be used for exclusions
In fairness, as Franciosa points out, clinicians use variants of run-in periods to
treat their patients, such as dose titration, or challenge dosing (such as using small
doses of ACE Inhibitors to rule out excessive responders). Pablos-Mendez et al,
analyzed illustrative examples of reports of clinical trials in which run-in periods
were used to exclude non-compliant patients, placebo responders, or patients that
could not tolerate or did not respond to active drug.
Thus, the use of run-in periods is another reason that the results of RCTs may
not accurately portray what the drugs overall effectiveness will be. What can be
said is that there does need to be more focus on the details of run-in periods, and as
40 S.P. Glasser
is true of most things the researcher does in designing and implementing a clinical
trial, judgments have to be made regarding the best approach to use regarding inclu-
sions and exclusions, as well as judging what the impact of the run-in period is on
the ultimate interpretation of a clinical trial.
Recruitment and Retention
Nothing is more critical to the success of a clinical trial than the recruitment and
retention of subjects. As will be discussed in more detail in Chapter 8, there are a
number of reasons for failure of the recruitment process including: delayed start-up,
and inadequate planning, In terms of patient/subject retention, there are arguably
differences in the handling of clinical patients in contrast to research subjects
(although this could and perhaps should be challenged). Losses-to-follow-up need
to be kept to a minimum and is discussed later in this chapter.
Degree of Masking (Blinding)
Although the basic concept of clinical trials is to be at equipoise, this does not
change the often pre-conceived ‘suspicion’ that there is a differential benefit of
the investigational therapy (e.g. the investigational drug is better than placebo).
Thus, if study personnel know the treatment assignment, there may be differen-
tial vigilance where the supposed ‘inferior group’ is more intensively monitored
(e.g. ‘are you certain you have not had a problem?’ they might ask). In this case,
unequal evaluations can provide unequal opportunities to differentially ‘dis-
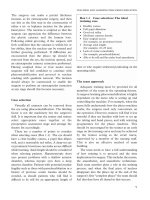
cover’ events. This is why the concept of double-blinding (masking) is an impor-
tant component of RCTs. There is an argument about which term-blinding or
masking is most appropriate, and Fig. 3. 4 portrays a humorous example of this
argument. But, one cannot always have a double-blind trial, and some would
argue that double-blinding distances the trial from a ‘real-world’ approach. An
example where blinding is difficult to achieve might be a surgical vs. medical
intervention study where post operative patients may require additional follow-
up visits, and each visit imparts an additional opportunity to elicit events. That
is, it has been said that ‘the patient cannot have a fever if the temperature is not
taken,’
20
and for RCTs, events cannot be detected without patient contact to
assess outcomes.
In order to realize a more ‘real-world’ principal to clinical trials, the prospective
randomized open-label blinded endpoint design (PROBE design) was developed.
Randomization is used so that important component of study design is retained. By
using open-label therapy, the drug intervention and its comparator can be clinically
titrated as would occur in a doctor’s office. Of course, blinding is lost here, but only
3 Clinical Trials 41
as to the therapy. In a PROBE design, blinding is maintained as to the outcome. To
test whether the use of open-label vs. double-blind therapy affected outcomes dif-
ferentially, a meta analysis of PROBE trials and double-blind trials in hypertension
was reported by Smith et al.
21
They found that changes in mean ambulatory blood
pressure from double-blind controlled studies and PROBE trials were statistically
equivalent.
Selection of Comparison Groups
Sometimes studies assess a new active (investigational) treatment versus an
approved (standard) active treatment (i.e. to assess if the old ‘standard’ treatment
should be replaced with the new treatment), in other cases, studies are assessing if
a new treatment should be added (not replacing, but rather supplementing), current
treatment. In this latter case, the comparison of interest is the outcome of patients
with and without the new treatment. In this instance, masking can only be accom-
plished by the use of a double-blind technique. Traditionally, placebo treatment has
been used as the comparator to active treatment, and has been one of the standards
of clinical trials.
The use of the placebo comparator has more and more been the subject of
ethical concerns. In addition to ethical issues involved with the use of place-
bos, there are other considerations raised by the use of placebo-controls. For
Fig. 3.4 A humerous example of blinding
42 S.P. Glasser
example, an important lesson was learned from the Multiple Risk Factor
Intervention Trial (MRFIT) regarding the use and analysis of the placebo con-
trol group, which might best be summed up as ‘why it is important to watch
the placebo group’.
22
MRFIT screened 361,662 patients to randomize high risk
participants (using the Framingham criteria existent at that time) to special
intervention (n = 6428) and usual care (n = 6438) with coronary heart disease
mortality as the endpoint. The design of this well-conducted study assumed
that the risk factor profile of those receiving ‘special treatment interventions’
would improve, while those patients in the ‘usual care’ group would continue
their current treatments and remain largely unaffected as far as additional
benefit. The special intervention approaches in MRFIT were quite successful,
and all risk factor levels were reduced. However, there were also substantial
and significant reductions observed the control group. That both treatment
groups experienced substantial improvements in their risk factor profile trans-
lated to almost identical CHD deaths during the course of the study. Why did
the control group fare so well? Several phenomena may have contributed to the
improvement in the placebo-control group. First, is the Hawthorne effect,
which suggests that just participating in a study is associated with increased
health awareness and changes in risk factor profile, irrespective of the inter-
vention. In addition, for the longer-term trials, there are changes in the general
population that might alter events. For example, randomization in MRFIT was
conducted during the 1980’s, a period when health awareness was becoming
more widely accepted in the USA, and likely beneficially affected the control
group.
Although the ethics of placebo controls is under scrutiny, another principal
regarding the placebo-control group is that sometimes being in the placebo
group isn’t all that bad. The Alpha-Tocopherol, Beta Carotene Cancer
Prevention Study was launched in 1994.
23
By the early 1990s there was mount-
ing clinical epidemiologic evidence of reduced cancer risk associated with
higher intake of antioxidants. Treatment with vitamin E and beta carotene were
considered unlikely to be harmful, and likely to be helpful; and, the question
was asked whether antioxidants could reduce lung cancer-even in smokers. A
double-blind, placebo-controlled RCT was launched with a 2 x 2 factorial
design (see Chapter 4), and over 7000 patients in each cell. No benefit was seen
with either therapy, but compared to placebo; a disturbing worsening trend was
observed in the beta-carotene treated group.
Frequently, the comparison group or control group is a so called ‘normal’
population. Inherent to this concept is ‘what is normal?’. A wit once opined
that ‘a normal person is one who is insufficiently tested’. Interestingly, there
are a number of scientific definitions of normal (See Table 3.3). One defini-
tion of normal might be someone who fits into 97% of a Gaussian distribu-
tion, another that they lay within a preset percentile of a laboratory value or
values. Other definitions exist, suffice it to say, whatever definition is used it
needs to be clearly identified.
3 Clinical Trials 43
Analytic Approach
Intention to Treat and Per-Protocol Analysis
There are 3 general analytic approaches to clinical trials; intention-to-treat (ITT)
analysis (or analysis as randomized), compliers only (or per-protocol) analysis, and
analysis by treatment received. Probably the least intuitive and the one that causes
most students a problem is ITT. ITT was derived from a principle called the prag-
matic attitude.
24
The concept was that one was to compare the effectiveness of the
intention to administer treatment A vs. the intention to administer treatment B,
i.e the comparison of two treatment policies rather than a comparison of two spe-
cific treatments. With ITT, everyone assigned to an intervention or control arm is
counted in their respective assigned group, whether they ultimately receive none of
the treatment, or somewhat less than the trial directed. For example, if in a 1 year
trial, a patient is randomized to receive an intervention, but before the intervention
is administered, they drop out (for what ever reason) they are analyzed as if they
received the treatment for the entire year. The same applies if the patient drops out
at any time during the course of the study. Likewise, if it is determined that the
patient is not fully compliant with treatment, they are still counted as if they were.
In fact whether there is compliance, administrative, or protocol deviation issues,
patients once randomized are counted as if they completed the trial. Most students
initially feel that this is counter-intuitive. Rather the argument would be that one is
really interested in what would happen if a patient is randomized to a treatment arm
and they take that treatment for the full trial duration and are fully compliant-this,
one would argue, gives one the real information needed about the optimal effect of
an intervention (this, by the way, is a description of the compliers only analysis).
So why is ITT the scientifically accepted primary analysis for clinical trials? As
mentioned before, randomization is arguably one of the most important aspects of
a clinical trial design. If patients once randomized to a treatment are not included
in the analysis, the process of randomization is compromised. It is not a leap of
Table 3.3 What is normal?
Property Term Consequences of application
Distribution shape Gaussian Minus values
Lies w/in preset Percentile Normal until workup
percentile
Carries no additional Risk factor Assumes altering risk
risk of morbidity/ factor alters risk
mortality
Socially/politically Culturally desirable Role of society in medicine
aspired
Range before test Diagnostic Need to know PV in your practice
suggests D-
Therapy does more Therapeutic New therapies continually alter this
good than harm
44 S.P. Glasser
faith to wonder if patients dropping out of the intervention arm might be different
than the patients dropping out of a control arm. Thus, if ITT is not used, one loses
the assurance of equal distribution of unknown confounders between the treatment
groups. One example of the loss of randomization if ITT is not used might be dif-
ferential dropouts between the intervention and control arm for adverse events.
Also, if patients with more severe disease are more likely to dropout from the pla-
cebo arm; or conversely patients who are older dropout more frequently from the
placebo arm thereby removing them from the analysis, this could result in an imbal-
ance between the two groups. Another argument for ITT is that it provides for the
most conservative estimate of the intervention effect (if the analysis includes patients
that did not get the entire treatment regimen and the regimen is beneficial, clearly the
treatment effect will have been diluted). Thus if using ITT analysis reveals a benefit,
it adds to the credibility of the effect measure. Of course, one could argue that one
could miss a potentially beneficial effect if the intervention is diluted.
With the compliers only analysis, only the patients that complete the trial and
comply fully with that treatment are analyzed. The problem is that if a beneficial
effect is seen, one can wonder what the loss of randomization (and thereby equality
of confounders between groups) means to that outcome, particularly if ITT does not
demonstrate a difference. The loss of randomization and the loss of balanced con-
founders between the treatment and control groups is exemplified by an analysis of
the Coronary Drug Project, where it was determined that poor compliers to placebo
had a worse outcome than good compliers to placebo.
25
This would suggest that
there are inherent differences in patients who comply vs. those who do not. The
Coronary Drug Project was a trial aimed at comparing clofibrate with placebo in
patients with previous myocardial infarction with the outcome of interest being
mortality. Initially reported as a favorable intervention (there was a 15% 5 year
mortality in the compliers only analysis clofibrate group, compared to a 19.4%
mortality in the placebo group-p < .01), with ITT analysis there was essentially no
difference in outcome (18.2 vs. 19.4%-p < .25). Given the differences in outcome
between placebo compliers and placebo non compliers, one can only assume the
same for the investigational drug group. Likewise, the Anturane Reinfarction Trial
was designed to compare anturane with placebo in patients with a prior MI and in
whom mortality was the outcome of interest.
26
1629 patients were randomized to
placebo and 812 to anturane (71 patients were later excluded because it was deter-
mined that they did not meet eligibility criteria). The study initially reported
anturane as a favorable intervention (although the p < .07), but when the 71 ineligi-
ble randomized patients were included in the analysis the p = .20. Again further
analysis demonstrated that in the anturane ineligible patients, overall mortality was
26% compared to the mortality in the anturane eligible patients which was 9%.
If one considers the common reasons for patient withdrawal from a study, ineli-
gibility is certainly one. In addition, patients may be dropped from a trial for poor
compliance, and adverse drug events; and patients may be excluded from analysis
due to protocol deviations or patients lost to follow up. Some of the reasons for
ineligibility are protocol misinterpretations, clerical error, or wrong diagnosis at the
time of randomization. Sometimes the determination of ineligibility is above question
3 Clinical Trials 45
(eg the patient fell outside of the studies predetermined age limit) but frequently
ineligibility requires judgment. The MILIS study is an example of this latter con-
cept. MILIS compared propranolol, hyaluronidase, and placebo in patients with
early acute MI, in order to observe effects on mortality. Subsequently, some patients
were deemed ineligible because the early diagnosis of MI was not substantiated.
But, what if the active therapy actually had an effect on preventing or ameliorating
the MI? The problem with not including patients in this instance is that more
patients could have been withdrawn from the placebo group compared to the active
therapy group and as a result interpretation of the data would be compromised.
Of course, as is true of most things in clinical research there is not just one
answer, one has to carefully assess the trial specifics. For example, Sackett and
Gent cite a study comparing heparin to streptokinase in the treatment of acute myo-
cardial infarction.
27
The ITT analysis showed that streptokinase reduced the risk of
in-hospital death by 31% (p = 0.01). However, 8 patients randomized to the heparin
group died after randomization, but before they received the heparin. Analysis
restricted to only those who received study drug decreased the benefit of streptoki-
nase (and the p value).
In summary, ITT is the most accepted (by most scientists and the FDA) as the analy-
sis of choice for clinical trials. This is because it assures statistical balance (as long as
randomization was properly performed), it ‘forces’ disclosure of all patients rand-
omized in a trial, and most of the arguments against ITT can be rationally addressed.
Analysis as treated is another analytic approach that addresses not the group to
which the patient was randomized and not compliers only, but what the patient
actually received. This analytic approach is utilized most often when patients cross
over from one treatment to the other; and, this occurs most often in surgical vs.
medical treatment comparisons. For example, patient’s randomized to medical
treatment (vs. coronary artery bypass surgery) might, at sometime during the study,
be deemed to need the surgery, and are thus crossed over to the surgical arm and
are then assessed as to the treatment they received ie surgery. Like compliers only
analysis, this might be an interesting secondary analytic technique, but shares many
of the same criticisms discussed earlier for compliers only analysis. In fact, because
such trials cannot easily be double-blind, even greater criticism can be leveled
against this analytic approach than compliers only analysis. In addition, statistical
testing with this analytic approach, is more complicated, not only by the crossovers,
but by the inherent nature of the comparison groups. In comparison trials of 1 drug
and placebo, for example, it is reasonable to assume that if the drug is superior to
placebo (or an active control) patients in the drug group will average fewer events
in the follow-up period. When this is displayed as survival curves, the survival
curves will increasingly separate. In trials comparing surgical to medical therapy,
the aforementioned approach may not be reasonable. For example, if patients rand-
omized to surgery have a high early risk (compared to the non-surgical group) and
a lower risk later, these risks may cancel and be similar to the number of events
under the null hypothesis of no difference between groups. The issue of comparing
surgical and non-surgical therapies in clinical trials has been nicely summarized by
Howard et al.
28
46 S.P. Glasser
Subgroup Analysis
As pointed out by Assmann et al, most clinical trials collect substantial baseline
information on each patient in the study.
29
The collection of baseline data has at
least 4 main purposes: 1) to characterize the patients included in the trial, ie to
determine how successful randomization was 2) to allow assessment of how well
the different treatment groups are balanced, 3) to allow for analysis per treatment
group, 4) to allow for subgroup analysis in order to assess whether treatment differ-
ences depend on certain patient characteristics. It is this 4
th
purpose that is perhaps
the most controversial because it can lead to ‘data dredging’ or has some wits have
opined, ‘if you interrogate the data enough, you can have it admit to anything’. For
example, Sleight and colleagues, in order to demonstrate the limitations of sub-
group analysis, performed subgroup analysis in the ISIS-2 trial by analyzing treat-
ment responses according to the astrological birth sign of the subject.
30
This
analysis suggested that the treatment was quite effective and statistically significant
for all patients except those born under the sign of Gemini or Libra. The validity of
any subgroup observation tends to be inversely proportional to the number of sub-
groups analyzed. For example, for testing at the 5% significance level (p = .05) an
erroneous statistically significant difference will be reported (on average) 5% of the
time (i.e. false + rate of 5%). But, if 20 subgroups are analyzed, the false positive
rate would approach 64% (Table 3.4, Fig. 3.5).
It is true, that meaningful information from subgroup analysis is restricted by
multiplicity of testing and low statistical power and that surveys on the adequacy of
the reporting of clinical trials consistently find the reporting of subgroup analyses
to be wanting. Most studies enroll just enough participants to ensure that the pri-
mary efficacy hypothesis can be adequately tested, and this limits the statistical
ability to find a difference in subgroup analyses; and, the numbers of subjects avail-
able for subgroup analysis is further compounded by loss of compliance, the need
Table 3.4 Probability of at least one
significant result at the 5% signifi-
cance level given no true differences
Number of tests Probability
1 0.05
2 0.10
3 0.14
5 0.23
10 0.40
20 0.64
Cook D I et al. Subgroup analysis
in clinical trials. MJA 2004; 180:
289–291. © 2004. The Medical
Journal of Australia. Reproduced
with permission.
3 Clinical Trials 47
for adjustments for multiple testing, etc. Some have taken this to mean that sub-
group analyses are useless. When results from a subgroups analysis are at variance
from the overall group outcome, the results are still likely to be true if the subgroup
is large, they are pre-specified rather than post hoc (i.e. ‘after the fact’) and they are
of limited number (not all post hoc analyses are subgroup analyses, but arguably
most are). At the least, whether pre-specified or post hoc subgroup analyses serve
as hypothesis generating questions for subsequent trials. An example where a post-
hoc analysis was not ignored is the Stroke Prevention by Aggressive Reduction in
Cholesterol Levels (SPARCL) study where LIPITOR 80 mg vs placebo was admin-
istered in 4,731 subjects without CHD who had a stroke or TIA within the preced-
ing 6 months.
31
A higher incidence of hemorrhagic stroke was seen in the LIPITOR
80 mg group compared to placebo. Subjects with hemorrhagic stroke on study entry
appeared to be at increased risk for hemorrhagic stroke. As a result, Pfizer revised
the US Prescribing Information for atorvastatin to include a precaution for its use
of 80 mg in patients with prior history of stroke.
What can be said is that if subgroup analysis is used and interpreted carefully, it
can be useful. Even among experts, opinions range from only accepting pre-speci-
fied subgroup analyses supported by a very strong a priori biological rationale, to
a more liberal view in which subgroup analyses, if properly carried out and inter-
preted, are permitted to play a role in assisting doctors and their patients to choose
between treatment options. In reviewing a report that includes subgroup analyses,
Cook et al suggest addressing the following issues (Table 3.5): 1) were the
Fig. 3.5 Probability that multiple subgroup analyses will yield at least one (Red), two (Blue), or
three (Yellow) false positive results
48 S.P. Glasser
subgroups appropriately defined, (that is be careful about subgroups that are based
upon characteristics measured after randomization e.g. adverse drug events may be
more common as reasons for withdrawal from the active treatment arm whereas
lack of efficacy may be more common in the placebo arm); 2) were the subgroup
analyses planned before the implementation of the study (in contrast to after the
study completion or during the conduct of the study); 3) does the study report
include enough information to assess the validity of the analysis eg the number of
subgroup analyses; 4) does the statistical analyses use multiplicity and interaction
testing; 5) were the results of subgroup analyses interpreted with caution; 6) is there
replication of the subgroup analysis in another independent study; 7) was a dose-
response relationship demonstrated; 8) was there reproducibility of the observation
within individual sites; and 9) is there a biological explanation.
Traditional versus Equivalence testing (Table 3.6)
Most clinical trials have been designed to assess if there is a difference in the effi-
cacy to two (or more) alternative treatment approaches (with placebo usually
being the comparator treatment). There are reasons why placebo-controls are pref-
erable to active controls, not the least of which is the ability to distinguish an
effective treatment from a less effective treatment. However, if a new treatment is
Table 3.5 Checklist for subgroup analyses
Design
■
Are the subgroups based on pre-randomisation characteristics?
■
What is the impact of patient misallocation on the subgroup analysis?
■
Is the intention-to-treat population being used in the subgroup analysis?
■
Were the subgroups planned a priori?
■
Were they planned in response to existing trial or biological data?
■
Was the expected direction of the subgroup effect stated a priori?
■
Was the trial designed to have adequate power for the proposed subgroup analysis?
Reporting
■
Is the total number of subgroup analyses undertaken declared?
■
Are relevant summary data, including event numbers and denominators, tabulated?
■
Are analyses decided on a priori clearly distinguished from those decided on a posteriori?
Statistical analysis
■
Are the statistical tests appropriate for the underlying hypotheses?
■
Are tests for heterogeneity (i.e., interaction) statistically significant?
■
Are there appropriate adjustments for multiple testing?
Interpretation
■
Is appropriate emphasis is being placed on the primary outcome of the study?
■
Is the validity of the findings of the subgroup analysis discussed in the light of current
biological knowledge and the findings from similar trials?
Cook D I et al. Subgroup analysis in clinical trials. MJA 2004; 180: 289–291. © 2004. The
Medical Journal of Australia. Reproduced with permission.
3 Clinical Trials 49
considered to be equally effective but perhaps less expensive and/or invasive, or a
placebo-control is considered unethical, then the new treatment needs to be com-
pared to an established therapy and the new treatment would be considered prefer-
able to the established therapy, even if it is just as good (not necessarily better) as
the old. The ethical issues surrounding the use of a placebo-control and the need
to show a new treatment to only be as ‘good as’ (rather than better) has given rise
to the recent interest in equivalence testing. With traditional (superiority) hypoth-
esis testing, the null hypothesis states that ‘there is no difference between treat-
ment groups (i.e. New = Old or placebo or standard therapy). Rejecting the null,
then allows one to definitively state if one treatment is better (or worse) than
another (i.e. New > or < Old). The disadvantage is if at the conclusion of an RCT
there is not evidence of a difference, one cannot state that the treatments are the
same, or as good as one to the other, only that the data are insufficient to show a
difference. That is, when the null hypothesis is not accepted, it is simply the case
where it cannot be rejected. The appropriate statement when the null hypothesis
is not rejected is ‘there is not sufficient evidence in these data to establish if a dif-
ference exists.’
Equivalence testing in essence ‘flips’ the traditional null and alternative
hypotheses. Using this approach, the null hypothesis is that the new treatment is
worse than the old treatment (i.e. New < Old); that is, rather than assuming that
there is no difference, the null hypothesis is that a difference exists and the new
treatment is inferior. Just as in traditional testing, the two actions available result-
ing from the statistical test are 1) reject the null hypothesis, or 2) failure to reject
the null hypothesis. However, with equivalence testing rejecting the null hypothe-
sis is making the statement that the new treatment is not worse than old treatment,
implying the alternative, that is ‘that the new treatment is as good as or better than
the old’ (i.e. New ≥ Old). Hence, this approach allows a definitive conclusion that
the new treatment is as good as the old.
One caveat is the definition of ‘as good as,’ which is defined as being in the
‘neighborhood’ or having a difference that is so small that it is to be considered
clinically unimportant (generally, event rates within +/− 2% – this is known as the
equivalence or noninferiority margin usually indicted by the symbol δ). The need
for this ‘neighborhood’ that is considered ‘as good as’ exposes the first shortcom-
ing of equivalence testing – having to make a statement that ‘I reject the null
Table 3.6 The types of RCTs and there relationship to hypothesis testing
7
RCT type Null hypothesis Alternative hypothesis
Traditional New = Old New ≠ Old (i.e., New
< Old or New > Old)
Equivalence New < Old + δ (where New ≥ Old + δ
δ is a “cushion,” that is that
the new is at least δ worse
than the old)
Non-inferiority New < Old New = Old
50 S.P. Glasser
hypothesis that the new treatment is worse than the old, and accept the alternative
hypothesis that it is as good or better – and by that I mean that it is within at least
2% of the old’ (the wording in italics are rarely included in the conclusions of a
manuscript). A second disadvantage of equivalence testing is that no definitive
statement can be made that there is evidence that the new treatment is worse. Just
as in traditional testing, one never accepts the null hypothesis – one only fails to
reject it. Hence if the null is not rejected, all one can really say is that there is
insufficient evidence in these data that the new treatment is as good as or better
than the old treatment. Another problem with equivalence testing is that one has to
rely on the effectiveness of the active control obtained in previous trials, and on the
assumption that the active control would be equally effective under the conditions
of the present trial.
An example of an equivalence trial is the Controlled ONset Verapamil
INvestigation of Cardiovascular Endpoints study (CONVINCE), a trial that also
raised some ethical issues that are different from those usually involved in RCT’s.
32
CONVINCE was a large double-blind clinical trial intended to assess the equiva-
lence of verapamil and standard therapy in preventing cardiovascular disease-
related events in hypertensive patients. The results of the study indicated that the
verapamil preparation was not equivalent to standard therapy because the upper
bound of the 95% confidence limit (1.18) slightly exceeded the pre-specified
boundary of 1.16 for equivalence. However, the study was stopped prematurely for
commercial reasons. This not only hobbled the findings in terms of inadequate
power, it also meant that participants who had been in the trial for years were sub-
jected to a ‘breach in contract’. That is, they had subjected themselves to the risk
of an RCT with no ultimate benefit. There was a good deal of criticism borne by
the pharmaceutical company involved in the decision to discontinue the study early.
Parenthetically, the company involved no longer exists.
Another variant of equivalence testing is non-inferiority testing. Here the ques-
tion is again slightly different in that one is asking whether the new intervention is
simply not inferior to the comparator (i.e. New <⁄ Old). One advantage is that sta-
tistical significance could be only ‘one-tailed’ since there is no implication that the
analysis is addressing whether the new treatment is better or as good as, only that
it is not inferior. Weir et al utilized this approach in evaluating a comparison of val-
sartin/hydrochlorthiazide (VAL/HCTZ) with amlodipine in the reduction of mean
24-hour diastolic BP (DBP).
33
Noninferiority of the VAL/HCTZ combination to
amlodipine was demonstrated, and fewer adverse events were noted with the com-
bination treatment as well. The null hypothesis for this analysis was that the reduc-
tion in mean 24-hour DBP from baseline to the end of the study with VAL/HCTZ
was ≥ 3 mmHg less (the non-inferiority margin) than that with amlodipine. Again,
a caveat has been recently raised by LeHenanff et al. and Kaul et al.
34, 35
LeHananff
et al
35
reviewed studies published between 2003 and 2004 that were listed as equiv-
alence or noninferiority, and noted a number of deficiencies, key among them being
the absence of the equivalence or non inferiority margin.
35
Equivalence/non-inferiority trials are further discussed in Chapter 4.
3 Clinical Trials 51
Losses to Follow Up
Patients who are lost to follow-up are critical in clinical trials and are particularly
problematic in long-term trials. Patients lost to follow-up might be regarded as hav-
ing had poor results (that is assumed that they experienced treatment failure); so if
there are sufficient numbers of them, trial results can be skewed to less of an effect,
even if, in fact, they did not have poor results. If, in the different study arms, there
are equal numbers lost to follow-up, and they are lost for the same reasons, lost to
follow up would not matter, but this is unlikely to occur. Of course, in ITT analysis,
patients lost-to-follow-up are still counted, but the argument is how to count them.
Some would argue that it is appropriate to count them as poor outcomes since this
will give the most conservative result, while others argue that since their outcome
is not known, they should not be counted. In fact, there is little data reported on the
actual impact on a study result of patients lost to follow up. In one study, Joshi et
al did address this issue in a long-term follow-up (up to 16 years of follow-up) of
patients who had undergone knee arthroplasty. With the concerted effort of full-
time personnel and a private detective, all 123 patients initially lost to follow-up
were traced. Patients cited a variety of reasons why they did not attend follow-up
visits, including: change of residence, inability to travel, displeasure with the physi-
cian or staff, financial constraints, satisfaction with the results so that they did not
feel follow-up was necessary, and poor results. They also found that more women
than men were lost to follow-up.
Surrogate Endpoints
In 1863, Farr said ‘death is a fact, the rest is inference’. In choosing outcomes of interest,
death or a disease event is usually the event of interest. However, it is frequently neces-
sary to use a surrogate for the endpoint of interest, such as when the disease occurrence
is rare and/or far in the future. The main variable that drives sample size and Power is
the difference in the outcome between the intervention and the control group. Table 3.7
summarizes the sample size necessary based upon these aforementioned differences.
One can see from Table 3.7 that most studies would have to be quite large unless the
treatment difference is large, and for most outcomes these days, it is not common to
have treatment differences of more than 20%.
A surrogate endpoint is simply a laboratory value, sign, or symptom that is a
substitute for the real outcome one is interested in.
36
The assumption is that
changes induced in a surrogate endpoint accurately and nearly completely reflect
changes in the clinically meaningful endpoint. To realize that assumption, an accu-
rate well- documented model of the outcome of interest is a prerequisite, but it
should be understood that the model is only that, and the model may be far from
the truth. As is true of most definitions, there is debate about the best definition
for a surrogate endpoint, and it is also important to distinguish surrogate endpoints