Essentials of Clinical Research - part 6 ppsx
Bạn đang xem bản rút gọn của tài liệu. Xem và tải ngay bản đầy đủ của tài liệu tại đây (368.61 KB, 36 trang )
174 S.P. Glasser, S. Duval
treatments; and, addressing what criteria were used to decide that the studies ana-
lyzed were similar enough to be pooled.
Evidence Based Medicine
‘It ain’t so much what we don’t know that gets us into trouble as what we do know that ain’t
so’ (Will Rogers) ()
Meta-analysis and evidence based medicine (EBM) arose together as a result of the
fact that the traditional way of learning (the Historic Paradigm i.e. ‘evidence’ is
determined by the leading authorities in the field-from textbooks, review articles,
seminars, and consensus conferences) was based upon the assumption that experts
represented infallible and comprehensive knowledge. Numerous examples of the
fallibility of that paradigm are present in the literature e.g.:
– Prenatal steroids for mothers to minimize risk of RDS
– Treatment of eclampsia with Magnesium sulfate vs. diazepam
– NTG use in suspected MI
– The use of diuretics for pre-eclampsia
In 1979 Cochrane stated ‘It is surely a great criticism of our profession that we have
not organised a critical summary, by specialty or sub-specialty, updated periodi-
cally, of all relevant randomized controlled trials’.
20
The idea of EBM then was to
devise answerable questions, track down the best evidence to answer them, criti-
cally appraise the validity and usefulness of the evidence, apply the appraisal to
clinical practice, and to evaluate one’s performance after applying the evidence into
practice ( As such, EBM called for the
integration of individual clinical expertise with the best available external evidence
from systematic research (i.e. meta-analysis). One definition of EBM is the consci-
entious, explicit judicious use of current best available evidence in making deci-
sions about the care of individual patients with the use of RCTs, wherever possible,
as the gold standard.
21
EBM also incorporates the need to encourage patterns of
care that does more good than harm.
Someone said, it is not that we are reluctant to use evidence based approaches,
it is that we may not agree on what the evidence is, so why shift to an EBM
approach? The answers are many, but include the fact that the volume of new evi-
dence can be overwhelming (this remains the clinicians biggest challenge), that the
time necessary to keep up is not available, that up-to-date knowledge and clinical
performance deteriorates with time, and that traditional CME has not been shown
to improve clinical performance.
The necessary skills for EBM include the ability to precisely define a patient
problem, ascertain what information is required to resolve the problem, the ability
to conduct an efficient search of the literature with the selection of the most relevant
articles, the ability to determine a study’s validity, extract the clinical message and
10 Meta-Analysis 175
apply it to the patient’s problem. ( There are, of
course criticisms of the EBM approach. For example, some feel that evidence is
never enough i.e. evidence alone can never guide our clinical actions and that there
is a shortage of coherent, consistent scientific evidence. Also, the unique biological
attributes of the individual patient renders the use of EBM to that individual, at best,
limited. For many, the use of EBM requires that new skills be developed in an era
of limited clinician time and technical resources. Finally, who is to say what the
evidence is that evidence based medicine works? Some have asked,” are those who
do not practice EBM practicing ‘non-evidence based medicine’? Karl Popper per-
haps summarized this best when he noted that there are all kinds of sources of our
knowledge but none has authority.
22
EBM is perhaps a good term to the extent that it advocates more reliance on
clinical research than on personal experience or intuition. But, Medicine has always
been taught and practiced based on available scientific evidence and scientific inter-
pretation and the question can be asked whether the results of a clinical trial hardly
deserve the title evidence as questions arise about the statistical and design aspects,
and data analysis, presentation, and interpretation contain many subjective ele-
ments as we have discussed in prior chapters. Thus, even if we observe consistency
in the results and interpretation (a rare occurrence in science) how many times
should a successful trial be replicated to claim proof? That is, whose evidence is the
evidence in evidence based medicine?
In summary, the term EBM has been linked to three potentially false premises;
that evidence has a purely objective meaning in biomedical science, that one can
distinguish between what is evidence and what is lack of evidence, and that there
is evidence based, and non-evidence based medicine. As long as it is remembered
that the term evidence, while delivering forceful promises of truth, is limited in the
sense that scientific work can never prove anything but only serves to falsify, the
term has some usefulness. Finally, EBM does rely upon the ability to perform sys-
tematic reviews (meta-analyses) of the available literature, with all the attendant
limitations of meta-analyses discussed above.
In a “tongue and cheek article, Smith and Pell addressed many of the above
issues in an article entitled “Parachute use to prevent death and major trauma
related to gravitational challenge: systematic review of randomized control tri-
als”.
23
In their Results Section, they note that they were unable to find any RCTs of
“parachute intervention”. They conclude that:
only two options exist. The first is that we accept that under exceptional circumstances,
common sense might be applied when considering the potential risks and benefits of inter-
ventions. The second is that we continue our quest for the holy grail of exclusively evidence
based interventions and preclude parachute use outside of a properly conducted trial. The
dependency we have created in our population may make recruitment of the unenlightened
masses to such a trial difficult. If so, we feel assured that those who advocate evidence
based medicine and criticize use of interventions that lack evidence base will not hesitate
to demonstrate their commitment by volunteering for a double blind, randomized, placebo
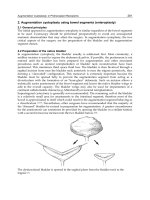
controlled, crossover trail. (See Fig. 10.4)
176 S.P. Glasser, S. Duval
References
1. Meinert CL. Meta-analysis: science or religion? Control Clin Trials. Dec 1989; 10(4
Suppl):257S–263S.
2. Boden WE. Meta-analysis in clinical trials reporting: has a tool become a weapon? Am J
Cardiol. Mar 1, 1992; 69(6):681–686.
3. Oxman AD. Meta-statistics: help or hindrance? ACP J Club. 1993.
4. Goodman SN. Have you ever meta-analysis you didn’t like? Ann Intern Med. Feb 1, 1991;
114(3):244–246.
5. Pearson K. Report on certain enteric fever inoculation statistics. Bri Med J. 1904;
3:1243–1246.
6. Beecher HK. The powerful placebo. J Am Med Assoc. Dec 24, 1955; 159(17):1602–1606.
7. Glass G. Primary, secondary and meta-analysis of research. Educ Res. 1976; 5:3–8.
8. Petitti DB. Approaches to heterogeneity in meta-analysis. Stat Med. Dec 15, 2001;
20(23):3625–3633.
9. Begg CB, Mazumdar M. Operating characteristics of a rank correlation test for publication
bias. Biometrics. Dec 1994; 50(4):1088–1101.
10. Egger M, Smith DG, Altman DG. Systematic Reviews in Health Care: Meta-Analysis in con-
text. London: BMJ Books; 2000.
11. Candelise L, Ciccone A. Gangliosides for acute ischaemic stroke. Cochrane Database Syst
Rev. 2001(4):CD000094.
12. Rosanthal R. File drawer problem and tolerance for the null results. Psychol Bull. 1979;
86:638–641.
13. Smith ML. Publication Bias and Meta-Analysis. Eval Educ. 1980; 4:22–24.
14. Glass G. Meta-Analysis at 25. 2000.
Fig. 10.4 Parachutes reduce the risk of injury after gravitational challenge, but their effectiveness
has not been proved with randomised controlled trials
10 Meta-Analysis 177
15. Higgins JP, Thompson SG, Deeks JJ, Altman DG. Measuring inconsistency in meta-analyses.
BMJ. Sept 6, 2003; 327(7414):557–560.
16. Chalmers I, Hedges LV, Cooper H. A brief history of research synthesis. Eval Health Prof.
Mar 2002; 25(1):12–37.
17. Wells G, Shea B, O’Connell D, et al. The Newcastle-Ottawa Scale (NOS) for assessing the
quality of nonrandomised studies in meta-analyses.
18. Mantel N, Haenszel W. Statistical aspects of the analysis of data from retrospective studies of
disease. J Natl Cancer Inst. Apr 1959; 22(4):719–748.
19. Berlin JA, Colditz GA. The role of meta-analysis in the regulatory process for foods, drugs,
and devices. JAMA. Mar 3, 1999; 281(9):830–834.
20. The Cochrane Library, issue 2. Chichester: Wiley; 2007.
21. Panda A, Dorairajan L, Kumar S. Application of evidence-based urology in improving quality
of care. Indian J Urol 2007; 23(2):91–96.
22. The Problem of Induction (1953, 1974). />23. Smith GC, Pell JP. Parachute use to prevent death and major trauma related to gravitational
challenge: systematic review of randomised controlled trials. BMJ. Dec 20, 2003;
327(7429):1459–1461.
Part II
This Part deals with some of the newer approaches in clinical research, specifically
research methods for genetic studies, diagnostic testing studies, and pharmacoepi-
demiology studies. This Part concludes with a chapter that addresses a newer field
of Implementation Research – that is, how to implement the research findings that
are published, into everyday practice.
On being asked to talk on the principles of research, my first
thought was to arise after the chairman’s introduction, to say,
‘Be careful!’, and then to sit down.
J Cornfield, Am J Ment Def. 1959; 64:240
Chapter 11
Research Methods for Genetic Studies
Sadeep Shrestha and Donna K. Arnett
Abstract This chapter introduces the basic concepts of genes and genetic studies
to clinicians. Some of the relevant methods and issues in genetic epidemiology
studies are briefly discussed with an emphasis on single nucleotide polymorphism
based association studies which are currently the main focus of clinical and trans-
lational genetics.
Genetics is the fundamental basis of any organism so understanding of genetics
will provide a powerful means to discover hereditary elements in disease etiology.
In recent years, genetic studies have shifted from disorders caused by a single gene
(e.g. Huntington’s disease) to common multi-factorial disorders (e.g. hypertension)
that result from the interactions between inherited gene variants and environmental
factors, including chemical, physical, biological, social, infectious, behavioral or
nutritional factors.
A new field of science, Genetic Epidemiology emerged in the 1960s as a
hybrid of genetics, biostatistics, epidemiology and molecular biology, which has
been the major tool in establishing whether a phenotype (any morphologic, bio-
chemical, physiologic or behavioral characteristic of an organism) has a genetic
component. A second goal of genetic epidemiology is to measure the relative size
of that genetic effect in relation to environmental effects. Morton and Chung
defined genetic epidemiology as “a science that deals with the etiology, distribu-
tion, and control of disease in groups of relatives, and with inherited causes of dis-
ease in populations”.
1
In the era of a known human genome sequence, genetic
epidemiology methods have been instrumental in identifying the contribution of
genes, the environment and their interactions to better understanding disease
processes.
Genomic scientists have predicted that comprehensive, genomic-based care will
become the norm, with individualized preventive medicine, early detection of ill-
nesses and tailoring of specific treatments to genetic profile. Practicing physicians
and health professionals need to be knowledgeable in the principles, applications,
and limitations of genetics to understand, prevent, and treat any biological disorders
S.P. Glasser (ed.), Essentials of Clinical Research, 181
© Springer Science + Business Media B.V. 2008
182 S. Shrestha, D.K. Arnett
in their everyday practice. The primary objective of any genetic research is to trans-
late information from individual laboratory specimen and build inferences about
the human genome and its influence on the risk of disease. This chapter will focus
on the fundamental concepts and principles of genetic epidemiology that are impor-
tant to help clinicians understand genetic studies.
Important Principles of Genetics
In the 19th century, long before DNA was known, an Augustinian clergyman,
Gregory Mendel, described genes as the fundamental unit that transmits traits from
parents to offspring. Based on the observations from his cross-breeding experi-
ments in his garden, Mendel developed some basic concepts on genetic information
which still provides the framework upon which all subsequent work in human
genetics has been based. Mendel’s first law is referred to as the independent assort-
ment of alleles (alternate forms of the gene or sequence at a particular location of
the chromosome), which states that two genetic factors are transmitted independ-
ently of each other. His second law is referred to as the independent segregation of
genes which basically states that alleles at one of the parent’s genes segregate
independently of the alleles at another locus. However, Mendel’s law is not always
true and loci physically closer in the same chromosomes tend to transmit together;
this deviation lays the foundation for genetic epidemiology studies as described in
the next section.
All human cells except the red blood cells (RBC) have a nucleus that carries the
individual’s genetic information organized in chromosomes. Given the diploid
nature, each human inherits one copy of the chromosome from the father and the
other from the mother. Humans have 22 pairs of autosomal chromosomes and 2
sex-specific chromosomes (X and Y). Chromosomes are composed of molecules
called deoxyribonucleic acid (DNA) which contain the basic instructions needed to
construct proteins and other cellular molecules.
At the molecular level, DNA is a linear strand of alternating sugars (deoxyri-
bose) and phosphate residues with one of four types of bases attached to the sugar.
All information necessary to maintain and propagate life is contained within these
four simple bases: adenine (A), guanine (G), thymine (T), and cytosine (C). In addi-
tion to this structure of a single strand, the two strands of the DNA molecule are
connected by a hydrogen bond between two opposing bases of the two strands
(T always bonds with A and C always bonds with G) forming a slightly twisted
ladder. It was not until 1953 that James Watson and Francis Creek described this
structure of DNA which became the foundation for our understanding of genes and
disease.
With the knowledge of underlying molecular biology, gene is defined as the part
of the DNA segment that encodes a protein which forms the functional unit of the
“hereditary” factor. The basic length unit of the DNA is one nucleotide, or one
basepair (bp) which refers to the two bases that connect the two strands. In total,
11 Research Methods for Genetic Studies 183
the human DNA contains about 3.3 billion bp and any two DNA fragments differ
only with respect to the order of their bases. Three base units, together with the
sugar and phosphate component (referred to as codons) translate into amino acids.
According to the central dogma of molecular biology, DNA is copied into single
stranded ribonucleic acid (RNA) in a process called transcription, which is subse-
quently translated into proteins. These proteins make intermediate phenotypes
which regulate the biology of all diseases, so any difference in the DNA could
change the disease phenotype. In many species, only a small fraction of the total
sequence of the genome encodes protein. For example, only about 1.5% of the
human genome consists of protein-coding exons (about 30,000–40,000), with over
50% of human DNA consisting of non-coding repetitive sequences. We are still in
the infancy of understanding the significance of the rest of the non-coding DNA
sequence; however the sequence could have structural purposes, or be involved in
regulating the use of functional genetic information.
Units of Genetic Measure
Different genetic markers, which are a segment of DNA with a known physical
location on a chromosome with identifiable inheritance, can be used as measures
for genetic studies. A marker can be a gene, structural polymorphisms (e.g. inser-
tion/deletion) or it can be some section of DNA such as short tandem repeat (STR)
and single nucleotide polymorphism (SNP). Recent advancements in molecular
technology have resulted in the discovery of numerous DNA markers and the data-
base is increasing by day. Polymorphism (poly = many and morphism = form) is a
sequence variation at any locus (any point in the genome) in the population that has
existed for some time and observed in at least 1% of the population, whereas a
mutation is recent and the frequency in populations is less than 1%. The terms
mutation and polymorphism are often used interchangeably. Variants within coding
regions may change the protein function (missense) or predict premature protein
truncation (non-sense) and as a result can have effects ranging from beneficial to
mutual to deleterious. Likewise, although introns (intragenic regions between cod-
ing sequences) do not encode for proteins, polymorphisms can affect intron splic-
ing or expression regulation of adjacent genes. To understand the role of genetic
factors it is important to understand these sequence variations within (population)
and between (family) generations. We briefly describe the significant ones com-
monly used for genetic testing.
STRs: STRs are tandemly repeated simple DNA sequence motifs of —two to
seven bases in length that are arranged head-to-tail and are well distributed through-
out the human genome, primarily in the intragenic regions. They are abundant in
essentially all ethnically and geographically defined populations and are character-
ized by simple Mendelian inheritance. STR polymorphisms originate due to muta-
tions caused by slipped-strand mispairing during DNA replication that results from
either the gain or loss of repeat units. Mutation rates typically range from 10
−3
to
184 S. Shrestha, D.K. Arnett
10
−5
events per gamete per generation, compared to single nucleotide rates of
mutation of 10
−7
to 10
−9
. In humans, STR markers are routinely used in gene
mapping, paternity testing and forensic analysis, linkage and association studies,
along with evolutionary and other family studies. STRs have served as valuable tool
for linkage studies of monogenic diseases in pedigrees, but have limited utility for
candidate gene association studies.
SNPs: SNPs are the variations that occur at a single nucleotide of the sequence.
Ninety percent of the polymorphisms in the genome are single nucleotide polymor-
phisms (SNPs). The human genome contains more than 5.3 million SNPs with a
frequency of 10–50% and about 10 million with frequency >1%. SNPs are the
markers of choice for association studies because of their high frequency, low
mutation rates and the availability of high-throughput detection methods. Most
SNPs are found in the non-coding region and have no distinct biological function,
but may be surrogate markers or be involved in gene expression and splicing. With
few exceptions, the majority of the SNPs are bi-allelic and the genotypes (genetic
makeup at both chromosomes) can be heterozygote (different allele in each chro-
mosome) or homozygote (same allele in both chromosomes) for either allele
(Fig. 11.1).
Recently, it has been found that SNPs alone cannot explain the complete genetic
variations and other structural polymorphisms have been found in higher frequency
in the human genome. It is estimated that 5% of the human genome consists of struc-
AT A CTTA C TCAG T AAC T A
AT G CTTA G TCAG T A GGT A
A
T A CTTA G TCAGC CTAG A G C G
A
T G CTTA C TCAGC CTAGGC C G
AT A CTTA C TCAG CTA AAC T A
AT A CTTA TCAGT CTA AAC T A
A T A CTTA G TCAGC CTAG A G C G
A T A CTTA G TCAGT CTAG A G T G
Haplotypes
Alleles
Locus
T/CG/CG/A
123
A/G
4
Individual 1
Individual 2
Individual 3
Individual 4
Chromosome
CTA
CTA
T
C
////
Fig. 11.1 Alleles and genotypes determined for bi-allelic single nucleotide polymorphisms at
four different loci and the corresponding haplotypes. At locus 1, G and A are the alleles; indi-
viduals 1 and 2 have AG heterozygote genotype and individuals 3 and 4 have AA homozygote
genotype. If the phase is known as shown above, the haplotypes for individual 1 would be ACTA
and GGTA. However, in most cases, the variant loci are not physically close and the assays may
not be able to partition the phase, thus haplotypes are usually estimated with various methods
11 Research Methods for Genetic Studies 185
tural variants which include deletions, duplications, inversions, and rearrangements
of genomic segments. It is estimated that 5% of the human genome is structurally
variable.
Copy number polymorphism: Recent studies have also focused on copy
number variants (CNVs), composed of segmental duplications, large insertion/dele-
tion and inversion of DNA segments 1 kb or larger across the human genome.
2
CNVs are more common in the human genome than originally thought and can
have dramatic phenotypic consequences as a result of altering gene dosage, disrupt-
ing coding sequences, or perturbing long-range gene regulation.
Although there are different genetic markers (as described above), SNPs are the
most frequent variant in the genome and are widely used in genetic studies, so we
will refer to SNP polymorphisms to explain the basic concepts in epidemiology
especially in the context of association studies.
Terms and Basic Concepts in Genetic Epidemiology
Hardy-Weinberg Equilibrium (HWE): HWE is one of the key concepts of popu-
lation genetics that can be used to determine whether a genetic variant could be a
valid marker in genetic epidemiology studies. In HWE, allele and genotype fre-
quencies are related through the Hardy-Weinberg law which states that if two alle-
les, A and a at any locus with frequencies p and q, respectively, are in equilibrium
in a population, the proportions of the genotypes, AA homozyogtes, Aa heterozy-
gotes and aa homozygotes will be p
2
, 2pq, and q
2
respectively as a consequence of
random mating in the absence of mutation, migration, natural selection, or random
drift. One of the implications of HWE is that the allele frequencies and the geno-
type frequencies remain constant from generation to generation maintaining genetic
variation. Extensions of this approach can also be used with multi-allelic and
X-linked loci. Deviation from these proportions could indicate (a) genotyping error
(b) presence of non-random mating, thus bias in the control selection (c) existence
of population stratification (as described later) or (d) recent mutation, migration or
genetic drift that has not reached equilibrium. Cases are more likely to represent the
tail of a distribution of disease, and any putative genetic variant for that disease may
not be in HWE; therefore, it is recommended to assess HWE only in the control
groups.
Linkage and Linkage Disequilibrium (LD): Linkage and linkage disequilib-
rium (LD) are the sine qua non of genetic epidemiology. While genes in different
chromosomes segregate, Thomas Hunt Morgan and his co-workers observed that
genes physically linked to one another on chromosomes of drosophila tended to be
transmitted together. This phenomenon where two genetic loci are transmitted
together from parent to offspring more often than expected under independent
inheritance is termed linkage. Linkage was first demonstrated in humans by Julia
Bell and J.B.S Haldane who showed that hemophilia and color blindness tended to
186 S. Shrestha, D.K. Arnett
be inherited together in some families. Two loci are linked if recombination
(exchange of genetic information between two homologous chromosomes during
meiosis) occurs between them with a probability of less than 50%. Recombination
is inversely related to the physical distance between loci. However, after several
generations, successive recombinations may lead to complete independence even
between loci that are very close together.
LD is defined as the extent of non-random association between two genetic loci
such that the presence of one allele at a locus provides information about the allele
of the other loci. LD occurs in populations as a result of mutation, random genetic
drift, selection, and population admixture. Many different measures of LD have
been proposed in the literature, most of which capture the strength of association
between pairs of SNPs. Although concepts of LD date to early 1900s, the first com-
monly used LD measure, D was developed by Richard Lewontin in 1964.
3
D meas-
ures the departure from allelic equilibrium between separate loci on the same
chromosome that is due to the genetic linkage between them. The other two impor-
tant pairwise measures of LD used in association studies are Lewontin’s D′ and r
2
also denoted as ∆
2
.
For two loci with alleles A/a at the first locus and B/b at the second allele, D is
estimated as follows:
D = p
AB
– p
A
p
B
(1)
The disadvantage of D is that the range of possible value depends greatly on the
marginal allele frequency. D′ is a standardized D coefficient and is estimated as
follows:
D
D
D
´
=
max
(2)
If D > 0, D
max
= min [P
A
(1-P
B
), P
B
(1-P
A
)]
If D < 0, D
max
= min[P
A
P
B
, (1-P
A
)(1-P
B
)]
and r
2
(Ardlie et al.
4
) is the correlation between two loci and is estimated as
follows:
r
D
pppp
AaBb
2
2
=
(3)
Both D′ and r
2
range from 0 (no disequilibrium) to 1 (complete disequilibrium), but
their interpretation is slightly different. In the case of true SNPs, D′ equals 1 if just
two or three of the possible haplotypes are present and is <1 if all four possible
haplotypes are present. On the other hand, r
2
is equal to 1 if only two haplotypes
are present. Association is best estimated using the r
2
because it acts as a direct
correlation to the allele at the other SNP. Additionally, there is a simple inverse
relationship between r
2
and the sample size to detect association between suscepti-
bility loci and SNPs.
Haplotype: Haplotype is a specific combination of alleles along a chromosome
inheriting one from the mother and the other from the father (Fig. 11.1). Recent
11 Research Methods for Genetic Studies 187
studies have shown that the human genome can be parsed into discrete blocks of
high LD interspersed by shorter regions of low or no LD. Only a small number of
characteristic (“tag”) SNPs are sufficient to capture most of the haplotype structure
of the human genome in each block. Tag SNPs are loci that can serve as proxies for
many other SNPs such that only a subset of loci needs to be genotyped to obtain
the same information and power obtained from genotyping a larger number of
SNPs. The SNPs within the same block show a strong LD pattern while those in
different blocks generally show a weak LD pattern. This advantage, along with the
relatively smaller number of haplotypes defined by tag SNPs in each block provides
another way to resolve the complexity of haplotypes.
High LD between adjacent SNPs, also result in a much smaller number of hap-
lotypes observed than the theoretical number of all possible haplotypes (2
n
haplo-
types for n SNPs). There is also biological evidence that several linked variations
in a single gene can cause several changes in the final protein product and the joint
effect can have an influence on the function, expression and quantity of protein
resulting in the phenotype variation. The most robust method to determine haplo-
types is either pedigree analysis or DNA sequencing of cloned DNA. Both of these
methods are limited by data collection of families or intensive laboratory proce-
dures, but the phase (knowledge of the orientation of alleles on a particular trans-
mitted chromosome) of the SNPs in each haplotype can be directly determined.
Haplotypes can also be constructed statistically, although constructing haplotypes
from unrelated individuals is challenging because the phase is inferred rather than
directly measured. Unless all SNPs are homozygous or at most only one hetero-
zygous SNP is observed per individual, haplotypes cannot be discerned. To account
for ambiguous haplotypes, several statistical algorithms have been developed.
Three common algorithmic approaches used in reconstructing population-based
haplotypes are (i) a parsimony algorithm,
5
(ii) a Bayesian population genetic model
that uses coalescent theory,
6
and (iii) a maximum likelihood approach that is based
on expectation-maximization (EM) algorithm,
7
The details of these methods are
beyond the scope of this book, but readers are referred to the book “Computational
Methods for SNPs and Haplotype Inference”
8
for further discussion.
Biological Specimen
Although the focus of this chapter is not on the laboratory methods of specimen
collection, we briefly describe the samples used in clinical studies and their impor-
tance. Clinicians deal with different biological organs and tissues in their everyday
practice. Most of these however may not be an efficient or convenient source for
DNA, the most commonly used resource for genetic studies. Based on factors
including cost, convenience for collection and storage, quantity and quality of the
source, DNA is commonly extracted from four types of biological specimens:
(1) dried blood spots collected in special filter paper (2) whole blood collected in
ethylenediaminetetraacetic acid (EDTA) or other anticoagulants such as heparin
188 S. Shrestha, D.K. Arnett
and acid citrate dextrose (ACD) (3) lymphocytes isolated from whole blood and
EBV-transformed for unlimited source of DNA and (4) buccal epithelial cells col-
lected from swabs or mouth-washes.
Ethical, Legal and Social Implications (ELSI)
Even for well-intentioned research, one can raise legitimate concerns about the
potential misuse of genetic data in regard to social status, employment, economic
harm and other factors. A significant amount of work has been done on ethical,
legal and social implications (ELSI) research of genetics and policies, but ethics
remains an area of major concern. All research protocols can only be conducted
upon approval from an institutional review board (IRB) with an appropriate
informed consent. It is a routine practice to label the samples with unlinked coded
identifiers rather than personal identifiers, so that the individual’s identity is masked
when linking to phenotypic, demographic, or other personal information. The con-
fidentiality of the data needs to be maximized to protect individual privacy.
Measurable Outcome and Phenotype
Phenotype is an observable and measurable trait which can be defined qualitatively
or quantitatively and does not necessarily have to be related to a disease. Some
traits or diseases, like the simple Mendelian traits, have a clear phenotype defini-
tion. However other illnesses, like the psychiatric disorders, are complex to define.
The unclear classification of cases and controls can be a major problem in any study
that can easily introduce biases and inconsistencies between studies. Phenotypes
can be defined qualitatively or measured quantitatively. A qualitative trait can be
categorized into two or more groups. For example, qualitative traits can be dichoto-
mous (e.g. HIV
+
vs. HIV
−
), ordinal (low, average and high blood pressure group) or
nominal (green, black, blue eyes). On the other hand, quantitative measures can be
used as continuous variables such as the height or cholesterol level. It may be diffi-
cult to examine the genetic effect of quantitative measures, however they can be trans-
formed into meaningful qualitative values where the genetic effect can be more
distinct, e.g. the extreme outliers such as dwarfism and hypercholesterolemia.
Some diseases may also have an intermediate phenotype that can be measured with
molecular markers, while others are strictly based on clinical diagnoses. For exam-
ple, blood cholesterol levels which can be precisely measured may be a better out-
come of cardiovascular disease than flu where the symptoms may be heterogenous
in the population and has no intermediate measurement. In other cases environmen-
tal exposures such as detection of virus (e.g. HIV viral load) can define a phenotype
better than the clinical symptoms since virally infected individuals could be asymp-
tomatic for undefined period of time. Likewise, in one case everyone positive for
11 Research Methods for Genetic Studies 189
HIV could be defined as the outcome of interest while in another scenario clinical
symptoms of HIV could define the outcome. Even the ones with the clinical diag-
noses, some have distinct symptoms or signs whereas others do not have clear defi-
nitions. Some diseases, like Alzheimer’s, can have phenotypic heterogeneity, where
the same disease shows different features in different families or subgroups of
patients. Like in any other clinical study, the key to a genetic study is a clear and
consistent definition of the phenotype. The uniformity in phenotype is especially
important in multi-center studies.
General Methods in Clinical Genetic and Genetic
Epidemiology Studies
Over the last two decades epidemiologic methods and approaches have been inte-
grated with those of basic genetics to identify the role of genetic factors in disease
occurrence in families and populations. Family studies examine the rates of dis-
eases in the relatives of proband cases versus the relatives of carefully matched
controls. For many common diseases, the risk to an individual is doubled if a first
degree relative is affected. For rare Mendelian disorders, this risk is very high
(10
3
–10
6
fold) compared to the general population. For a quantitative trait, such as
blood pressure, we can measure correlation of trait values among family members
to derive estimates of heritability.
The first step in clinical or epidemiologic genetic studies is to determine whether
a phenotype of interest is controlled by a genetic component. There are five key
scientific questions that are addressed in sequence in genetic epidemiologic studies
(Fig. 11.2): (1) Is there familial clustering? (2) Is there evidence of genetic effect?
(3) Is there evidence for a particular genetic model? (4) Where is the disease gene?
(5) How does this gene contribute to disease in the general population? The first
three questions do not require DNA data and are referred as phenometric studies,
but the latter two depend on DNA and referred as genometric studies.
(1) Familial Aggregation: The first step to determine whether a phenotype has a
genetic component is to examine the clustering within families. Familial aggre-
gation estimates the likelihood of a phenotype in close relatives of cases com-
pared to the non-cases. If the phenotype is a binary trait, familial aggregation is
often measured by the relative recurrence risk. The recurrence risk ratio is the
ratio of prevalence of the phenotype in relatives of affected cases to the general
population. Greater risk associated with closer degrees of relatedness could also
indicate the genetic component. If the prevalence of the phenotype is higher in
1st degree relatives (father, mother, siblings) versus 2nd degree relatives (uncle
aunt, cousins) it would suggest a genetic component since the 1st degree rela-
tives share more genetic information than the 2nd degree relatives. For example,
Kerber and O’Brien showed a distinctly higher RR for common cancers in the
Utah genealogical and cancer registry of individuals born between 1870 and
190 S. Shrestha, D.K. Arnett
1984.
9
On the other hand, assessment of familial aggregation of a continuous
trait, such as height can be estimated with a correlation or covariance-based
measure such as intrafamily correlation coefficient (ICC). The ICC indicates
the proportion of the total variability in a phenotype that can reasonably be
attributed to real variability between families. Because an increased risk in fam-
ily members does not directly indicate genetic inheritance because of the influ-
ence of the shared familial environment, familial aggregation is necessary but
not sufficient evidence of genetic contribution. It is difficult to disentangle
genetic effect from the environmental effect due to the shared physical environ-
ment. For example, obesity could be due to shared genes within the family or
the eating or physical activity habits in the family.
(2) Genetic Effect: Once the familial aggregation is established, the next step is
to distinguish between genetic and non-genetic familial effects and estimate
the extent of genetic effect. Different variance component models such as
heritability, which is defined as the proportion of variation directly attributa-
ble to genetic differences among relatives to the total variation in the popula-
tion (both genetic and environmental) is traditionally used to estimate the
genetic effect in familial aggregation. Heritability can be estimated both for
qualitative and quantitative traits although it was developed for the latter phe-
notypes. Heritability is however population-specific and must be used with
caution when comparing different populations. Other classical designs for
distinguishing non-genetic family effects from genetic effects have been stud-
ies of twins, adoptees and migrants.
Variant
Gene Location
Genetic Model
Genetic Effect (Heritability)
Familial Aggregation
Study Design
Association studies Population based Case control
Family-based TDT
Linkage studies
Parametric
Non-paramtric
Mode of Inheritance
Segregation Analysis
Heritability &
Variance Component
Recurrence risk ratio
correlations
Incidence in relative vs. population
Phenometric
Genometric
Variant
Gene Location
Genetic Model
Genetic Effect (Heritability)
Familial Aggregation
Variant
Gene Location
Genetic Model
Genetic Effect (Heritability)
Familial Aggregation
Approach
Twins
Adoption
Migration
Fig. 11.2 Systematic designs and approaches in genetic epidemiology studies to identify the
genetic and non-genetic causal of disease
11 Research Methods for Genetic Studies 191
Twin studies: Studies of twins are useful in estimating the contribution to a pheno-
type through the comparison of monozygotic (MZ) pairs (who share all genes) with
dizygotic (DZ) pairs (who share only half of their genes). If family upbringing acts
equally on monozygotic twins as it does on dizygotic twins, then the greater simi-
larity of phenotypes in MZ than DZ twins must be due to genetic factors. A stand-
ard measure of similarity used in twin studies is the concordance rate. For example,
the concordance rate of diabetes Type I is 25–35% among MZ, 5–6% among DZ
twins or siblings and 0.4% among the general population, clearly indicating a
genetic component.
Adoption studies: This study design examines the similarity and differences in
the phenotype in the biological parents and foster parents of adoptees, and in their
biological and adopted siblings. The assumptions are that the similarity between an
adopted child and biological parent is due only to genetic effects, while that
between the adopted child and the adoptive parent or adoptive siblings is due to the
shared environment.
Migration studies: A similar incidence in migrants compared to the aboriginal
population’s incidence suggests a strong environmental factor, whereas similar
incidence to the original ethnic group or relatives in the original residence could
suggest genetic effect. Genes do not change as easily as environment, so the varia-
tion in the phenotype after taking into account of all the common and new environ-
mental factors could point to a genetic effect.
(3) Genetic Model: After the genetic basis is established, the next step is to find
the mode of inheritance which has historically been done using segregation
analyses, although these methods are not as common in the era of SNP associa-
tion studies. Segregation analyses does not use DNA-based genetic data, but
rather, the methods test whether or not the observed phenotype follows a
Mendelian inheritance in the offspring in the pedigree. Mendelian diseases can
be autosomal dominant, autosomal recessive, X-linked dominant, or X-linked
recessive (usually with high penetrance and low frequency of risk alleles).
Traditional segregation analysis has primarily studied simple Mendelian disor-
ders where a single gene mutation is sufficient and necessary to cause a disor-
der. However, most common chronic diseases are regarded as complex where a
large number of genetic variants along with environmental factors interact with
each other (necessary or un-necessary but not sufficient) to affect the disease
outcomes. These diseases usually cluster in families, but do not follow a tradi-
tional Mendelian inheritance pattern. While segregation analyses are powerful
to test different modes of Mendelian inheritance in the family, it is not useful
for complex traits. Linkage and association analysis, both of which utilize
DNA, are more powerful to study genetic effects of complex diseases.
(4) Disease Gene Location:
Linkage studies: Linkage studies focus on concordant inheritance and are used to
identify broad genomic regions that contain gene or genes associated with the phe-
notype, in the absence of previous biologically driven hypotheses. Major genes for
192 S. Shrestha, D.K. Arnett
monogenic traits have been located by linkage analysis. Genetic linkage analysis
tests whether the marker segregates with the disease in pedigrees with multiple
affected according to a Mendelian mode of inheritance and relies entirely on the
tendency for shorter haplotypes to be passed on to the next generation intact, with-
out recombination events at meiosis. If a marker is passed down through family
generation and occurs more commonly in cases than controls, then the marker can
be used as a surrogate for the location of the gene. Genetic linkage analysis test is
formulated as logarithm of the ratio L(θ)/L(θ = 0.5) or lod score, i.e., the likelihood
of observing the segregation pattern of the marker alleles at a given recombination
frequency θ compared with the likelihood of the same segregation pattern in the
absence of linkage.
Two types of linkage analysis can be performed: parametric and nonparametric
analysis. Parametric or model-based linkage analysis by the lod score method
requires a defined model specifying the relationship between the phenotype and the
factors (environmental and genetic), which have an effect on phenotype expression.
For example, such a model can be provided by complex segregation analysis. The
objective of parametric linkage analysis is to estimate the recombination frequency
(θ) and to test whether θ is less than 0.5, which is the case when two loci are geneti-
cally linked. The nonparametric or model-free approach evaluates the statistical
significance of excess allele sharing for specific markers among affected sibs and
does not require information about the mode of disease inheritance. The genes
contributing to the phenotypic variation have been successfully localized by linkage
(cosegregation) analysis for Mendelian diseases that have a strong genetic effect
and are relatively rare. For more complex diseases, usually fine mapping with asso-
ciation studies are carried out to narrow down the putative disease locus after initial
linkage finding.
Association studies: Genetic association studies aim to correlate differences in
allelic frequencies at any locus with differences in disease frequencies or trait lev-
els. We would see a genetic association if the specific genetic variant is more fre-
quent in the affected group than the non-affected group. Most association studies
represent classical case-control approaches where the risk factor under investiga-
tion is the allele at the genetic marker (mostly with SNPs). SNP-based association
studies can be performed in two ways: (i) direct testing of an exposure SNP with a
known varying function such as altered protein structures and (ii) indirect testing of
a SNP which is a surrogate marker for locating adjacent functional variant that
contributes to the disease state (Fig. 11.3a). The first method requires the identifica-
tion of all common variants in coding and regulatory regions of genes. The latter
method avoids the need for cataloguing potential susceptibility variants by relying
instead on association between disease and neutral polymorphisms marking haplo-
types located near a risk-conferring variant. It exploits the phenomenon of linkage
disequilibrium (LD) between alleles of closely linked loci forming haplotypes
within the genomic regions.
Given the diallelic nature of SNPs, a disease locus may be difficult to find unless
the marker is closely linked to the disease locus. Apart from a single SNP associa-
tion strategy, a dense panel of SNPs from the coding and non-coding regions of the
11 Research Methods for Genetic Studies 193
gene that form haplotypes can also be tested in cases and controls. Initial studies
have also demonstrated that the analysis of haplotypes rather than individual SNPs
can detect association with complex diseases. It has been suggested that single
SNP-based candidate gene studies may be statistically weak as true associations
may be missed because of the incomplete information from individual SNPs. For
example, haplotypes contain more heterozygosity than any of the individual mark-
ers that comprise them and also mark more of the variation in the gene than single
SNPs. Several haplotype association studies in the case control design have shown
the power of haplotypes over individual SNPs.
Gene contribution: Once the association of the genetic allele is discovered, it
is important to assess the contribution of this variant to the phenotype. The public
health relevance of a given polymorphism is addressed by estimating the proportion
of diseased individuals in the population that could be prevented if the high-risk
alleles were absent (known as attributable fraction, etiologic fraction, or population
attributable risk percent). Accurate estimation of the population frequency of the
high-risk variant (allele and/or genotype) is important because attributable fraction
is a function of the frequency of the high-risk variant in the population and the
penetrances (i.e., the likelihood that the trait will be expressed if the patient carries
the high-risk variant). Attributable fractions can also be used to estimate the propor-
tion of disease that is a result of the interaction of a genetic variant and an environ-
mental exposure. Genetic variants are not usually modifiable within the longevity
of an individual (although very possible evolutionarily over time); therefore the
prevention of disease will depend on interventions that target environmental factors
that interact with genetic susceptibility to influence the risk of disease.
Candidate Gene vs. Genome-wide Association Studies
Candidate gene approaches examines polymorphisms in genes with functional sig-
nificance related to the phenotype of interest. Some of the candidate genes are also
based on physical location or sequence homology to a gene encoding protein that
b
LD
Causal variant
Phenotype status
Genetic marker
True association
and LD
True risk
Ethnicity
Population
Stratification
a
LD
Causal variant
Phenotype status
Genetic marker
True association
and LD
True risk
Fig. 11.3 True association, LD and the effect of population stratification. (a) Genetic marker that
is in LD with causal variant serves as a surrogate of the true association with the phenotype. (b)
Population stratification is a confounder that leads to spurious association
194 S. Shrestha, D.K. Arnett
is in the etiologic pathway. As attractive as this hypothesis-driven candidate gene
approach is, it focuses exclusively on the relatively few known genes, ignoring
many that have not yet been characterized. One major drawback of candidate gene
approach is that a priori knowledge of the pathogenesis of the disease is required –
when the molecular mechanism is poorly understood, it could lead to selection of
the wrong genes. Even with the right genes within the pathway, the challenge is to
find variants that influence the regulation of gene function. Candidate gene studies
have proven to be more successful when used as a follow-up of linkage studies. For
examples, APOE4, the most common genetic factor associated with Alzheimer’s
disease was primarily discovered by candidate gene approach following the linkage
study which mapped to chromosome 19.
Alternatively, with assurance of adequate power, hypothesis-generating genome-
wide association studies (GWAS) are also being widely used. The GWASs has the
advantage that no a priori knowledge of the structure or function of susceptibility
genes is required. Hence, this approach provides the possibility of identifying genes
that modulate susceptibility to infectious diseases that had previously not been sus-
pected of playing such a biological role. Upon completion of the human genome
project and the draft of the human HapMap project (define genetic variation pat-
terns in individuals from Nigeria (Yoruba), Japan, China and US with European
ancestry), technological advances have led to the identification and cost-effective
high-throughput genotyping arrays of common genetic variants making the GWASs
more promising and attractive. A two step design is being embraced by researchers
where common variation is first screened for association signals using cost-effec-
tive typing of tagging SNPs with GWASs approach followed by denser sets of
SNPs in regions of potentially positive signals. If the sample size is large enough,
a third stage of validation of association can also be conducted with proper power
calculations. Although promising results have been found for different phenotypes
with GWAS, analytical considerations are still underway to develop a robust strat-
egy to interpret the findings especially for complex diseases with multiple gene-
gene and gene-environmental interactions.
Risk Quantification
Gene-gene and gene-environment interaction: A central theme of genetic epide-
miology is that human disease is caused by interactions within and between genetic
and non-genetic environmental factors. Thus in the design and analysis of epidemi-
ologic studies, such interaction needs to be explicitly considered. A simple
approach would be to create a classic 2 × 2 table with genotypes at the two loci
classified as present or absent and compute odds ratios for all groups with one ref-
erence group. The extent of the joint effect of two loci can be compared with the
effects for each locus independently. The same approach can be considered for
gene-environmental interaction for qualitative measurements. However, as more
genes are involved and the environmental exposure is quantitatively measured, the
11 Research Methods for Genetic Studies 195
analysis and interpretation of the interaction can be complicated, but various meth-
ods are being continuously developed. Large sample sizes are needed to observe
true interactions, especially if they are small effects.
Additional Applications of Genetic Studies
Most of the genetic studies (candidate or genome-wide) are focused on case-con-
trol design with the underlying goal of understanding the biological cause of the
disease. Other time dependent studies can be performed to understand the genetic
effect in the natural history or progression of the disease. The outcomes of these
studies are helpful for providing counseling to individuals about their offspring
(genetic screening) or the interaction between environmental factors. However,
there are a growing number of genetic studies examining the differential response
to drugs or vaccines. For instance, pharmacogenetic studies focus on genetic
determinants of individual variation in response to drugs, including variation in
the primary domain of drug action and variation in risk for rare or unexpected
side effects of drugs. Likewise, vaccinogenetic studies examine the genetic
determinants of differential vaccine response and side effects between
individuals.
Major Issues and Limitations in Genetic Studies
In most cases with complex diseases, the effect of any genetic variant is small and
can only be observed in studies with larger sample size or the frequency of the
allele is rare. There are very few common variants (>10% allele frequency) with a
relative risk exceeding two (e.g. APOE and Alzheimer’s disease). A major concern
with respect to genetic association studies has been lack of replication studies,
especially contradictory findings across studies. Replication of findings is very
important before any causal inference can be drawn. The severity of this problem
can be best exemplified in a comprehensive review conducted by Hirschhorn et al.
where they surveyed 600 positive associations (166 associations studied three or
more times) between gene variants and common diseases and showed that only six
were replicated consistently. However, before jumping to the conclusion of the
false positive results, several study design and statistical issues need to be seri-
ously considered when conducting genetic studies which are briefly described
below:
(1) Genetic Heterogeneity: There are several cases where multiple alleles at a
locus are associated with the same disease. This phenomenon is known as
allelic heterogeneity and can be observed with multi-allelic locus. This may
thus explain why in some studies one allele is associated with the disease and
196 S. Shrestha, D.K. Arnett
in other studies it is another allele. Likewise, locus heterogeneity may also exist
where multiple genes influence the disease independently and thus a gene found
to be associated in one study may not be replicated in the other but rather
another gene may be associated.
(2) Confounding: One crucial consideration in genetic studies is the choice of an
appropriate comparison group. In general, as in any well-designed
epidemiological case-control studies, controls need to be sampled from the
same source population as the cases. The use of convenient comparison groups
without proper ascertainment criteria may lead to spurious findings as a result
of confounding caused by unmeasured genetic and environmental factors.
Population stratification can occur if cases and controls have different frequen-
cies of ethnic groups or individuals have differential admixture (the proportions
of the genome that have ancestry from each subpopulation), and when pheno-
types of interest differ between ethnic groups (Fig. 11.3b). Although most
genetic variation is inter-individual, there is also significant inter-ethnic varia-
tion irrespective of disease status. One classic example is reported by Knowler
et al. (1988) who showed spurious inverse association between variants in the
immunoglobulin haplotype Gm3;5,13,14 and non-insulin dependent diabetes
mellitus among the Pima-Papago Indians (Knowler et al., 1988). Individuals
with the haplotype had a higher prevalence of diabetes than those without it
(29% vs. 8%). This haplotype, however measured the subjects’ degree of
Caucasian genetic heritage and when the analysis was stratified by degree of
admixture, the association did not exist.
One way to overcome such issue of confounding by population stratification is
to conduct family based designs with special statistical analyses such as transmis-
sion-disequilibrium test (TDT). Basically, in TDT, alleles of parents not transmitted
to the patients are used as “virtual control” genotypes so any population-level allele
frequency differences become irrelevant. Several other family-based and popula-
tion-based methods have also been derived from TDT. While these methods are
attractive because they correct false positives from population stratification, family-
based samples are difficult to collect and might not be feasible for late-onset dis-
eases where the parents might be deceased. Another approach is to use a
“homogeneous” population. In recent years, there is growing interest to study
genetically isolated populations such as Finland and Iceland. These populations
have been isolated for several years and expanded from a small group of individuals
called “founder population”. Founder population limits the degree of genetic
diversity making more or less a homogenous population. One major limitation of
finding from such isolated population is the generalizability to other populations
which may have different genetic make-ups.
Studies have shown that there is admixture even within such isolated popula-
tions. An alternate method to control for population stratification is to use unrelated
markers from the non-functional region of the genome as indicators of the amount
of background diversity in individuals. The first approach referred as “genomic
control” adjusts the standard χ
2
statistic in the case-control analysis by a scaling
11 Research Methods for Genetic Studies 197
factor based on the degree of stratification measured by the unlinked neutral mark-
ers. The second is the structured-association approach pioneered by Pritchard and
colleagues, which uses Bayesian methods (using programs such as STRUCTURE)
to cluster subjects into homogenous groups using ancestry informative markers
(AIMS) and performing analysis within these groups. AIMs are identified based on
the differences in sequence between the world’s various populations (0.1% of the
human genome).
(3) Genotype Error and Misclassification: For family-based studies (trio data for
TDT), genotyping errors have been shown to increase type I and type II errors
and for population-based (case-control) studies it can increase type II errors and
thus decrease the power. Additionally, misclassification of genotypes can also
bias LD measurements.
In general, genotyping errors could be a result of poor amplification, assay failure,
DNA quality and quantity, genomic duplication or sample contamination. It is
important that a quality-check be performed for each marker and the low-perform-
ance once be removed from the analysis before the results are interpreted. Several
laboratory based methods such as (a) genotyping duplicate individuals (b) genotyp-
ing the same individuals for the same marker using different assay platforms or
(c) genotyping in family pedigrees to check for Mendelian inconsistency, (i.e. the
offspring should share the genetic makeup of the parents and any deviation could
indicate genotype error) can be used to assure the quality of the genotypic data.
Testing for HWE is also commonly used, however it is important to note that devia-
tion from HWE does not necessarily indicate genotype error and could be due to
any of the underlying causes as described earlier.
(IV) Multiple Testing: Regardless of whether each SNP is analyzed one at a time
or as part of a haplotype, the number of individual tests can become very large
and can lead to an inflated (false positive) type I error rate both in candidate
gene approach and whole genome approach. If the selected SNPs are all inde-
pendent, then adjustments to the conventional p-value of 0.05 with Bonferroni
correction could account for the multiple testing. However, given the known
LD pattern between SNPs, such adjustments would overcorrect for the inflated
false-positive rate, resulting in a reduction in power. An alternate method
would be to use the False Discovery Rate (FDR) approach which rather than
correcting the p-value, corrects for fraction of false-positives with the signifi-
cant p-value. When a well defined statistical test is performed (testing a null
against an alternative hypothesis) multiple times, the FDR estimates the
expected proportion of false positives from among the tests declared signifi-
cant. For example, if 100 SNPs are said to be significantly associated with a
trait at a false discovery rate of 5%, then on average 5 are expected to be false
positives. However, the gold standard approach that is being appreciated more
is the permutation testing where the groups status of the individuals are ran-
domly permuted and the analysis repeated several times to get a distribution
for the test statistics under the null hypothesis but this method can also be
computationally intensive and time-consuming.
198 S. Shrestha, D.K. Arnett
Concluding Remarks
The completion of the Human Genome Project in 2003 has heightened expectations
of the health benefits from genetic studies. Methods in genetic epidemiology are
very powerful in examining and identifying the underlying genetic basis of any
phenotype, if conducted properly. There are several study designs that can be used
with a common goal of finding both the individual effects and interactions within
and between genes and environmental exposures that causes the disease. With the
availability of cost-effective high-throughput technologies, currently SNP-based
case-control studies are the widely accepted approach, with some considerations
for CNVs. Regardless of the approach, several design and methodological issues
need to be seriously considered when conducting studies and interpreting the
results (Table 11.1). Although these studies may find association of the phenotype
with a genetic variant, the challenge is to meaningfully translate the findings. In
most instances the alleles are in the non-coding region and the frequencies are rare
but this the stepping stone in the process of understanding the complexity of com-
mon diseases. Very rarely can we find a conclusive evidence of genetic effect from
a single study, so replication studies with larger samples size should be encouraged
to provide insurance against the unknown confounders and biases. To ensure the
biology of the variants, animal studies and gene expression studies can be con-
ducted as follow-up studies. Clinicians need to be aware of the potential role of
Table 11.1 Possible explanations to consider before interpreting the association study results
Outcomes of association studies Possible explanations to consider
Positive association – True causal association
– LD with causal variant
– Confounding by population stratification
– Hardy Weinberg disequilibrium
– Multiple comparison (false positive)
Negative association – No causal association
– Small sample size
– Phenotype misclassification
Multiple genes associated to – Genetic heterogeneity
the same phenotype
– Interactions within and between genes and
environmental factor
– False positive
Multiple alleles at the same gene – Allelic heterogeneity
associated to the same phenotype
– False positive
Same allele in the same gene – Confounding by population stratification
associated with the same phenotype
but in opposite direction
– Phenotype heterogeneity
– False positive
11 Research Methods for Genetic Studies 199
genetics in disease etiology and thus be familiar with methods and issues in con-
ducting genetic epidemiology studies in order to conduct their own studies or assist
other researchers.
Recommended Readings
Hartl DL, Clark AG. Principles of Population Genetics. Sunderland: Sinauer Associates; 2007.
Khoury MJ, Beaty TH, Cohen BH. Fundamentals of Genetic Epidemiology. 4th ed. New York:
Oxford University Press; 1993.
Khoury MJ, Burke W, Thomson, EJ (eds). Genetics and Public Health in the 20th Century. New
York: Oxford University Press; 2000.
Knowler WC, Williams RC, Pettitt DJ, et al. Gm3;5, 13, 14 and type 2 diabetes mellitus: an asso-
ciation in American Indians with genetic admixture. AM J Hum Genetic. Oct 1988; 43(4):
520–526.
Morton, NE. Outline of Genetic Epidemiology. Basel: Karger; 1982.
Ziegler A & Konig IR. Statistical Approach to Genetic Epidemiology: Concepts and Applications.
Weinheim: Wiley-VCH/Verlag/GmbH & Co. KGaA; 2006.
References
1. Morton NE. Genetic Epidemiology. New York: Academic; 1978.
2. Redon R, Ishikawa S, Fitch KR, et al. Global variation in copy number in the human genome.
Nature. Nov 23 2006; 444(7118):444–454.
3. Lewontin RC. The interaction of selection and linkage. I. General considerations; heterotic
models. Genetics. 1964; 49:49–67.
4. Ardlie K, Kruglyak L, Seislstad. Patterns of linkage disequilibrium in the human genome. Nat
Genet. 2002; 3:299–309.
5. Clark AG. Inference for haplotypes from PCR-amplified samples of diploid populations. Mol
Biol Evol. 1990; 7:111–122.
6. Lin S, Cutler D, Zwick M, Chakravarti A. Haplotype inference in random population samples.
Am J Hum Genet. 2002; 71:1129–1137.
7. Excoffier L, Slatkin M. Maximum-likelihood estimation of molecular haplotype frequencies
in a diploid population. Mol Biol Evol. 1995; 12:921–927.
8. Istrail S, Waterman M, Clark AG. Computational Methods for SNPs and Haplotype Inference.
Berlin, Heidelberg: Springer; 2004.
9. Kerber RA, O’Brien E. A cohort study of cancer risk in relation to family histories of cancer
in the Utah population database. Cancer. May 1 2005; 103(9):1906–1915.
Chapter 12
Research Methods for Pharmacoepidemiology
Studies
Maribel Salas and Bruno Stricker
Abstract Pharmacoepidemiology (PE) applies epidemiologic concepts to clinical
pharmacology. This discipline was born on 1960s and since then various methods
and techniques have been developed to design and analyze medications’ data.
1
This chapter will review the factors involved in the selection of the type of pharma-
coepidemiologic study design, and advantages and disadvantages of these designs.
Since other chapters describe randomized clinical trials in detail, we will focus on
observational studies.
Pharmacoepidemiology (PE) is the discipline that studies the frequency and dis-
tribution of health and disease in human populations, as a result of the use and
effects (beneficial and adverse) of drugs. PE uses methods similar to traditional
epidemiologic investigation, but applies them to the area of clinical pharmacology.
1
In this chapter, we discussed general concepts of clinical research with emphasis on
those related to PE.
In the last few years, PE has acquired relevance because of various drug with-
drawals from the market; and, as a result of public scandals related to drug safety
and regulatory issues. Some of these withdrawn and controversial drugs include
troglitazone,
2–4
cisapride,
5,6
cerivastatin,
7–10
rofecoxib,
11–13
and valdecoxib.
13–15
One
of the major allegations cited with each of these drug withdrawals were flaws in the
study designs that were used to demonstrate drug efficacy or safety. Furthermore,
the study designs involved with these withdrawn drugs were variable and reported
conflicting results.
16
An example of the controversies surrounding drug withdraw-
als is the association of nonsteroidal antiinflamatory drugs (NSAID) with chronic
renal disease.
17–21
The observation that one study may produce different results from
another, presumably similar study (and certainly from studies of differing designs)
is, of course, not unique to PE, as has been discussed in prior chapters.
This chapter will review the factors involved in the selection of the type of phar-
macoepidemiologic study design, and advantages and disadvantages of these
designs. Since other chapters describe randomized clinical trials in detail, we will
focus on observational studies.
S.P. Glasser (ed.), Essentials of Clinical Research, 201
© Springer Science + Business Media B.V. 2008