Essentials of Neuroimaging for Clinical Practice - part 7 pptx
Bạn đang xem bản rút gọn của tài liệu. Xem và tải ngay bản đầy đủ của tài liệu tại đây (838.53 KB, 17 trang )
84 ESSENTIALS OF NEUROIMAGING FOR CLINICAL PRACTICE
resting rCBF or rCMR across populations. To date,
these studies have been used only in research applica-
tions, given that differences across populations are
usually not detectable in an individual scan; rather,
pooling of subjects is required. Neutral-state studies
have demonstrated that groups of patients with major
depression show decreased rCBF or rCMR in frontal
regions compared with control populations (Figure 3–
8) and that groups of patients with obsessive-compul-
sive disorder demonstrate increased rCBF or rCMR in
orbitofrontal cortex and the head of the caudate nu-
cleus.
Although neutral-state studies have provided a
great deal of valuable information regarding the patho-
physiology of numerous psychiatric illnesses, studies
that assess brain function during specific tasks may be
a more powerful tool. Just as electrocardiogram data
collected during a cardiac stress test may uncover car-
diac abnormalities not detectable with a resting electro-
cardiogram, functional neuroimaging studies that use
activation paradigms may be more sensitive than neu-
tral-state studies. Of course, these studies may be con-
ducted in patient populations and in healthy volun-
teers. SPECT is not as useful for these activation
studies as PET or fMRI (see Chapter 4 in this volume
for a more detailed description of fMRI), because gen-
erally only one image can be collected per day with
SPECT. By comparison, the use of
15
O-labeled radio-
pharmaceuticals with PET permits investigators to
conduct numerous studies in a single day. Because the
half-life of
15
O is approximately 2 minutes, all radioac-
tivity dissipates within approximately 10 minutes (5
half-lives) and another study may then be performed.
Therefore, as many as 12 separate
15
O PET studies may
be conducted in a single individual within a few hours.
Subjects are asked to perform various tasks, including
activation and baseline tasks, during separate studies.
For example, subjects may be instructed to follow a
moving target with their eyes during one study, to
watch a fixed target during another study, and to close
their eyes during yet another study. By pooling data
across subjects and then subtracting the baseline stud-
ies from the activation studies, investigators can deter-
mine which brain regions are involved in mediating
the activation task (Figure 3–9). Again, as an example,
if the closed-eye studies described earlier are sub-
tracted from the fixed-target studies, the difference
should reflect which brain regions are involved in
looking at a fixed target. The number of activation
tasks that can be employed in such studies is limitless;
Figure 3–7. Positron emission tomography studies with
18
F-DOPA, a radiopharmaceutical used to measure
presynaptic dopamine synthesis.
The degree of binding of this radiopharmaceutical in the striatum is a marker for the number of intact dopam-
inergic neurons in this brain region. As these images indicate, there is far less binding of
18
F-DOPA in the stria-
tum of the patient with Parkinson’s disease in comparison with the healthy volunteer.
PET and SPECT 85
Figure 3–8. Coronal and sagittal sections showing a region of decreased glucose metabolism in depressed
patients relative to control subjects.
CC=corpus callosum; PFC=prefrontal cortex.
Source. Reprinted from Drevets WC, Price JL, Simpson JR Jr, et al.: “Subgenual Prefrontal Cortex Abnormalities in Mood Disor-
ders.” Nature 386:824–827, 1997. Copyright 1997, Macmillan Publishers Ltd. Used by permission from Nature (www.nature.com/
nature).
Figure 3–9. Illustration of the methodology for positron emission tomography (PET) activation studies using
blood flow tracers.
A series of scans are acquired in activated and control states and are subtracted to produce a difference image.
A statistical test is applied to the data to determine which changes in the difference image are statistically sig-
nificant. This example shows the robust response to a hemifield stimulation of the visual system with a reversing
checkerboard pattern in a PET study that used [H
2
15
O] as the tracer. The activated area in the visual cortex can
be clearly seen.
Source. Reprinted from Cherry SR, Phelps ME: “Imaging Brain Function With Positron Emission Tomography,” in Brain Mapping:
The Methods. Edited by Toga AW, Mazziotta JC. San Diego, CA, Academic Press, 1998. Copyright 1998, Elsevier Science Inc. (www.
elsevier.com). Used with permission.
86 ESSENTIALS OF NEUROIMAGING FOR CLINICAL PRACTICE
such paradigms have included cognitive tasks (e.g.,
tests of memory), affective tasks (e.g., eliciting various
emotions with pictures, film, or audiotape), symptom
provocation studies (e.g., inducing panic attack symp-
toms), and symptom capture studies (e.g., analyzing
data to compare profiles associated with the presence
of a spontaneous event, such as auditory hallucina-
tions or motor tics).
Finally, whereas the research paradigms described
in this section have the potential to further our knowl-
edge of the pathophysiology of psychiatric illnesses,
functional neuroimaging can also be used to assess
treatment. Such assessment can be accomplished in two
ways. First, a baseline functional neuroimaging study
can be conducted before subjects begin treatment. This
baseline functional neuroimaging study may consist
of a single neutral-state study or a number of activa-
tion studies. After subjects have completed the treat-
ment trial, an analysis can be performed to determine
whether rCBF or rCMR in different brain regions corre-
lates with treatment response. This may be done in a
categorical manner or by using continuous variables.
The categorical analysis simply consists of dividing the
cohort into responders and nonresponders and then
comparing the two groups of scans. The differences cor-
respond to brain regions where increased or decreased
rCBF or rCMR at baseline correlates with subsequent
treatment response or nonresponse (Figure 3–10). In the
Figure 3–10. Categorical analysis of treatment response.
Shown are superimposed positron emission tomography scans and magnetic resonance images, sagittal view,
from two groups of depressed patients compared with healthy control subjects. The z-score maps demonstrate
differences in direction, magnitude, and extent of changes seen in rostral cingulate (Cg24a) glucose metabolism
in patients versus control subjects. Cingulate hypometabolism (negative z values, shown in green) characterized
the nonresponder group, whereas hypermetabolism (positive z values, shown in yellow) was seen in those who
eventually responded to treatment.
Source. Reprinted from Mayberg HS, Brannan SK, Mahurin RK, et al.: “Cingulate Function in Depression: A Potential Predictor
of Treatment Response.” Neuroreport 8:1057–1061, 1997. Copyright 1997, Lippincott Williams & Wilkins (www.lww.com). Used with
permission.
PET and SPECT 87
continuous-variable analysis, all subjects are pooled to-
gether, and the degree of treatment response (e.g., per-
centage change in Beck Depression Inventory scores
following treatment) is entered as a covariate for each
individual study. This continuous-variable analysis re-
veals brain regions where baseline rCBF or rCMR posi-
tively or negatively correlates with subsequent treat-
ment response (Figure 3–11). The second way to use
functional neuroimaging to assess treatment is to col-
lect PET or SPECT data both before and after treatment.
All of the analyses described above can be conducted
with the baseline data. However, the pooled pretreat-
ment functional neuroimaging data can be compared
with the posttreatment data to determine whether
changes occur that may provide clues about the mecha-
nism of action of the treatment being studied.
Figure 3–11. Continuous-variable analysis of treatment response.
The upper panels show the locations of significant positive correlations between positron emission tomography
measurements of regional cerebral blood flow (rCBF) in the posterior cingulate cortex bilaterally and subse-
quent fluvoxamine response as measured by percentage change in the Yale-Brown Obsessive Compulsive Scale
(Y-BOCS) score, superimposed over the SPM99 (Statistical Parametric Mapping 99 [software program]) tem-
plate in MNI (Montreal Neurological Institute) space for anatomic reference. The lower panels show the actual
corresponding plots of percentage Y-BOCS improvement versus rCBF.
Source. Reprinted from Rauch SL, Shin LM, Dougherty DD, et al.: “Predictors of Fluvoxamine Response in Contamination-Related
Obsessive Compulsive Disorder: A PET Symptom Provocation Study.” Neuropsychopharmacology 27:782–791, 2002. Copyright 2002,
American College of Neuropsychopharmacology. Used by permission of Elsevier Science (www.elsevier.com).
88 ESSENTIALS OF NEUROIMAGING FOR CLINICAL PRACTICE
Neurochemistry
As described earlier, PET and SPECT can be used to char-
acterize various aspects of neurotransmitter function
(Figure 3–12). Table 3–3 presented a partial list of radio-
pharmaceuticals available for PET and SPECT studies
and also indicated which aspect of neurotransmitter
function each measures. If one views the results of a PET
or SPECT neurochemistry study as equivalent to rCBF or
rCMR data in the sense of paradigm design, it becomes
evident that many of the studies described in the previ-
ous section could be conducted with neurochemistry
data collected during PET or SPECT studies. For exam-
ple, one could characterize 5-HT
2
receptors at rest in a
population of patients with major depression and a pop-
ulation of healthy volunteers and compare the two
groups; this would be equivalent to a neutral-state study.
Activation studies with PET or SPECT neurochem-
istry data can also be conducted. However, given the
longer half-lives of
11
C and
18
F and the length of time
required to conduct a single PET or SPECT neurochem-
istry study (approximately 90 minutes), generally only
two such studies could be conducted on a single day. A
baseline (resting or neutral state) PET or SPECT neuro-
chemistry study is typically conducted first, followed
by a second study identical to the first except that some
type of perturbation is introduced during the second
study. Examples include administration of a drug, as-
signment of a cognitive or affective activation task, or
introduction of a form of external manipulation such as
acupuncture. Thus, if 5-HT
2
receptor binding is deter-
mined first at rest and then during infusion of a drug,
the two PET or SPECT studies can be compared with
each another to determine the effect of the drug on 5-
HT
2
binding. Along these same lines, PET or SPECT
neurochemistry studies can be conducted before treat-
ment or both before and after treatment, and all of the
analyses employed in other functional neuroimaging
studies designed to assess treatment can be used to an-
alyze the PET or SPECT neurochemistry data.
Finally, PET and SPECT neurochemistry studies
have the potential to play an important role in drug de-
velopment, given that their methodologies are ideally
suited for in vivo pharmacokinetic and pharmacody-
namic studies. For example, a candidate molecule may
be directly labeled with a radionuclide and injected into
Figure 3–12. Schematic demonstrating steps involved in conducting a positron emission tomography study
employing a radiopharmaceutical designed for neuroreceptor characterization.
Source. Reprinted from Sedvall G, Farde L, Persson A, et al.: “Imaging of Neurotransmitter Receptors in the Living Human Brain.”
Archives of General Psychiatry 43:995–1005, 1986. Copyright 1986, American Medical Association. Used with permission.
PET and SPECT 89
an animal or human subject as acquisition of PET or
SPECT data is initiated (Figure 3–13). This allows the in-
vestigator to determine where in the brain the drug lo-
calizes, establish a dose-to-receptor occupancy curve,
and assess the time course of clearance from the brain.
The latter two pieces of information may be especially
important for determining dose strength and dosing
schedule. If the candidate molecule cannot be directly
labeled with a radionuclide, an indirect method may
be used (Figure 3–14). In this case, a baseline PET or
SPECT study is performed with an existing radiophar-
maceutical. The unlabeled drug is then administered,
following which another PET or SPECT study is con-
ducted with the same radiopharmaceutical. For exam-
ple, a candidate drug may be known to bind to 5-HT
2
receptors in vitro. A baseline PET study is performed
with
18
F-setoperone, which is known to bind to 5-HT
2
receptors. Next, the PET study is repeated, but after ad-
ministration of the unlabeled drug. The unlabeled drug
will compete with
18
F-setoperone for the 5-HT
2
binding
sites. The quantitative difference between the two stud-
ies in
18
F-setoperone binding as measured by the PET
camera represents the degree of binding of the unla-
beled drug to 5-HT
2
receptors.
Figure 3–13. Direct method of drug evaluation: BMS-181101, a compound under development as a potential
antidepressant, fails to demonstrate in vitro effects on serotonergic receptors.
A positron emission tomography study conducted to assess in vivo distribution of BMS-181101 in the central
nervous system (CNS) used BMS-181101 labeled with the radionuclide
11
C. The images show the distribution
of
11
C-BMS-181101 in the brain after high- (top row) and low- (bottom row) specific-activity (SA) injections. Note
that there is no significant difference in the amount of specific binding between the high- and low-SA studies.
These results indicate that the CNS distribution of
11
C-BMS-181101 is dominated by blood flow and that signif-
icant receptor-specific localization does not occur in any brain region. Further development of this drug was
subsequently halted.
Source. Reprinted from Christian BT, Livni E, Babich JW, et al.: “Evaluation of Cerebral Pharmacokinetics of the Novel Antide-
pressant Drug, BMS-181101, by Positron Emission Tomography.” Journal of Pharmacology and Experimental Therapeutics 279(1):325–
331, 1996. Copyright 1996, American Society for Pharmacology and Experimental Therapeutics. Used with permission.
90 ESSENTIALS OF NEUROIMAGING FOR CLINICAL PRACTICE
Figure 3–14. Indirect method of drug evaluation: Ziprasidone, a novel antipsychotic, shows a high affinity for
serotonin 5-HT
2
receptors in vitro.
This study was conducted to determine the time course of 5-HT
2
receptor occupancy in healthy humans follow-
ing a single oral dose of ziprasidone. Positron emission tomography (PET) studies with
18
F-setoperone, a ra-
diopharmaceutical that selectively binds to 5-HT
2
receptors, were conducted in a group of healthy volunteers,
first during a baseline state and then after a 40-mg dose of ziprasidone. Shown are transverse, sagittal, and
coronal PET images of the brain of a healthy subject before (upper row) and 4 hours after (lower row) oral admin-
istration of 40 mg of ziprasidone. Note the marked decrease in
18
F-setoperone accumulation following dosing
with ziprasidone, indicating displacement of
18
F-setoperone from 5-HT
2
binding sites.
Source. Reprinted from Fischman AJ, Bonab AA, Babich JW, et al.: “Positron Emission Tomographic Analysis of Central
5-Hydroxytryptamine
2
Receptor Occupancy in Healthy Volunteers Treated With the Novel Antipsychotic Agent, Ziprasidone.”
Journal of Pharmacology and Experimental Therapeutics 279(3):939–947, 1996. Copyright 1996, American Society for Pharmacology and
Experimental Therapeutics. Used with permission.
PET and SPECT 91
Future Directions
PET and SPECT technology has advanced consider-
ably in recent decades. Although still used primarily
for research in the psychiatric setting, PET and SPECT
demonstrate growing promise for the clinical setting.
Ongoing studies are examining the potential role of
PET and SPECT in diagnosis and in predicting treat-
ment response. As PET and SPECT technology contin-
ues to evolve, these potential clinical applications may
come to fruition.
References/Suggested
Readings
Cherry SR, Phelps ME: Imaging brain function with positron
emission tomography, in Brain Mapping: The Methods.
Edited by Toga AW, Mazziotta JC. San Diego, CA, Aca-
demic Press, 1996, pp 191–222
Dougherty DD, Rauch SL (eds): Psychiatric Neuroimaging
Research: Contemporary Strategies. Washington, DC,
American Psychiatric Publishing, 2001
Fischman AJ, Alpert NM, Babich JW, et al: The role of positron
emission tomography in pharmacokinetic analysis. Drug
Metabolism Review 29(4):923–956, 1997
Petrella JR, Coleman RE, Doraiswamy PM: Neuroimaging
and early diagnosis of Alzheimer disease: a look to the fu-
ture. Radiology 226:315–336, 2003
Reiman EM, Caselli RJ, Chen K, et al: Declining brain activ-
ity in cognitively normal apolipoprotein E epsilon 4 het-
erozygotes: a foundation for using positron emission to-
mography to efficiently test treatments to prevent Alz-
heimer's disease. Proc Natl Acad Sci U S A 98:3334–3339,
2001
Renshaw PF, Rauch SL: Neuroimaging in clinical psychiatry,
in The Harvard Guide to Psychiatry, 3rd Edition. Edited
by Nicholi AM Jr. Cambridge, MA, Belknap Press, 1999,
pp 84–97
Silverman DH, Small GW, Chang CY, et al: Positron emission
tomography in evaluation of dementia: regional brain me-
tabolism and long-term outcome. JAMA 286:2120–2127,
2001
This page intentionally left blank
93
4
Functional Magnetic
Resonance Imaging
Robert L. Savoy, Ph.D.
Randy L. Gollub, M.D., Ph.D.
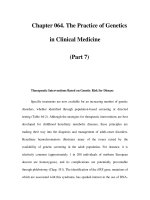
The tremendous advances in noninvasive brain-imag-
ing technology described in this volume have the po-
tential to aid clinicians in the diagnosis of psychiatric
illness and to guide and monitor treatment of psychiat-
ric disease. Several attributes of functional magnetic
resonance imaging (fMRI) suggest that this particular
imaging modality will be critically important to the re-
alization of this potential. These attributes include
safety, reliability, and high spatial and relatively high
temporal resolution across the entire brain. One criti-
cally important consequence of these attributes is that
it is feasible for subjects to be imaged repeatedly over
time, thus greatly expanding the range of longitudinal
study designs that can directly assess the pathophysi-
ology of psychiatric symptoms. The power of fMRI to
reveal information about the function of the brain is
greatly increased by integrating fMRI data collected
during an experimental paradigm with data collected
during an identical paradigm with other imaging tools
that have greater temporal resolution, such as electro-
encephalography (EEG) or magnetoencephalography
(MEG)—a strategy known as multimodal integration.
These attributes of fMRI allow the clinician-scientist to
probe, in awake, active human subjects, the complex
neuronal systems that form the substrate for normal
and disordered cognition, emotion, and behavior.
fMRI uses no ionizing radiation, and there are no
other known harmful effects of imaging performed within
U.S. Food and Drug Administration (FDA)–approved
guidelines; thus, fMRI can be repeated safely with indi-
vidual subjects over time. Importantly, investigators
have demonstrated a high degree of consistency in the
detected locations of brain activity in individual healthy
subjects participating in serial scanning sessions and in
healthy subject groups studied across different labora-
tories when the same experimental paradigm is em-
ployed. This consistency suggests that investigators will
be able to study within-subject changes in patterns of
brain activity related to clinical state (e.g., subjects with
bipolar disorder could potentially be imaged while per-
forming the same cognitive task during euthymic, de-
pressed, and manic phases of illness). Similarly, it will
94 ESSENTIALS OF NEUROIMAGING FOR CLINICAL PRACTICE
be possible to follow changes in brain activity during
the progression from symptom exacerbation to remis-
sion. And this means that developmental changes in
patterns of brain activity can be studied in both healthy
and neuropsychiatrically ill subjects. It is important to
note, however, that when compared with matched
healthy cohorts, psychiatric populations are frequently
found to have a marked increase in the variance in fMRI
results, including measures of test–retest reliability. This
increased variance is likely to be of clinical significance
and is deserving of direct investigation.
At the field strength of typical magnetic resonance
research magnets (1.5 tesla [T] to 3 T), it is quite a
straightforward matter to collect image data from the
entire brain. The value of whole-brain mapping is that
in addition to testing hypotheses generated from ani-
mal research and functional localization studies corre-
lating brain lesions with impairments in function, in-
vestigators can detect previously unsuspected brain
activity associated with a cognitive, emotional, or be-
havioral task. Identification of the more widespread
network of involved brain regions is especially critical
to the study of psychiatric illness that is not necessarily
a result of fixed or discrete lesions. For example, mul-
tiple groups of investigators in recent fMRI studies of
working memory in schizophrenia have identified
subtle shifts in specific subregions of the prefrontal cor-
tex, as well as recruitment of subcortical basal ganglia
structures, in patients with schizophrenia, compared
with matched healthy control subjects.
The spatial resolution of typical fMRI data is on
the order of millimeters (mm), even for whole-brain
mapping. This resolution increases with higher field
strength, at the cost of a more restricted field of view
(partial-brain mapping), and is likely to improve over
time as imaging technology advances. With currently
available spatial resolutions, mapping of activity in the
cortex is absolutely feasible, at a level of precision that
is close to what a neuropathologist can achieve in post-
mortem specimens. Such mapping is considerably
more difficult in subcortical and brain-stem structures,
where functional units (nuclei) are smaller. Despite
providing limited information on subcortical struc-
tures, the spatial resolutions achievable in current
studies are still highly relevant for psychiatrists, given
the clear association between cortical dysfunction and
many neuropsychiatric symptoms.
Neurons, the basic unit of brain function, have re-
solvable activity in the millisecond range. By contrast,
the temporal resolution of fMRI data is on the order of
seconds. The temporal resolution of fMRI is an essen-
tial consequence of the fact that measured fMRI signals
are the hemodynamic response to changes in neuronal
activity. However, with proper attention to experimen-
tal design, it is quite feasible to use the temporal reso-
lution of fMRI data to distinguish the functional inter-
play within brain regions that comprise a network.
And by employing the latest technology to obtain—ei-
ther simultaneously or sequentially—matching electri-
cal recordings (EEG or MEG) and performing multi-
modal integration analysis, it is possible to elucidate
cortical spatiotemporal dynamics of the finest scale.
The first such studies in healthy subjects are beginning
to emerge; the translation toward clinical utility will
follow.
Increasing numbers of studies are using neuroim-
aging modalities to probe psychiatric illness. To intelli-
gently assess the strengths and weaknesses of these
new studies, the practicing psychiatric clinician must
have a fundamental understanding of how fMRI stud-
ies are designed, implemented, and analyzed. Such
knowledge is especially valuable today, a period dur-
ing which brain-imaging technology is rapidly evolv-
ing with respect to methods of data acquisition and
analysis. Our goal in this chapter is to acquaint the
reader with the basic terminology and concepts in-
volved in the conduct of fMRI studies. We seek to pro-
vide a clear explanation and critical appraisal of the
fMRI data acquisition, analysis, and experimental de-
sign methods most commonly employed in studies of
cognition, emotion, and behavior. Most of the pub-
lished fMRI studies have been performed with cohorts
of healthy subjects. A number of fMRI studies have
also been conducted in cohorts with psychiatric illness.
At present, most of these studies are confined to the
realm of investigating the neurobiological mechanism
underlying specific symptoms (e.g., auditory halluci-
nations or working memory deficits in schizophrenia)
and have not yet reached a level of maturation required
for clinical utility as diagnostic or prognostic markers.
It is worth noting here that functional neuroimag-
ing provides a powerful bridge between the fields of
neurology and psychiatry. The greatest gains in knowl-
edge from use of these tools will come from individu-
als or groups that incorporate all that is known about
both the structure and function of the brain in the ex-
perimental design and analysis of neuroimaging data.
Basic Physical Principles
The detection of the physical phenomenon known as
nuclear magnetic resonance (NMR) can be combined
Functional Magnetic Resonance Imaging 95
with a technology called magnetic resonance imaging
(MRI) to create three-dimensional pictures of the
human brain. Conventional MRI creates structural im-
ages of the brain at high spatial resolution (typically
1 mm × 1 mm × 1 mm). fMRI, in this context, refers to
the detection of changes in blood flow, or blood oxy-
genation, that are triggered by neural events; these
changes are typically imaged at lower spatial resolu-
tion. Chapter 2 in this volume describes basic princi-
ples of NMR and MRI. Although these are briefly re-
viewed in the following subsection, the emphasis here
is on the specifics of fMRI. (See the Annotated Bibliog-
raphy at the end of this chapter for pointers to more
detailed accounts of the technology.)
Brief Review of NMR and MRI
Prior to generation of the NMR signal, the subject is
first placed within a strong magnetic field. This aligns
a fraction of the hydrogen nuclei (single protons) in the
body. Application of a radio frequency (RF) pulse of
magnetic energy, presented at the frequency of the pre-
cession (i.e., the resonant frequency) of the hydrogen
nuclei in water molecules, causes all of those nuclei to
change orientation relative to the strong magnetic
field. This change in orientation of the nuclei causes the
net magnetization to precess around an axis parallel to
the main magnet, thus generating a sinusoidally oscil-
lating electric current in a coil of wire placed around
the subject’s head. This oscillating current is the source
of what is called the NMR signal.
The NMR signal decays over time for several rea-
sons. First, the protons slowly (on a time scale of sec-
onds for most brain tissue) realign with the main field
in the magnet. This realignment is called longitudinal
relaxation, and the time constant associated with this
exponential process is called T1. Second, the signal
generated by the collection of precessing protons is
weakened by the fact that each individual proton expe-
riences a slightly different local magnetic field as a re-
sult of interactions with nearby water molecules and
other biological tissues, and thus precesses at a fre-
quency slightly different from that of its neighbors.
Consequently, these precessing protons fall out of
phase with each other (typically on a time scale of
tenths of seconds for most brain tissue), so that their re-
spective magnetic fields are no longer lined up and
therefore do not generate a detectable, macroscopic
signal in the surrounding coil of wire. This aspect of
NMR signal decay is sometimes called the “spin-spin
component of transverse relaxation,” because it is based
on the interaction of the spins (which imply magnetic
fields) of nearby nuclei.
If the magnetic field were perfectly uniform, the net
decay rate of the signal would be equal to the exponen-
tial decay rate, T2, which is driven by the combination
of spin-spin transverse relaxation and the T1 longitudi-
nal component. (In the brain tissue of interest, T2 is al-
most entirely determined by the spin-spin relaxation
rather than the longitudinal component.) In reality,
there are other sources of magnetic field nonunifor-
mity. Imperfections in the main field of the magnet and
variations in the magnetic susceptibilities of the differ-
ent parts of the human body that have been placed
within the magnetic field contribute to nonuniformi-
ties in the magnetic field experienced by the precessing
protons. Most important for fMRI, some chemicals that
occur naturally in the body also distort the magnetic
field. Deoxyhemoglobin is such a molecule, and be-
cause its local concentration varies, the amount of dis-
tortion also varies. The rate of exponential decay of the
NMR signal is influenced by all of these factors.
Neural Activation, Contrast, and fMRI
Anything causing a change in the NMR signal in a
given voxel relative to other voxels at the same time is
a source of image contrast. In an analogous fashion,
changes in the NMR signal at a fixed voxel at different
times are interpreted as functional contrast. Changing
hemodynamics, coupled with the flexibility of MRI,
has permitted the detection of functional contrast in
three different ways. Historically, changes in blood vol-
ume were used as a source of contrast in the first human
fMRI study. Today, two other hemodynamically based
contrast mechanisms are used in studies of neural acti-
vation: the first depends on detecting changes in blood
flow, and the second depends on detecting changes in
blood oxygenation. These three contrast mechanisms—
blood volume, flow, and oxygenation—and their rela-
tion to MRI are described in the following paragraphs.
In the earliest fMRI studies, exogenous contrast
agents—chemicals injected into the bloodstream of the
subject, such as gadolinium—were used to enhance
contrast. These bloodborne chemicals produced local
distortions in the magnetic field, thus allowing in-
creases in cerebral blood volume to be detected. Subse-
quent studies demonstrated that endogenous contrast
agents (i.e., naturally occurring molecules in the body,
such as deoxyhemoglobin in the blood) could also
yield sufficient contrast between different states of
neural activity. The use of endogenous contrast agents
96 ESSENTIALS OF NEUROIMAGING FOR CLINICAL PRACTICE
obviated the need for injecting foreign molecules into
the bodies of healthy subjects, and this is one of the key
reasons that fMRI has become so popular as a tech-
nique for assessing human brain function.
When neurons are active in a region of brain, blood
flow and blood volume local to that region of activity
increase. The idea is that when fresh blood flows into
the slice of the brain that is being imaged, it will have a
different “spin history” (i.e., it will not have recently
been struck by an orientation-flipping RF pulse) and
thus will have a greater degree of alignment with the
main field in the magnet. When another RF pulse is ap-
plied, the fresh blood will have a greater concentration
of aligned protons to flip and therefore will yield a
greater NMR signal. Because the imaging of this signal
occurs on a time scale that is rapid with respect to the
blood flow, the change is detected. This phenomenon is
the basis for “flow-based” imaging in fMRI. It is largely
sensitive to changes in arterial blood flow (where flow
is the fastest).
A second—and more commonly used—process
also yields a fMRI signal. Surprisingly, the neural activ-
ity that elicited the local increase in blood flow and
blood volume does not elicit a proportional increase in
oxygen utilization. That is, although the neural activity
leads to a small increase in oxygen utilization, that in-
crease is dwarfed by the increase in blood flow. Thus,
an increase in oxygenated hemoglobin occurs in the
venous portion of the capillary bed near the site of neu-
ral activity (as well as downstream from that site). The
combination of increased oxygenated hemoglobin and
increased blood flow results in a decrease in the instan-
taneous concentration of deoxygenated hemoglobin on
the venous side of the capillaries. Deoxygenated hemo-
globin (unlike oxygenated hemoglobin) is a strongly
paramagnetic biological molecule, and it distorts the
magnetic field locally. Thus, a decrease in the local con-
centration of deoxyhemoglobin leads to a more uni-
form magnetic field locally and to a longer time period
during which the orientations of precessing protons re-
main in phase. As a result, the NMR signal from a brain
region of reduced deoxyhemoglobin concentration in-
creases relative to the signal from that brain region in its
normal (neuronally resting) state. This link between
changes in neuronal activity and changes in the local-
ized blood oxygenation is what gives rise to the fMRI
signal change, a phenomenon called the blood oxygen
level–dependent (BOLD) effect. This effect is the major
source of contrast in most fMRI experiments. The
mechanism underlying the coupling of neuronal activ-
ity (e.g., neuronal “spiking,” synaptic potentials, main-
tenance of resting potentials) to the hemodynamic re-
sponse is the subject of active investigation (for further
information, see the Annotated Bibliography at the end
of this chapter).
Other Technical Issues in MRI
Operationally, fMRI differs from conventional MRI in
two basic respects. First, fMRI is tailored to be sensitive
to changes in blood flow and/or oxygenation that re-
flect neural activity. Second, fMRI is typically con-
ducted with special hardware that permits the very
rapid variation of magnetic field gradients that is
needed to create images. This rapid variation of gradi-
ents permits much faster acquisition of whole-brain
volumes than is possible with conventional MRI. This
swift data collection is crucial in most modern fMRI-
based experiments, as will become apparent in the dis-
cussion of experimental design and data analysis.
Several imaging parameters must be selected dur-
ing acquisition and should be optimized for each
study. Figure 4–1 illustrates some of the advantages of
optimizing acquisition parameters for fMRI scans. The
figure compares the results from an experimental para-
digm conducted twice with the same individual using
two different sets of acquisition parameters. The stud-
ies sought to characterize the pattern of brain activity
associated with the euphoriogenic effects of the abused
substance cocaine (the references for these studies are
provided in the Annotated Bibliography). One subject
participated in two separate experiments. The first
study was conducted at a field strength of 1.5 T with
6-mm-thick slices collected every 8 seconds. A second
study to replicate and extend the first was conducted
at a higher field strength (3 T) with thinner image slices
(3 mm thick) collected more frequently over time (repe-
tition time [TR]= 4 seconds). The combination of higher
field strength, thinner slices, and more timepoints pro-
vided sufficient power to allow the investigators to an-
alyze the data for individual subjects rather than being
limited to group analyses.
fMRI is made practical and powerful by virtue of
special pulse sequences (e.g., echo planar and spiral
scanning) and hardware that permit the encoding of a
brain slice with a single RF pulse, allowing the entire
brain to be imaged in a matter of a few seconds. A wide
variety of pulse sequences are used in fMRI, and pulse-
sequence development remains an area of continuing
innovation. Moreover, the versatility of MRI for neuro-
science extends beyond fMRI; magnetic resonance can
also be used to assay various aspects of brain chemistry
Functional Magnetic Resonance Imaging 97
by means of a technique known as magnetic resonance
spectroscopy (MRS). Because some variants of MRS
can measure the presence of brain metabolites at tem-
poral resolutions on the order of minutes and spatial
resolutions not far from those of BOLD fMRI, MRS is in
many ways conceptually related to fMRI and is likely
to have increasing clinical applications in psychiatry in
the future (see Chapter 5 in this volume).
Summary of Basic Physical Principles
A strong, spatially uniform magnetic field aligns a
small but significant fraction of the hydrogen nuclei of
water molecules in a brain. A carefully controlled se-
quence of gradient fields and RF pulses is used to gen-
erate NMR signals that can be reconstructed to form a
three-dimensional image in which contrast is depen-
dent, in part, on the blood flow and/or oxygenation
changes caused by neural activity. Thus, fMRI can be
used noninvasively to detect changes in local neural
activity in the human brain.
Research Methods
Consideration of experimental design in the context of
fMRI-based studies is inextricably associated with data
analysis. We begin the following discussion by review-
ing some basic issues in experimental design, and then
describe related issues in data analysis. Fundamental
to the understanding of fMRI as a tool for representing
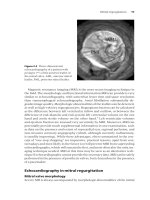
Figure 4–1. Effect of image acquisition parameters on functional magnetic resonance imaging (fMRI) signal.
To p and bottom panel each show representative data from a single substance-abusing subject who participated in
two similar studies of the effects of acute cocaine infusion on brain activity (see Annotated Bibliography for a
complete account of the studies and results). One study was conducted with a 1.5-tesla (T) magnet, and the other
with a 3-T magnet. For each study, a pseudocolored statistical map showing significant fMRI signal changes after
cocaine infusion is superimposed on a gray-scale anatomic image of a coronal slice through the brain at a level
18 mm posterior to the anterior commissure. Kolmogorov-Smirnov statistical maps compare the pre- and postin-
fusion time points. Adjacent to that image is shown the time course of fMRI signal change (the infusion is indi-
cated by the red line) in the cluster of voxels located in the ventral tegmental region of the brain (delimited by the
black oval). Note that the fMRI acquisition parameters for the 1.5-T study had few time points and thicker slices.
The improved power from the 3-T study allowed the investigators to probe brain activity of individual subjects,
not just group-averaged data. The black line on the small sagittal image indicates the approximate slice plane.
Source. Data from Breiter et al. 1997; Gollub et al. 1998, 1999 (see Annotated Bibliography).
98 ESSENTIALS OF NEUROIMAGING FOR CLINICAL PRACTICE
the localization of brain function is the idea that a sin-
gle image, in isolation, conveys little, if any, useful in-
formation. Rather, it is the comparison of multiple im-
ages that are collected during different states of neural
activity that supplies interpretable data. Note that this
statement is not true for structural MR images. A single
structural image conveys a great deal of useful infor-
mation, because data about change are not sought (ex-
cept on a much longer time scale, as in developmental
and longitudinal studies of brain structure). In con-
trast, functional imaging data is almost exclusively
about changes in neuronal activity. Moreover, although
changes between two brain states can be detected with
fMRI, the interpretation of those changes normally re-
quires additional measurements of brain states or other
prior knowledge. For example, merely observing that
the fMRI signal is larger for a specific brain region dur-
ing task 1 than it is during task 2 does not allow one to
determine whether the signal increase represents an
“activation” of neural activity by task 1 or an “inhi-
bition” of neural activity by task 2. Comparison with
other states (e.g., a resting baseline of some sort) is
needed to disambiguate the interpretation of the data.
Experimental Design
The design of fMRI-based experimental paradigms is
influenced by a number of considerations. The spatial
and temporal characteristics of the blood flow re-
sponse underlying the fMRI BOLD signal place limita-
tions on the kinds of neural effects that can be studied
and also strongly influence the way in which specific
experiments or test procedures must be arranged.
Practical constraints associated with fMRI derive from
the requirements (typically) for long imaging sessions,
minimal head movement throughout the session, toler-
ance of the much louder acoustic noise associated with
high-speed imaging, and the need to present stimuli
and obtain behavioral responses. Finally, it is essential
to understand that fMRI is a tool that depends on the
comparison of multiple brain states rather than a snap-
shot of a single state.
fMRI is dependent on hemodynamic changes
rather than the electrical consequences of neural activ-
ity. The spatial and temporal characteristics of these he-
modynamic effects must be taken into account in de-
signing experiments and analyzing the data from these
experiments. The spatial characteristics arise from the
underlying vasculature and details (as yet unknown)
of biochemical coupling between neuronal activity and
hemodynamic response; the temporal characteristics
include a delay in the onset of detectable MR signal
changes in response to neural activity and a dispersion
of the resulting hemodynamic changes over a longer
time than the initiating neural events.
Block Design
With regard to the temporal aspects of the hemody-
namics measured, fMRI experiments fall into two
broad categories: “block” designs and “event-related”
designs. In block designs, the experimental task is per-
formed continuously in blocks of time, typically 20–60
seconds in duration. The idea here is to ignore the de-
tails of the temporal characteristics by setting up a
“steady state” of neuronal and hemodynamic change.
This approach is conceptually simple and is of great
practical importance for fMRI, because it is the optimal
technique for detecting small changes in brain activity.
The major weakness of block design is the requirement
that all the stimuli or task characteristics remain un-
changed for tens of seconds, precluding the use of
many classic psychological paradigms (e.g., the “odd-
ball” scheme).
Event-Related Design
The other major approach—event-related design—
makes use of the details of the temporal response pat-
tern in the hemodynamics, as well as the largely linear
response characteristics associated with multiple stim-
ulus presentations. Many instances of each of a small
number of stimulus types are presented in a pseudo-
random order (rather than in blocks of similar or iden-
tical stimulus types), and the hemodynamic response
to each stimulus type is extracted. The associated data
analysis is more difficult than in the case of block de-
sign, because the hemodynamic responses to the differ-
ent stimulus presentations overlap in time. Nonethe-
less, single-trial designs are particularly powerful and
useful in circumstances in which it is essential to have
random order in the presentation of individual stim-
uli—that is, in a situation in which a block design with
long periods of the same type of stimulus would not
permit the desired comparisons for neural activations.
Time-Resolved Design
One final approach to experimental design should be
mentioned. The techniques described thus far make
use of averaging over multiple instances of a given
stimulus type. In block designs, the trials of a given
type all occur together, so the averaging is done as
much by the hemodynamics and neural systems as by
Functional Magnetic Resonance Imaging 99
any data analysis software. In event-related designs,
the averaging of the effects of multiple stimulus pre-
sentations of a given type is done explicitly in software
during data analysis. It is possible, however, to analyze
spaced single-trial data on the basis of activation from
a single event (rather than averaging over multiple in-
stances of the same trial type). This technique—some-
times called time-resolved fMRI—has not yet been
widely applied, primarily because the signals elicited
from single stimulus events are generally weak. How-
ever, high–magnetic field MRI systems and selection of
experimental paradigms that elicit strong, focal neural
activity have demonstrated the feasibility of single-
event fMRI.
Tradeoffs
The key physical variables associated with fMRI—spa-
tial resolution, temporal resolution, brain coverage,
and signal-to-noise ratio—are quantities whose values
can be manipulated by trading one off against the oth-
ers. The physiology of the circulatory system and the
physics of the MR imaging devices constrain the spa-
tial and temporal resolution of fMRI. It is routine, to-
day, to obtain 1 mm × 1 mm × 1 mm structural MR im-
ages and 5 mm × 5 mm × 5 mm functional MR images
in 1.5-T devices. The temporal resolution of fMRI is on
the order of 1–3 seconds. Neither the spatial- nor the
temporal-resolution numbers are indicative of absolute
limits in terms of the physiology or the imaging hard-
ware. Rather, these numbers represent a snapshot in
the development of ever-improving resolutions. More-
over, at any given stage of technical development in
MRI, the various imaging parameters can be manip-
ulated to emphasize one aspect of resolution in ex-
change for another.
Practical Constraints
The physical properties of MRI, as well as financial
costs, place a number of practical constraints on the
design and execution of fMRI-based studies, thereby
influencing experimental design. Subjects must be
screened for disqualifying conditions (e.g., presence of
a cardiac pacemaker, claustrophobia), ancillary equip-
ment must be MR-compatible, and financial resources
to support the imaging acquisition must be available.
Head Movement
One vexing problem in the practical application of
fMRI is head movement. Although pulse sequences
have been developed that allow collection of an entire
slice of brain data in less than 50 milliseconds, and
multiple slices (for whole-brain coverage) can be col-
lected in 2–3 seconds, the amount of information con-
tained in each such image is limited. That is, the
amount of functional contrast in the images—the dif-
ferences in the signals between two experimental
states—is small. To make up for this limitation, many
images are collected over extended periods of time: at
least minutes, and sometimes hours. During these time
periods, it is important that the subject’s head move as
little as possible.
Subject movement is generally regarded as the
greatest obstacle to obtaining consistent data in fMRI-
based experiments. A variety of techniques are used
to encourage subjects to keep their heads as still as pos-
sible, but none of these is perfect. With young, well-
motivated, healthy subjects, head movement is usually
not an insurmountable problem. Studies with experi-
enced, well-motivated subjects who use bite bars (an
individually molded dental impression mounted to the
head coil) in the scanner can routinely be expected to
yield data free of serious motion artifact. By contrast, in
studies with psychiatric patients (e.g., schizophrenia
patients or substance-abusing subjects who cannot use
a bite bar because they have few, if any, teeth), older pa-
tients, or other difficult subjects, as much as 20%–30%
of the data may need to be discarded because of subject
motion. Although data analytic procedures are avail-
able for transforming images of moving heads back to
a fixed position, these procedures are limited. Indeed,
because the moving head actually distorts the main
magnetic field in different ways, no motion-correction
algorithm can fix the problem completely.
Finally, it should be noted that MRI time is expen-
sive. Charges for an hour of clinical imaging can run to
the hundreds of dollars. Therefore, the total number of
imaging minutes is one of the parameters that must be
considered in the tradeoffs when designing a study. At
the same time, the research field is recognizing that re-
sults based on small sample sizes can be erroneous or
misleading; therefore, having adequate resources to
study a full cohort of at least 15–18 subjects is critical to
obtaining interpretable (and publishable) data.
Data Analysis
The scanning session for a typical fMRI-based experi-
ment lasts 1–3 hours and results in the collection of
hundreds of megabytes of data. The theory and practi-
calities associated with processing those data are com-
plex and continually evolving. The present spatial and
100 ESSENTIALS OF NEUROIMAGING FOR CLINICAL PRACTICE
temporal resolution of fMRI data encourages modeling
of brain systems at a level that may substantially ex-
ceed that of previous volumetric imaging systems.
Some of these advances require different kinds of data
analysis and different kinds of visualization tools than
made sense in the context of systems with poorer spa-
tial resolution. Finally, the ability to image the same
subject multiple times, and the associated potential for
collection of many kinds of functional data from that
subject, encourages novel approaches to data analysis.
Data analysis is a critical, still time-consuming, and
at times controversial part of fMRI-based experimenta-
tion. Although many of the problems are well defined,
the appropriate solutions are not. There is general
agreement on how to handle some of the issues associ-
ated with data analysis (e.g., algorithms to detect and
correct for head movement), but there are no univer-
sally agreed upon approaches to many other issues
(e.g., the appropriate statistical tests to define the detec-
tion of neural activation, the best way to compare data
across different subjects, the best way to visualize and
report the results of data analysis). A host of software
tools are available for data analysis, each having partic-
ular strengths and weaknesses. Because of the rapid de-
velopment in all aspects of fMRI-based research, no one
standard approach to data analysis has yet emerged.
Preprocessing
Before the essential part of data analysis can begin, a
number of preliminary steps are typically taken. The
most critical of these is assessment of head movement.
In many new MRI systems, some measure of head
movement is computed during the scanning session af-
ter each run; in at least one system, the imaging soft-
ware itself performs prospective slice correction, reset-
ting the imaging parameters in real time (during the
scanning run) to compensate for detected movement
between the previous volumetric images.
The data analytic approach to motion detection and
motion correction is based on the brain images them-
selves, rather than on the external monitoring of head
movement. Efforts are made to minimize subject head
movement, but it is not currently possible to correct
for severe or rapid movement. (All of the current al-
gorithms for correcting head movement assume rigid
motion of the head. Whereas a single slice of brain-
imaging data is collected very rapidly relative to most
head movement, the time needed to collect an entire
brain volume—consisting of 20 or more slices—is much
longer than many head movements. Such motion can-
not be corrected with these algorithms.) However, if
the movement is not too great in amplitude and not
too rapid, the algorithms available in most fMRI data
analysis packages are adequate to detect the motion
and to transform the data to compensate for the effects
of that motion.
A key feature of these algorithms is that they auto-
matically reveal many kinds of movement, including
stimulus-correlated movement. If the subject moves
every time he or she is supposed to start a task, the
movement could create MRI signal artifacts that ap-
pear as a false activation signal. There is no good way
to correct for such data; it must be detected and dis-
carded.
Basic Detection of Change
The first goals of any analysis of fMRI-based data are
to determine whether the experimental manipulation
has resulted in a measurable change in the MR signal
and, if so, to specify where (in the brain) and when (in
time) that change has occurred. In principle, any statis-
tical method that can be applied to a time series can be
used with fMRI data. In practice, the demands of the
experimental paradigm, the limitations of the tool, and
the capabilities of the distributed software packages
constrain the sorts of analyses that are typically per-
formed. A few broad classes of common data analysis
options are detailed in the following discussion (this
list is not comprehensive). With the exception of prin-
cipal components analysis (PCA) and other multivari-
ate techniques, each of these tests is applied at the
voxel level. When these statistics are computed for
each voxel in the brain and the resulting collection of
statistics is presented in the form of an image in which
color or intensity is used to represent the value of that
statistic, the result is called a “statistical map” of brain
activation.
Systematic Detection of Change
The most obvious and simple statistical test that can
be used in fMRI data analysis is Student’s t test. This
test assumes that each number in each group is inde-
pendent and that the underlying distribution of num-
bers is Gaussian (i.e., it is a parametric test). In fact, both
of these assumptions are often violated in actual fMRI
data. Nonetheless, parametric statistics such as the t test
are the most widely used measures of the difference be-
tween the groups of numbers collected in fMRI images
across conditions.
The mathematical machinery used to compute
t tests and other variants on correlation analysis with