Essentials of Neuroimaging for Clinical Practice - part 8 doc
Bạn đang xem bản rút gọn của tài liệu. Xem và tải ngay bản đầy đủ của tài liệu tại đây (320.51 KB, 15 trang )
Functional Magnetic Resonance Imaging 101
fMRI data is the general linear model. The fMRI data
are compared with some kind of reference temporal
function to determine in which brain regions the fMRI
signal intensity is highly correlated with a collection
of reference functions. Most candidate reference func-
tions are obtained from the experimental design. For
example, because the brain’s hemodynamic response
assumes a fairly consistent profile (delayed in onset
and longer lasting relative to the inciting stimulus), a
boxcar function defining the experimental paradigm
is often convolved with an estimated hemodynamic
response function to yield the reference function. The
resulting reference function is smoother than a boxcar
and better takes into account the shape of the hemo-
dynamic response, generally resulting in better corre-
lation between the MR signal time courses and the
regressor time course. Often, a single canonical hemo-
dynamic response function is used across the entire
brain and across subjects, despite the fact that evi-
dence exists for variation in hemodynamic response
shape across subjects and brain regions. Some soft-
ware packages make provisions for this variation,
allowing for independent modeling of the hemo-
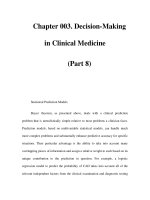
dynamic response function on a voxelwise basis. Fig-
ure 4–2 shows brain activation related to a working-
memory task as “seen by” the hemodynamic response
in the dorsolateral prefrontal cortex of a subject with
schizophrenia.
All of the approaches discussed thus far make the
assumption that the variations of interest in the data
are those that occur in temporal synchrony with the ex-
perimental variations built into the design and that
these variations can be modeled at individual voxels in
the image data (i.e., they are univariate techniques).
This is by far the most commonly used method of data
analysis. Other approaches (e.g., principal components
Figure 4–2. Statistical map showing bilateral dorsolateral prefrontal cortex activation in an unmedicated sub-
ject with schizophrenia during performance of the Sternberg Item Recognition Paradigm, a task that requires
working memory to function to obtain better-than-chance performance.
The t-test statistical map was generated by comparing the images acquired during the five-target (5t) condition
with those acquired during the Arrows (A) baseline condition. The task paradigm is depicted graphically below
the time course of signal intensity changes (see Annotated Bibliography for a complete account of the study and
results). Note the marked differences between the right and left side in the activation produced by the easier
condition (two targets [2t]).
Source. Data from Manoach et al. 2000 (see Annotated Bibliography).
102 ESSENTIALS OF NEUROIMAGING FOR CLINICAL PRACTICE
analysis, independent components analysis, partial
least squares, structural equation modeling) go beyond
this simple approach to try to find and understand spa-
tiotemporal patterns of activation that are not based on
the isolated time course at a single voxel. Such tests
should be able to detect novel temporal variations trig-
gered by the experiment but not part of the design.
However, routine analysis of fMRI-based data in clini-
cal contexts will probably not be based on these multi-
variate techniques in the near future.
Comparing Brains
Clinical applications require the ability to make sense
of data from an individual brain. In contrast, most ex-
perimental and validation studies must have some sys-
tem for comparing brains across subjects. Nearly all
fMRI studies use multiple subjects and perform statis-
tical analyses across data collected from multiple sub-
jects. Brains differ in size, shape, and details of sulcal/
gyral folding. Various systems have been developed to
“spatially normalize” the brains—that is, to transform
the images to a coordinate system that will permit com-
parison across subjects. Systems for performing such
transformations range from the very basic (e.g., each
brain is set in a standard orientation and linearly scaled
to fit in a standard rectangular box) to the highly elab-
orate (e.g., the cortical surface is treated as a rubber
sheet that can be inflated to smooth out sulci and gyri,
thus permitting easy visualization of cortex within the
folds, as well as on the surface).
Comparing Groups
In addition to comparing brains across individual sub-
jects in a given group, researchers often try to detect
and understand differences between groups. fMRI can
be used to address at least two types of questions. One
question might be thought of as the attempt to repre-
sent “typical” brain function and associated networks
of activity. In that context, collecting more and more
data about a single brain engaged in a single task
might be useful, because the variability associated
with any particular aspect of the associated brain activ-
ity might be expected to decrease with increased mea-
surement. In statistics, this is called a “fixed effects”
model. On the other hand, to know whether there are
differences in brain function and networks of activity
between two putatively different groups of subjects, it
is important to sample many members of each group,
even if the individual measurement of any one mem-
ber of the group has low precision. In particular, know-
ing with extreme precision that two members of one
group differ from two members of another group is
useful only if the within-group variation (i.e., between
brains) is as small as the within-brain variation (i.e., be-
tween multiple measurements of the same brain). If
this is not the case, the exceptional precision of the
measurement of the small number of subjects is not
useful. In statistics, this is known as a “random effects”
model.
The practical implication of the fixed- versus ran-
dom-effects model of variance for functional neuroim-
aging is that it is better to have measurements of many
brains if the goal is to claim group differences. On the
other hand, it may be better to have many measure-
ments of a few brains if the goal is to delineate func-
tional systems as precisely as possible.
Software Tools
Many software tools are available for analyzing data
from fMRI. Some are completely free (e.g., AFNI, FSL,
FreeSurfer), others are mostly free (SPM is “free” but
requires a MATLAB license, which is not free), and still
others are supported by commercial ventures (e.g., An-
alyze, MEDx, BrainVoyager). MRI manufacturers are
beginning to incorporate fMRI analysis software with
their scanners, a practice that will undoubtedly in-
crease in the near future. Development of these data
analysis systems is rapid and ongoing; up-to-date in-
formation is best and most easily obtained via the
World Wide Web. One particularly exciting develop-
ment is that of real-time fMRI data analysis capability.
It is now possible to perform a simple statistical test on
fMRI data during the experiment (while the partici-
pant is still in the MRI scanner) that tells the investiga-
tor whether a successful fMRI study has been obtained.
Such a test can be of significant practical value, for two
reasons. First, if analysis reveals excessive head move-
ment or other artifact, an additional run can be ob-
tained on the spot, without having to bring the subject
back to the MRI suite at a later date. Second, it is possi-
ble to increase efficiency by repeating a given activa-
tion protocol only as long as is necessary to detect any
effects at a given (operator-specified) threshold for sta-
tistical significance.
Summary of Research Methods
The decisions required in the design of a useful fMRI
experiment and the choice of appropriate data analysis
Functional Magnetic Resonance Imaging 103
methods are intertwined and complex. Application of
the technology of fMRI to psychiatry entails a collec-
tion of tradeoffs. The 10 years since the inception of
fMRI have seen dramatic developments in the technol-
ogy underlying image acquisition as well as in meth-
ods for experimental design and data analysis. Today,
an array of established procedures and software tools
are available with which to implement these ideas, al-
though no universally accepted standards yet exist. A
simple, systematic set of neuropsychological test pro-
cedures appropriate for the study of psychiatric ill-
nesses, including standardized data analyses, is un-
doubtedly on its way, but it has not yet arrived.
Potential Clinical Applications
fMRI has many possible clinical applications. A very
active current area of research is the use of fMRI for
presurgical planning for patients with brain tumors or
epilepsy. fMRI’s greatest potential may lie in the areas
of differential diagnosis and treatment evaluation.
One illustration of this potential can be found in a re-
cent study of the detailed process of “spreading de-
pression” in neural activity associated with migraine
headaches and their associated visual sequelae (Had-
jikhani et al. 2001). In that study, fMRI permitted the
investigators to follow the progression of the vasocon-
strictive events systematically across the visual cortex.
The potential for such applications in the context of
differential diagnosis and treatment evaluation is ob-
vious.
A tour de force in fMRI-based experimentation, the
study of Hadjikhani and colleagues (2001) brought to-
gether some of the most elegant work ever conducted
in a research application context (retinotopic mapping
of the visual cortex) with a phenomenon of long-stand-
ing clinical importance (migraine headaches). Mi-
graines are an intense form of headache that often is
preceded by visual auras—that is, the perception of
various strange visual patterns, typically around a cir-
cular arc or perimeter of some portion of the visual
field, bilaterally—and an associated temporary blind-
ness (a temporary scotoma) within that perimeter. The
fact that these auras and scotomas appear to both eyes
at the same portion of the visual field is very strong
suggestive evidence that the underlying effect is being
controlled at the cortical level—where these corre-
sponding portions of the visual field share the same
physical location in the brain. Moreover, migraines
have long been understood to be associated with
changes in dilation and constriction of the cerebral vas-
culature.
Migraine headache is very difficult to study with
fMRI, both because the aura phenomenon is relatively
short-lived (sometimes 30–60 minutes, sometimes 2–4
hours) and because the headache is associated with
aversion to loud noises and bright lights on the part of
the sufferer. Therefore, it is difficult to persuade mi-
graine patients to volunteer for an fMRI study; and
even if they were willing, it would be rare for such sub-
jects to experience a migraine while they were near the
scanner. One research group was fortunate enough to
find a volunteer who predictably and regularly trig-
gered his own migraine headache by engaging in in-
tense athletic activity (playing basketball). He was,
therefore, available for repeated (schedulable!) scan-
ning immediately before and during the onset of his
migraine attacks.
The investigators, experts in visual retinotopy, de-
signed a protocol that revealed—in exquisite detail—
the neurological correlates of the patient’s visual symp-
toms. As the scotoma grew and as the aura changed in
size (both of which phenomena could be reported sub-
jectively by the patient), fMRI data revealed the loca-
tion on the cortex and the functional variation in ampli-
tude of response to a flickering checkerboard of visual
stimulation. Combining these data with previously ob-
tained retinotopic maps of the subject’s visual cortex
permitted a precise correlation between measurable
function and subjective vision loss. Although this
study does not directly suggest a treatment for mi-
graine attacks, it certainly demonstrates a method for
objectively assessing the effectiveness of candidate
therapies.
Conclusions
Many factors suggest that fMRI will make critically im-
portant contributions to the diagnostic and prognostic
capabilities of future psychiatrists. The first of these is
the rapid evolution of the technology for fMRI image
acquisition, which allows ever-greater spatial and tem-
poral resolution. The second factor is advances in ex-
perimental design and data analysis tools. Finally, in-
creasingly sophisticated approaches to data modeling
that utilize calibrated imaging data in conjunction with
other clinical information, including genomics, in
large-scale multisite projects will begin to reveal the
dysfunction in neural activity that underlies psychiat-
ric illness.
104 ESSENTIALS OF NEUROIMAGING FOR CLINICAL PRACTICE
Annotated Bibliography
For a much more thorough and elegant explanation of the physics
underlying magnetic resonance (MR) image formation, blood
oxygen level–dependent (BOLD) contrast, and other MR sig-
nals, the interested reader is referred to the following textbook:
Buxton RB: Introduction to Functional Magnetic Resonance
Imaging: Principles and Techniques. Cambridge, UK,
Cambridge University Press, 2002
For more details on the practicalities of setting up experiments in
the magnetic resonance imaging (MRI) environment, experi-
mental paradigm design, and data analysis, the reader is referred
to the appropriate chapters in the following textbook:
Jezzard P, Matthews PM, Smith SM (eds): Functional MRI:
An Introduction to Methods. Oxford, UK, Oxford Univer-
sity Press, 2001
And to the following:
Friston KJ, Holmes AP, Worsley KJ: How many subjects con-
stitute a study? Neuroimage 10:1–5, 1999
Gusnard DA, Raichle ME: Searching for a baseline: functional
imaging and the resting human brain. Nat Rev Neurosci
2:685–694, 2001
Manoach DS: Prefrontal cortex dysfunction during working
memory performance in schizophrenia: reconciling dis-
crepant findings. Schizophr Res 60:285–298, 2003
Stark CE, Squire LR: When zero is not zero: the problem of
ambiguous baseline conditions in fMRI. Proc Natl Acad
Sci U S A 98:12760–12766, 2001
For more information regarding the coupling of neuronal activity
with changes in cerebral vasculature, the reader is referred to the
relevant chapters in the textbooks listed above and, for even
greater detail, the appropriate chapters in the following text-
book:
Edvinsson L, Krause D (eds): Cerebral Blood Flow and Me-
tabolism, 2nd Edition. Philadelphia, PA, Lippincott, Wil-
liams & Wilkins, 2002
For a practical demonstration of issues regarding test–retest reli-
ability in psychiatric populations, see the following:
Manoach DS, Halpern EF, Kramer TS, et al: Test-retest reli-
ability of a functional MRI working memory paradigm in
normal and schizophrenic subjects. Am J Psychiatry 158:
955–958, 2001
For interesting and thoughtful discussions of what has been learned
that is relevant to cognitive and emotional aspects of brain func-
tion from neuroimaging, see the following:
Bush G, Luu P, Posner MI: Cognitive and emotional influ-
ences in anterior cingulate cortex. Trends Cogn Sci 4:215–
222, 2000
For a complete description of the migraine study described in the
text, see the following:
Hadjikhani N, Sanchez Del Rio M, Wu O, et al: Mechanisms
of migraine aura revealed by functional MRI in human vi-
sual cortex. Proc Natl Acad Sci U S A 98:4687–4692, 2001
For a full account of the studies on the effects of acute cocaine infu-
sion on human brain activity described in Figure 4–1, see the
following:
Breiter H, Gollub RL, Weisskoff RM, et al: Acute effects of co-
caine on human brain activity. Neuron 19:591–611, 1997
Gollub RL, Breiter H, Kantor H, et al: Cocaine decreases cor-
tical cerebral blood flow, but does not obscure regional ac-
tivation in functional magnetic resonance imaging in hu-
man subjects. J Cereb Blood Flow Metab 18:724–734, 1998
Gollub RL, Breiter H, Dershwitz M, et al: Cocaine dose depen-
dent activation of brain reward circuitry in humans re-
vealed by 3T fMRI. Paper presented at: 7th Scientific Meet-
ing and Exhibition of the International Society for Magnetic
Resonance in Medicine, Philadelphia, PA, May 24–28, 1999
For a complete account of the study from which the data in Figure
4–2 were taken, see the following:
Manoach DS, Gollub RL, Benson EB, et al: Schizophrenia sub-
jects show aberrant fMRI activation of dorsolateral pre-
frontal cortex and basal ganglia during working memory
performance. Biol Psychiatry 48:99–109, 2000
105
5
Magnetic Resonance
Spectroscopy
Nicolas Bolo, Ph.D.
Perry F. Renshaw, M.D., Ph.D.
Since the discovery of the principle of nuclear mag-
netic resonance (NMR), the property of atomic nuclei
to absorb and emit energy through rapidly oscillating
magnetic fields has been used as an investigational tool
in domains as widespread as organic or solid state
chemistry, geology, molecular biology, and medicine. It
is now so familiar to and universal in the medical field
that the term magnetic resonance (MR) brings to mind
for many an array of methods, techniques, and instru-
mentation with powerful diagnostic capabilities. Nu-
merous medical specialties have benefited from use of
this tool to increase diagnostic power, mostly due to
MR’s ability to noninvasively capture images that con-
tain structural or functional information from soft tis-
sues deep within the body. The organ of interest for the
psychiatrist is the brain. The technique is widely known
as magnetic resonance imaging (MRI) for structural
MR imaging. But the versatility of MR allows its meth-
ods to extend beyond static structure to investigate dy-
namic processes within a broad range of levels of bio-
logical organization, from biochemical pathways of
neurotransmitter synthesis to the integration of cortical
functional activity for behavioral responses to stimuli
(functional MRI [fMRI] is addressed in Chapter 4). It is
generally less well known that brain biochemistry may
be explored by an MR method called magnetic reso-
nance spectroscopy (MRS). In this chapter we discuss
the clinical utility of MRS methods in psychiatry.
Magnetic Resonance
Investigational Methods
Nuclear Magnetic Resonance in
Historical Perspective
NMR is a phenomenon that can be found in both living
and inorganic matter of our world. One physics text-
book offers the following summary: “Magnetic reso-
nance is a phenomenon found in magnetic systems
that possess both magnetic moment and angular mo-
106 ESSENTIALS OF NEUROIMAGING FOR CLINICAL PRACTICE
mentum. A system such as the nucleus of an atom may
consist of many particles coupled together so that in
any given state, the nucleus possesses a total magnetic
moment µ and a total angular momentum J” (Slichter
1996, pp. 1–2). The first NMR experiment—in which
NMR signals were detected from a molecular beam of
lithium chloride—was performed in 1938. MR experi-
ments in bulk matter followed several years later, in
1946. In 1951, the property that similar nuclei in differ-
ent molecular structures have slightly different reso-
nant frequencies was demonstrated in experiments
performed on samples of ethanol. This property allows
for magnetic resonance spectroscopy, or the presenta-
tion of the MR signal intensity distribution on a fre-
quency axis, which is widely used in organic chemistry
for the determination of molecular structure. The ex-
periments in living systems followed soon after, with
some of the first reports on the application of MRS
to cells and tissues made in 1955. In 1973, phosphorus-
31 (
31
P) NMR recordings from erythrocytes were re-
ported. By the early 1980s, improvements in MR sys-
tem design had made it possible to conduct studies in
vivo. By 1986, the scientific literature contained reports
of
31
P MR in vivo studies of brain, kidney, liver, heart,
skeletal muscle, and bowel.
Principles of Magnetic
Resonance Spectroscopy
Compounds are formed of atoms. Nuclei of atoms
with an odd number of nucleons (building blocks of the
nucleus, composed of positively charged protons and
neutral neutrons) are positively charged particles with
spin that possess a property called magnetic moment. In
the classical description, the interaction of the mag-
netic moment with the static magnetic field of the scan-
ner orients a fraction of the nuclear magnetic moments
parallel to the magnetic field, resulting in a sum effect,
or induced magnetization. The direction of the scanner’s
magnetic field is called the longitudinal direction, and
the plane perpendicular to this field is called the trans-
verse plane. The induced magnetization—which car-
ries information about the compound—is detected by
the MR scanner in the transverse plane. A magnetic
field that is oscillating at the appropriate resonant fre-
quency of the nucleus drives the induced magneti-
zation into the transverse plane for detection. In the
quantum mechanical description at the microscopic
level, the magnetization flip corresponds to transitions
between energy or coherence states of the nuclei. The
main nuclei of interest for biological studies with MR
are outlined in Table 5–1, which shows that the reso-
nant frequencies are in the radio frequency (RF) do-
main.
The resonant frequency depends on two values: the
value of an intrinsic property of the nucleus, called the
gyromagnetic ratio, and the value of the field in which
the nucleus bathes, which in principle is the scanner’s
static magnetic field:
The signal is detected at a bandwidth centered on
the driving RF field frequency. In a given compound,
the distribution of electron clouds around the nuclear
backbone creates a shielding effect so that each nucleus
may experience a field that is in fact slightly different
from the scanner field; thus, the resonant frequency
may be slightly different than the driving frequency,
depending on the position of the nucleus in the com-
pound’s electron cloud. These frequency shifts, called
chemical shifts because of their chemical origin, are on
the order of several to several hundred hertz (Hz),
whereas the driving resonant frequency is on the order
of several to several hundred million hertz (megahertz
[MHz]); thus, frequency shifts are often measured in
parts per million (ppm) of the resonant frequency. The
frequency analysis of the detected signal or spectrum
allows identification of the compound. Each com-
pound has its own “frequency signature” in the MR
spectrum. Similar chemical groups or similar electron
clouds give rise to resonant frequencies that are close;
thus, peak overlap is often encountered in the spec-
trum. Overcoming this overlap so as to distinguish dif-
ferent chemical entities is one of the difficulties inher-
ent in MRS.
Table 5–1. Nuclei of biological interest with relative
nuclear magnetic resonance (NMR) sensitivities
Nucleus
Spin
quantum
number
NMR
frequency
at 4 tesla
Relative
sensitivity
at constant
field
% natural
abundance
1
H 1/2 170.32 1 99.8
19
F 1/2 162.13 0.83 100
7
Li 3/2 66.21 0.29 92.58
23
Na 3/2 45.04 0.09 100
31
P 1/2 69.01 0.06 100
13
C 1/2 42.85 0.02 1.1
39
K 3/2 7.97 0.0005 93.2
resonant
frequency
⎝⎠
⎛⎞
gyromagnetic
ratio
⎝⎠
⎛⎞
magnetic
field
⎝⎠
⎛⎞
×=
Magnetic Resonance Spectroscopy 107
Magnetic Resonance Spectroscopy
Relative to Other Neuroimaging
Modalities
The other main neuroimaging modalities comparable
to MRS, inasmuch as they can also reveal biochemical
information from tissues in vivo, are positron emis-
sion tomography (PET) and single photon emission
computed tomography (SPECT). All of these tech-
niques are noninvasive in the sense that they do not
require surgery, but PET and SPECT require the injec-
tion of a radioactive marker that is traced by the de-
tector system. Unlike PET and SPECT, MRS can detect
endogenous metabolites. Exogenously administered
compounds can also be observed with MRS, but they
need not be radioactive to be detected by MRS meth-
ods. Thus, in contrast to PET and SPECT, MRS allows
repeated imaging without the risk of exposure to ra-
dioactivity or ionizing radiation: studies of pharma-
cological kinetics can be performed, as well as longi-
tudinal studies over weeks, months, or years, without
the hazard of accumulated radiation effects. Another
advantage of MR is that it constitutes a multimodal
technique: investigation of several aspects of brain
structure, function, and biochemistry can be carried
out in a single examination session while the patient
is in the scanner. The combined measurement of sev-
eral MR parameters can be more powerful and infor-
mative than single measurements alone.
The main disadvantage of MR is that it has a low
sensitivity, requiring relatively high concentrations
of the target compound to be present in order to be
detected. The consequence of this low sensitivity is
the low spatial and temporal resolution of MRS re-
cordings. The signal-to-noise ratio of the MRS record-
ing increases with static magnetic field strength—
hence the drive among clinicians and research scien-
tists alike for MR systems with higher and higher
fields. At present, the U.S. Food and Drug Adminis-
tration (FDA) has approved scanners with a field
strength of up to 3 tesla (T) for clinical use. In research
applications, scanners with fields up to 4 T are in op-
eration; two research sites in the United States cur-
rently have FDA approval for human studies at 7 T,
and manufacturers are considering yet higher fields.
The higher field strength of research scanners pro-
vides another advantage over lower–field strength
clinical scanners: the spectral spread increases with
field strength, thus reducing the overlap between res-
onance peaks. The increased spectral resolution al-
lows better separation, identification, and quantita-
tion of several metabolites that could not easily be
studied at lower field strengths. Likewise, studies
with low-sensitivity nuclei become possible. In-
creased sensitivity may be traded off for shorter scan-
ner time or higher spatial resolution (smaller vol-
umes may be explored).
Magnetic Resonance
Spectroscopy Applied
to Brain Biochemistry
Proton MRS
MRS of the hydrogen nucleus or proton allows detec-
tion of more than a dozen metabolites involved in dif-
ferent aspects of intermediary metabolism. Some of the
main ones are N-acetyl-aspartate (NAA), glutamate,
glutamine, γ-aminobutyric acid (GABA), glutathione,
creatine, phosphocreatine (PCr), choline (Cho), phos-
phocholine (PCh), glycerophosphocholine (GPC), glu-
cose, taurine, inositol, and lactate.
Here we briefly review the spectral characteristics
as well as the physiological significance of some of the
observed metabolic pools. Although NAA is the most
prominent compound in the brain proton spectrum,
there is still no consensus concerning its function. Be-
cause it is mainly found in neurons and synthesized in
the mitochondria, it is considered a marker of viable
neurons. Hypotheses regarding its possible function
include roles in osmotic regulation and synthesis of
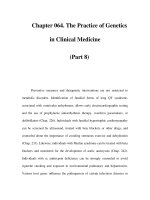
the neurotransmitter acetylcholine. Creatine and PCr
appear in the proton spectrum as a single resonance
peak (Cr; Figure 5–1) that is often used as a concentra-
tion reference standard. Both are involved in energy
metabolism; creatine is formed after high-energy PCr
has transferred its orthophosphate moiety to ADP to
regenerate ATP, thus maintaining the ATP pool with
its energy potential. That the Cr resonance peak is of-
ten used as a reference concentration standard reflects
the fact that the total concentration of creatine and PCr
is similar in many brain regions, although it is slightly
higher in the cerebral cortex than in white matter.
Choline-containing compounds involved in mem-
brane metabolism—mainly PCh and GPC—give rise
to the Cho resonance peak. Most of the choline in the
brain is incorporated into the membrane phospho-
lipid phosphatidylcholine, which has a restricted
range of motion and thus is largely invisible to in vivo
MRS. Inositol is involved in second-messenger neuro-
transmission (via phosphatidylinositols), phospho-
108 ESSENTIALS OF NEUROIMAGING FOR CLINICAL PRACTICE
lipid metabolism, and osmotic equilibrium mainte-
nance.
Phosphorus MRS
31
P MRS allows detection of compounds that play a
key role in energy metabolism and membrane phos-
pholipid metabolism. The resonance peaks of the nu-
cleoside phosphates ATP and ADP and of NADPH
present some overlap in the brain
31
P spectrum. ATP is
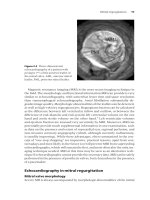
the main contributor to the nucleoside triphosphate
(NTP) peaks (Figure 5–2). The prominent PCr peak is
often used as the chemical shift reference standard, set
to zero ppm. The chemical shift of unbound inorganic
phosphate (Pi) is dependent on pH and thus may be
used to measure alterations in pH. Information on al-
terations in brain energy metabolism may be gained by
measuring the relative levels of PCr, NTP, and Pi. The
brain resonance peak of phosphomonoester (PME)
arises primarily from the phospholipid precursors
phosphoethanolamine and PCh, as well as from sugar
phosphates. The phosphodiester (PDE) resonance
peak has a broad component (arising from membrane
bilayers) and a narrow component (derived from the
phospholipid catabolites GPC and glycerophospho-
ethanolamine).
Fluorine MRS
Except for trace amounts in bone and teeth, the body
contains no endogenous fluorine. However, several
medications have one or more fluorine (
19
F) atoms in
their active structure. When a fluorinated drug is ad-
ministered exogenously,
19
F acts as a natural, nonra-
dioactive, stable label detectable by MRS. There is no
endogenous background signal. Quantitative analysis
of the fluorine signal can yield brain concentrations of
the medication in question, expectedly more closely
related to the treatment and side effects of the drug
than are plasma concentrations. Pharmacokinetics can
thus be assessed in the target tissue as opposed to
plasma.
Figure 5–1. Proton spectrum recorded on a 4-tesla magnetic resonance scanner of brain tissue in vivo from a
healthy 21-year-old man.
Point-resolved spectroscopy (PRESS) recording from a 6-mL volume localized in the motor cortex, right hemi-
sphere; volume size=6 mL, echo time=23 msec, repetition time=3000 msec, 64 averages. Apodization with line
broadening of 2.5 Hz applied. Abbreviations for peaks: Cho=choline compounds (choline, phosphocholine,
glycerophosphocholine); Cr=creatine and phosphocreatine; Glx=spectral region of peaks for glutamate,
glutamine, and GABA; Ino=myoinositol; NAA=N-acetyl-aspartate; Tau=taurine.
Magnetic Resonance Spectroscopy 109
Carbon-13 MRS
Although carbon is found in the body in abundance, its
most plentiful isotope,
12
C, does not have a magnetic
moment and is thus not detectable by MRS. The MRS-
detectable nucleus
13
C has a natural abundance of 1.1%.
Like
19
F,
13
C MRS has a low endogenous background
signal, but in this case the low background signal is due
to
13
C’s low natural abundance combined with a low
sensitivity. The low background allows for tracer stud-
ies: following administration of a compound enriched
with
13
C (by organic synthesis of a compound in which
the
12
C atoms at a particular position are replaced by
13
C), the
13
C signal from the compound will dominate
the in vivo spectrum. Because naturally occurring me-
tabolites can be labeled in this way,
13
C MRS provides a
means of investigating the kinetics of intermediary me-
tabolism. A main line of investigation with the
13
CMRS
method involves tracing the appearance of breakdown
products of glucose labeled with
13
C in various posi-
tions. Glucose is the main energetic substrate for the
brain, and it is rapidly metabolized by the brain for pro-
duction of ATP via oxidative metabolism. The carbon
backbone of glucose is not wasted, but is rapidly used
to build the essential neurotransmitters glutamate and
glutamine. In particular, the rate of glutamate synthesis
from the moieties of glucose breakdown may thus be
estimated by
13
C MRS methods. This rate is related to
brain glutamatergic activity, which may be altered in
psychiatric disorders. Treatment effects on glutamater-
gic activity may be observed by this method.
Lithium MRS
Lithium is a monovalent cation naturally found in trace
amounts in biological systems; it occupies the same col-
umn as sodium in the periodic table of the elements
and (with an electron shell smaller than that of sodium)
is known to interact with sodium channels. When lith-
ium is used as a mood stabilizer, particularly in bipolar
disorder, tissue levels increase to MRS-detectable lev-
els. Because therapeutic serum levels are in the range of
1 millimole per liter, brain lithium levels may be de-
tected and quantified with relative ease.
Figure 5–2. Phosphorus spectrum recorded on a 4-tesla magnetic resonance scanner of brain tissue in vivo
from a healthy 33-year-old woman.
Spin-echo recording from an axial slice localized at the level of the corpus callosum; slice thickness=25 mm,
field of view=240×240 mm, echo-time=18 msec, repetition time=2000 msec, 64 averages. Apodization with line
broadening of 10 Hz applied. Abbreviations for peaks: α=alpha-NTP; β=beta-NTP; γ=gamma-NTP; NADPH=
nicotinamide adenine dinucleotide phosphate; NTP= nucleoside triphosphate; PCr=phosphocreatine; PDE=
phosphodiester; Pi=inorganic phosphate; PME=phosphomonoester.
110 ESSENTIALS OF NEUROIMAGING FOR CLINICAL PRACTICE
Contributions of Magnetic
Resonance Methods to Clinical
Neuropsychiatric Research
In this section we review some of the clinical areas in
which MRS has made relevant contributions. This
gives the background for the possible future develop-
ments in clinical MR applied to psychiatry.
Cognitive Disorders
Neurodegeneration associated with dementia may be
assessed from NAA levels in the hippocampus, as
demonstrated in early postmortem studies of Alzhei-
mer’s disease and as suggested by in vivo studies of
dementia of the Alzheimer’s type. A current limitation
in Alzheimer’s disease management is the inability to
obtain a definitive diagnosis before death and without
postmortem chemical analysis of the brain tissue for
presence of plaques and tangles. Thus, MRS measure-
ment of NAA levels in regions of the brain related to
memory and executive function—the parahippocam-
pal gyrus, the temporal and frontal lobes—is used in
explorations of cognitive disorders.
Schizophrenia
MRS research in schizophrenia has increased nearly ex-
ponentially in the past dozen years or so. Two major
findings have emerged from the literature. The first is
decreased PME and increased PDE in the frontal lobe,
as determined by
31
P MRS. Overall decreased brain
PDE in schizophrenia patients relative to healthy con-
trol subjects has also been reported. The second major
finding is focal decreases in NAA in the frontal and
temporal lobes in both neuroleptic-naive and treated
patients with schizophrenia.
Affective Illness
Major Depression
Decreased levels of both beta-NTP and total NTP have
been found in the basal ganglia and in the frontal lobes
bilaterally with
31
P MRS. These results are surprising,
given that cerebral ATP levels are expected to be main-
tained at the expense of PCr. However, these data are
consistent with findings in disorders associated with
sustained cerebral hypometabolism.
Increases as well as decreases in the intensity of the
Cho resonance peak have been observed in depressed
populations with
1
H MRS. Variations in findings may
be attributable to differences in the brain regions stud-
ied, in MRS recording conditions, or in characteristics
of the study population. However, baseline estimates
of Cho signal intensity, as well as change with treat-
ment, have been shown to correlate with clinical re-
sponse.
Depressed subjects have been reported to have de-
creased myoinositol levels in the right frontal lobe, de-
tected via
1
H MRS, compared with age- and gender-
matched healthy comparison subjects. This finding
suggests the possibility that the phosphatidylinositol
second-messenger system may be reduced in depres-
sion.
Occipital lobe GABA levels have been reported to
be dramatically reduced, by more than 50%, in patients
with major depression. This finding is in line with the
GABA hypothesis of mood disorders, which posits that
low GABA function is an inherited biological marker
of vulnerability for development of mood disorders.
Reduced glutamate levels in the anterior cingulate
have also been reported in subjects with major depres-
sion. Both glutamate and N-methyl-
D-aspartate recep-
tors have been implicated in the pathophysiology of
depression. Should these findings be replicated, they
will enhance our understanding of the biochemical ba-
sis of this serious illness and could well lead to new
treatment strategies.
Bipolar Disorder
A major finding in a comprehensive series of studies
indicates that frontal lobe PME levels determined by
31
P MRS vary with mood state. In addition, the inten-
sity of the Cho and myoinositol resonance of
1
HMRS
has been shown to be altered in bipolar patients. These
results may be related to the action of lithium, which
inhibits Cho transport across membranes and alters
myoinositol metabolism. Alternatively, these findings
may be closely related to PME variations, considering
that
31
P PME signals derive primarily from PCh and
phosphoethanolamine and that
1
H MRS choline sig-
nals are derived from PCh and GPC.
Anxiety Disorders
Panic Disorder
The ability to assess lactate levels with
1
HMRS has
allowed exploration of lactate’s role in the brain in
Magnetic Resonance Spectroscopy 111
panic attacks. Intravenous infusion of sodium lactate
is known to induce panic attacks in most patients
with panic disorder. A
1
H MRS finding is that lactate-
induced panic is associated with increased and pro-
longed elevations in brain lactate relative to values
observed in comparison subjects. Similar findings
have been observed following controlled hyperventi-
lation in panic patients, suggesting that these indi-
viduals may have increased sensitivity to hypocap-
nia.
Abnormalities of phosphorous metabolism in panic
disorder are also suggested by a
31
PMRS study that re-
ported a significant asymmetry (left > right) of PCr con-
centration in the frontal lobes of patients with panic dis-
order compared with healthy control subjects (Shioiri et
al. 1996). This finding is in line with earlier studies with
SPECT and electroencephalography (EEG), which also
noted frontal lobe right–left asymmetries in patients
with panic disorder.
Another
1
H MRS study demonstrating a 22% re-
duction in total occipital cortex GABA concentration
(GABA plus homocarnosine) in patients with panic
disorder compared with control subjects (Goddard et
al. 2001) provided preliminary evidence that reduction
in GABA levels might contribute to the pathophysiol-
ogy of panic disorder.
Obsessive-Compulsive Disorder
Results from
1
H MRS studies demonstrating decreased
levels of NAA in the striatum and the anterior cingu-
late of obsessive-compulsive disorder (OCD) patients
suggest reduced neuronal density in this region of the
brain, although no significant difference in caudate
volumes between groups has been found. These find-
ings remain controversial, given that other studies
have revealed no differences in NAA levels in the len-
ticular nuclei between OCD and healthy subjects. PET
studies have noted that the basal ganglia may play an
important role in mediating mechanisms of action for
effective treatments in persons with OCD. Thus, MRS
findings of decreased NAA levels in OCD patients are
in line with the hypothesis that orbitofrontal–subcorti-
cal circuit function mediates the symptomatic expres-
sion of OCD.
Treatment-naive children and adolescents with
OCD were found to have increased composite Glx
(glutamate, glutamine, and GABA) resonance peaks in
the
1
H MRS spectrum from the caudate nucleus region
in comparison with healthy control subjects (Rosen-
berg et al. 2000). Because the Glx resonance in the cau-
date region is presumed to derive primarily from
glutamate, these findings suggest a relationship be-
tween OCD and anomalies in glutamatergic function
in the caudate. The composite Glx resonance was
found to decrease significantly with paroxetine treat-
ment in several studies (Moore et al. 1998; Rosenberg et
al. 2000). In addition, decreases in caudate glutamater-
gic concentrations were found to correlate with de-
creases in OCD symptom severity (Rosenberg et al.
2000). These results are consistent with those of a PET
study in adult OCD subjects (Saxena et al. 1999), in
which treatment produced a significant decrease in
glucose metabolism in the orbitofrontal cortex and
right caudate.
Posttraumatic Stress Disorder
1
H MRS studies of NAA levels in the medial temporal
lobes in patients with posttraumatic stress disorder
(PTSD) reveal significantly lower NAA in the right
temporal lobe relative to the left temporal lobe (Free-
man et al. 1998). These findings suggest lateralized de-
creases in neuronal density in medial temporal lobes in
PTSD subjects. This change might be due, in part, to the
initial emotional stress and subsequent high blood cor-
tisol levels. These results are also in line with those of
MRI volumetric studies documenting decreases on the
order of 8% in right hippocampal volumes of PTSD pa-
tients relative to healthy comparison subjects (Bremner
et al. 1995).
Anterior cingulate NAA levels measured via
1
H
MRS in children and adolescents with PTSD were
found to be significantly decreased in comparison with
healthy subjects (De Bellis et al. 2000). The results of
this study suggest that neuronal pathology in the ante-
rior cingulate may mediate symptoms in childhood
PTSD.
Substance Abuse Disorders
Alcohol Abuse
Ethyl alcohol can be detected with
1
HMRS, and subjec-
tive reports of intoxication have been shown to parallel
1
H MRS measurement of brain alcohol levels. Studies
with
1
H MRS have suggested that alcohol tolerance
may be determined by differences in the interaction of
ethanol with brain membranes, possibly reflecting de-
creased membrane fluidity.
The neurochemical effects of medications used to
treat alcoholism have been explored with
1
HMRS in
healthy volunteer subjects. Acamprosate, which has
been found to be useful in maintaining abstinence fol-
lowing alcohol withdrawal in chronic alcoholism, was
112 ESSENTIALS OF NEUROIMAGING FOR CLINICAL PRACTICE
shown to decrease brain
1
H MR spectral intensities in
regions in which glutamate and NAA are the main sig-
nal contributors, at time points associated with maxi-
mum plasmatic concentration (Bolo et al. 1998). These
results are consistent with a central glutamatergic ac-
tion of acamprosate, which has been demonstrated by
microdialysis measurements taken in the nucleus ac-
cumbens of rats (Dahchour et al. 1998). Hypotheses for
mechanisms of action of medication treatments can
thus be explored with
1
HMRS methods.
Cocaine and Polydrug Abuse
Cocaine users have been reported to show decreased
NAA in the frontal cortex and increased myoinositol
in frontal gray and white matter (Chang et al. 1997).
Decreased levels of NAA in the left thalamus have
been found in chronic cocaine abusers compared with
healthy comparison subjects (Li et al. 1999). An assess-
ment of the intensity of basal ganglia
1
HMRS metabo-
lite resonances following acute administration of co-
caine in healthy subjects revealed increased levels of
Cho and NAA in the basal ganglia, possibly consistent
with cell swelling (Christensen et al. 2000).
In addition, altered brain phospholipid metabolites
in cocaine-dependent polysubstance abusers have
been demonstrated by
31
P MRS (MacKay et al. 1993).
Polysubstance (cocaine and heroin)–abusing men had
increased PME and decreased ATP levels compared
with healthy comparison subjects (Christensen et al.
1996). Cerebral PME and PDE levels are increased and
PCr level is decreased in opiate-dependent polydrug
abusers (Kaufman et al. 1999).
Current Trends in Clinical
Psychiatric Magnetic
Resonance
Diagnosis
In pathological processes characterized by gross struc-
tural changes, such as the neurodegenerative demen-
tias, large MRS changes accompany the changes that
are observable by MRI. The added diagnostic value of
the MRS information is limited in such disorders, given
that massive neuronal cell death will already be obvi-
ous from other neuroimaging modalities. MRS studies
are expected to be most valuable when they are able to
discern small biochemical changes undetectable by
other modalities. For Alzheimer’s disease, detection of
decreases in NAA levels in the parahippocampal gyrus
offers potential for early detection of loss of viable neu-
rons indicative of a neurodegenerative process.
The diagnostic value of MRS combined with other
MR methods has been well demonstrated in the evalu-
ation of epilepsy. In unilateral mesial temporal lobe ep-
ilepsy, the combined measurement of NAA level and
T2 relaxation time was able to classify hippocampus
anomalies (Namer et al. 1999). Low NAA and elevated
T2 values corresponded to abnormalities observed in
sclerotic ipsilateral hippocampus, whereas low NAA
with slightly elevated or normal T2 values was found
contralaterally. Furthermore, the combined measure-
ment was shown to correlate with both clinical severity
and memory performance. Left hippocampal injury
evaluated by NAA levels and by T2 relaxation time
measurements correlated with verbal memory scores,
and right hippocampal injury correlated with visual
memory scores. The value of the combined MRS–MR
examination in presurgical evaluation of patients lies
in the ability to detect changes in the contralateral hip-
pocampus that present no anomalies in other neuroim-
aging modalities.
Treatment Planning
Several studies that used quantitative MRS methods to
determine steady-state brain concentrations of the se-
lective serotonin reuptake inhibitors (SSRIs) fluvoxa-
mine and fluoxetine yielded similar results (Bolo et al.
2000; Renshaw et al. 1992; Strauss et al. 1997). This con-
vergence of results is promising for the goal of
19
FMRS
to attain clinical usefulness as an aid in elucidating
treatment and side effects. The differences in brain-to-
serum ratios of fluvoxamine in major depressive disor-
der versus obsessive-compulsive disorder found by
19
F MRS in separate studies (Bolo et al. 2000; Strauss et
al. 1997) indicate that
19
F MRS may be used to charac-
terize metabolic profile responses to the SSRIs in differ-
ent patient populations. Individual pharmacokinetic
profiles of SSRIs may prove useful to the clinician for
dosage and treatment planning.
Future Directions
Psychotropic Drug Development
MRS may be performed in conjunction with adminis-
tration to healthy volunteers of a medication with a
known treatment effect. Baseline metabolic profiles ob-
Magnetic Resonance Spectroscopy 113
tained via MRS may be compared with postadminis-
tration profiles. The changes observed in the brain
spectrum after administration—which hypothetically
should be related to action of the medication—may be
used to explore the mechanism of action of the medica-
tion. The MRS recording, derived from a volume of in-
terest inside the brain, provides an objective measure-
ment of the treatment’s biochemical effects in the
central nervous system (CNS). In the case where a
drug has well-characterized efficacy or behavioral ef-
fects in a given patient population, the additional in-
formation provided by the MRS recordings should
help to elucidate the links between the drug’s struc-
ture, pharmacology, and biochemistry and its treat-
ment effect. Medications could thus be described by
their in vivo metabolic profiles. With MRS, the meta-
bolic effect is measured directly in the target organ.
Further development of research along these lines
could lead to new target profiles that would be based
on in vivo CNS biochemical drug effects as assessed by
MRS methods.
Just as knowledge is gained through assessment of
the neurochemical dynamics associated with medica-
tions with established treatment efficacy records, the
pharmacological challenge method applied with MRS
should likewise open new pathways for exploring un-
derlying mechanisms of psychiatric disorders. Com-
pounds whose effects reversibly simulate one or sev-
eral aspects of a behavioral symptom associated with a
disorder can be administered under well-controlled
conditions to healthy volunteers. In vivo assessment of
CNS metabolites via MRS can track the link between
the dynamics both of behavior and of the underlying
neurochemistry. Because these methods are founded
on rigorous experimental control of very specific re-
versible effects, they have the potential to yield the
highly reliable and reproducible results required for
evaluation of new treatments.
The same MRS methodology can thus be extended
to the development of new compounds. In the realm
of treatments for psychiatric disorders, the behavioral
target is often a particular neurotransmitter system.
The MRS recording in vivo may provide a means to
determine whether the newly developed compound
is acting upon that system in the expected way. In
characterizing the CNS effects of new compounds un-
der development, studies that simultaneously record
CNS chemistry by MRS and behavioral effects by in-
teractive neurocognitive testing should be of great
value. The correlation between behavioral scores and
neurochemical dynamics needs to be further ex-
plored. Research that establishes links between spe-
cific behavioral effects and neurochemical effects as-
sessed by MRS should provide a powerful means of
evaluating the potential treatment efficacy of new
compounds. As with early diagnosis of neurodegen-
erative diseases, the added value of MRS in psycho-
pharmacology resides in its potential to detect chemi-
cal changes before massive behavioral effects are
present or when behavioral testing yields contradic-
tory or unreliable results. In this sense, with further
development of well-designed experimental meth-
ods, MRS has the potential to yield surrogate markers
for many psychiatric disorders and their treatment ef-
fects. The pharmacological challenge method pro-
vides an example of how such a marker would work:
the MRS-observed change induced by the pharmaco-
logical challenge should be reversed or blocked by the
new treatment.
The particular ability of
13
C MRS to track glutama-
tergic and glutaminergic neurotransmitter dynamics
with drug administration should lead to more rapid
development of treatments for the disorders involving
these pathways. The glutamatergic neurotransmitter
system has been implicated in schizophrenia, mood
disorders, and anxiety disorders; thus, it may become
an immediate candidate as a new pharmacological tar-
get for these disorders.
13
C MRS can help explore the
CNS effects of such novel treatment strategies.
Evaluation of Potential
Treatment Efficacy
MRS can be used to evaluate the potential efficacy of a
treatment by characterizing the neurochemical effects
of the treatment in specific areas of the brain. Levels of
NAA in the hippocampus have been shown to corre-
late with memory function. In the same way that re-
stored NAA levels indicate restored function in epi-
lepsy or dementias, other MRS markers in specific
areas may provide a means of evaluating whether
treatments are likely to be efficacious. Such markers
could have value for early identification of likely re-
sponders and nonresponders to a given medication.
For example, further investigations by MRS confirm-
ing the link between the neurotransmitter GABA and
anxiety could lead to evaluation of panic disorder
treatments by their ability to restore GABA levels.
Glutamate levels or glutamate synthesis rates observed
in the prefrontal cortex by
13
CMRS could be good can-
didates to help evaluate treatment potential in mood,
anxiety, or psychosis-related disorders.
This page intentionally left blank
117
6
Electroencephalography,
Event-Related
Potentials, and
Magnetoencephalography
Gina R. Kuperberg, M.D., Ph.D.
In this chapter I discuss the use of electroencephalog-
raphy, event-related potentials, and magnetoencepha-
lography in psychiatry. Of these three measures, elec-
troencephalography is the only one that is currently
used in standard psychiatric clinical practice, and even
here, its main use is to exclude certain neurological dis-
orders in the differential diagnosis of psychiatric disor-
ders. Event-related potentials and magnetoencepha-
lography currently have no direct clinical applications
in psychiatry. Nonetheless, they are both the focus of
intense research interest. This is because these meth-
ods, of all the noninvasive neuroimaging techniques,
provide the most direct measure of neurocognitive
function with the greatest temporal resolution.
The main aim of this chapter is to serve as in intro-
duction to each of these techniques. Each section be-
gins with a description of how the relevant signals are
extracted, followed by a summary of some of the tech-
nique’s applications in psychiatric clinical practice or
research.
The Electroencephalogram
Generation of Signal
Conventional Electroencephalography
If a pair of electrodes is attached to the surface of the
scalp and connected to an amplifier, the output of the
amplifier shows a variation in voltage over time. This
pattern of voltage variation is known as the electroen-
cephalogram (EEG). The amplitude of the normal EEG
varies between approximately –100 and +100 micro-