Hospitality management accounting phần 6 pot
Bạn đang xem bản rút gọn của tài liệu. Xem và tải ngay bản đầy đủ của tài liệu tại đây (965.51 KB, 63 trang )
The owner’s analysis seemed to indicate that he should close to eliminate
the $30,000 loss during the 2-month loss period. But if he does, the fixed costs
for the 2 months ($42,000) will have to be paid out of the ten months’ net in-
come, and $90,000 (10 months net income) less two months fixed costs of
$42,000 will reduce his annual net income to $48,000 from its current $60,000.
If he does not want a reduction in annual net income, he should not close.
In such a situation, there might be other factors that need to be considered,
and that would reinforce the decision to stay open. For example, there could be
sizable additional close-down and start-up costs that would have to be included
in the calculation of the cost of closing.
Also, would key employees return after being laid off? Is there a large
enough pool of skilled labor available and willing to work on a seasonal basis
only? Would there be recurring training time (and costs) at the start of each new
season? Is there a group of regular guests that might not return if the motel was
closed for two months? These are some of the types of questions that would
have to be answered before any final decision to close was made.
WHICH BUSINESS
SHOULD WE BUY?
Just as a business manager has to make choices between alternatives on a
day-to-day basis, so, too, does an entrepreneur going into business or expand-
ing an existing business. Let us look at one such situation.
A restaurant chain is eager to expand. It has an opportunity to take over one
of two similar existing restaurants. The two restaurants are close to each other,
they have the same type of clientele and size of operation, and the asking price
is the same for each. They are also similar in that each is taking in $1,000,000
in sales revenue a year, and each has a net income of $100,000 a year. With
only this information it is difficult to make a decision as to which would be the
more profitable investment. But a cost analysis as shown in Exhibit 7.1 reveals
differences.
302 CHAPTER 7 COST MANAGEMENT
Restaurant A
Sales revenue $
ᎏ
ᎏ
1
ᎏ
ᎏ
,
ᎏ
ᎏ
0
ᎏ
ᎏ
0
ᎏ
ᎏ
0
ᎏ
ᎏ
,
ᎏ
ᎏ
0
ᎏ
ᎏ
0
ᎏ
ᎏ
0
ᎏ
ᎏ
1
ᎏ
ᎏ
0
ᎏ
ᎏ
0
ᎏ
ᎏ
.
ᎏ
ᎏ
0
ᎏ
ᎏ
%
ᎏ
ᎏ
$
ᎏ
ᎏ
1
ᎏ
ᎏ
,
ᎏ
ᎏ
0
ᎏ
ᎏ
0
ᎏ
ᎏ
0
ᎏ
ᎏ
,
ᎏ
ᎏ
0
ᎏ
ᎏ
0
ᎏ
ᎏ
0
ᎏ
ᎏ
1
ᎏ
ᎏ
0
ᎏ
ᎏ
0
ᎏ
ᎏ
.
ᎏ
ᎏ
0
ᎏ
ᎏ
%
ᎏ
ᎏ
Variable costs $ 500,000 50.0% $ 300,000 30.0%
Fixed costs
ᎏᎏ
ᎏ
4
ᎏ
0
ᎏ
0
ᎏ
,
ᎏ
0
ᎏ
0
ᎏ
0
ᎏᎏ
4
ᎏ
0
ᎏ
.
ᎏ
0
ᎏ
%
ᎏ
ᎏᎏ
ᎏ
6
ᎏ
0
ᎏ
0
ᎏ
,
ᎏ
0
ᎏ
0
ᎏ
0
ᎏᎏ
6
ᎏ
0
ᎏ
.
ᎏ
0
ᎏ
%
ᎏ
Total costs $
ᎏᎏ
ᎏ
9
ᎏ
0
ᎏ
0
ᎏ
,
ᎏ
0
ᎏ
0
ᎏ
0
ᎏ
ᎏ
ᎏ
9
ᎏ
ᎏ
0
ᎏ
ᎏ
.
ᎏ
ᎏ
0
ᎏ
ᎏ
%
ᎏ
ᎏ
$
ᎏᎏ
ᎏ
9
ᎏ
0
ᎏ
0
ᎏ
,
ᎏ
0
ᎏ
0
ᎏ
0
ᎏᎏ
9
ᎏ
0
ᎏ
.
ᎏ
0
ᎏ
%
ᎏ
Net Income $
ᎏ
ᎏ
ᎏ
ᎏ
ᎏ
ᎏ
1
ᎏ
ᎏ
0
ᎏ
ᎏ
0
ᎏ
ᎏ
,
ᎏ
ᎏ
0
ᎏ
ᎏ
0
ᎏ
ᎏ
0
ᎏ
ᎏ
ᎏ
ᎏ
1
ᎏ
ᎏ
0
ᎏ
ᎏ
.
ᎏ
ᎏ
0
ᎏ
ᎏ
%
ᎏ
ᎏ
$
ᎏ
ᎏ
ᎏ
ᎏ
ᎏ
ᎏ
1
ᎏ
ᎏ
0
ᎏ
ᎏ
0
ᎏ
ᎏ
,
ᎏ
ᎏ
0
ᎏ
ᎏ
0
ᎏ
ᎏ
0
ᎏ
ᎏ
ᎏ
ᎏ
1
ᎏ
ᎏ
0
ᎏ
ᎏ
.
ᎏ
ᎏ
0
ᎏ
ᎏ
%
ᎏ
ᎏ
EXHIBIT 7.1
Statements Showing Differences in Cost Structure
Restaurant B
4259_Jagels_07.qxd 4/14/03 10:54 AM Page 302
Although the sales revenue and net income are the same for each restau-
rant, the structure of their costs is different, and this will affect the decision of
which one could be more profitable. The restaurant chain that wishes to take
over either A or B is optimistic about the future. It believes that, without any
change in fixed costs, it can increase annual sales revenue by 10 percent. What
effects will this have on the net income of A and B? Net income will not in-
crease for each restaurant by the same amount. Restaurant A’s variable cost is
50 percent. This means that, out of each dollar of additional sales revenue, it
will have variable expenses of $0.50 and a net income of $0.50 (fixed costs do
not increase). Restaurant B has variable costs of 30 percent, or $0.30 out of each
revenue dollar, leaving a net income of $0.70 from each dollar of extra sales
revenue (again, fixed costs do not change).
Assuming a 10 percent increase in sales revenue and no new fixed costs,
the income statements of the two restaurants have been recalculated in Exhibit
7.2. Note that Restaurant A’s net income has gone up by $50,000 (to $150,000),
but Restaurant B’s has gone up by $70,000 (to $170,000). In this situation, Res-
taurant B would be the better investment.
A company that has high fixed costs relative to variable costs is said to have
high operating leverage. From a net income point of view, it will do better in
times of rising sales revenue than will a company with low operating leverage
WHICH BUSINESS SHOULD WE BUY? 303
Restaurant A
Sales revenue $
ᎏ
ᎏ
1
ᎏ
ᎏ
,
ᎏ
ᎏ
1
ᎏ
ᎏ
0
ᎏ
ᎏ
0
ᎏ
ᎏ
,
ᎏ
ᎏ
0
ᎏ
ᎏ
0
ᎏ
ᎏ
0
ᎏ
ᎏ
1
ᎏ
ᎏ
0
ᎏ
ᎏ
0
ᎏ
ᎏ
.
ᎏ
ᎏ
0
ᎏ
ᎏ
%
ᎏ
ᎏ
$
ᎏ
ᎏ
1
ᎏ
ᎏ
,
ᎏ
ᎏ
1
ᎏ
ᎏ
0
ᎏ
ᎏ
0
ᎏ
ᎏ
,
ᎏ
ᎏ
0
ᎏ
ᎏ
0
ᎏ
ᎏ
0
ᎏ
ᎏ
1
ᎏ
ᎏ
0
ᎏ
ᎏ
0
ᎏ
ᎏ
.
ᎏ
ᎏ
0
ᎏ
ᎏ
%
ᎏ
ᎏ
Variable costs $ 550,000 50.0% $ 330,000 30.0%
Fixed costs
ᎏᎏ
ᎏ
4
ᎏ
0
ᎏ
0
ᎏ
,
ᎏ
0
ᎏ
0
ᎏ
0
ᎏᎏ
3
ᎏ
6
ᎏ
.
ᎏ
4
ᎏ
%
ᎏ
ᎏ
ᎏ
ᎏ
6
ᎏ
0
ᎏ
0
ᎏ
,
ᎏ
0
ᎏ
0
ᎏ
0
ᎏᎏ
5
ᎏ
4
ᎏ
.
ᎏ
5
ᎏ
%
ᎏ
Total costs $
ᎏ
ᎏ
ᎏ
ᎏ
ᎏ
ᎏ
9
ᎏ
ᎏ
5
ᎏ
ᎏ
0
ᎏ
ᎏ
,
ᎏ
ᎏ
0
ᎏ
ᎏ
0
ᎏ
ᎏ
0
ᎏ
ᎏ
ᎏ
ᎏ
8
ᎏ
ᎏ
6
ᎏ
ᎏ
.
ᎏ
ᎏ
4
ᎏ
ᎏ
%
ᎏ
ᎏ
$
ᎏ
ᎏ
ᎏ
ᎏ
ᎏ
ᎏ
9
ᎏ
ᎏ
3
ᎏ
ᎏ
0
ᎏ
ᎏ
,
ᎏ
ᎏ
0
ᎏ
ᎏ
0
ᎏ
ᎏ
0
ᎏ
ᎏ
ᎏ
ᎏ
8
ᎏ
ᎏ
4
ᎏ
ᎏ
.
ᎏ
ᎏ
5
ᎏ
ᎏ
%
ᎏ
ᎏ
Net Income $
ᎏ
ᎏ
ᎏ
ᎏ
ᎏ
ᎏ
1
ᎏ
ᎏ
5
ᎏ
ᎏ
0
ᎏ
ᎏ
,
ᎏ
ᎏ
0
ᎏ
ᎏ
0
ᎏ
ᎏ
0
ᎏ
ᎏ
ᎏ
ᎏ
1
ᎏ
ᎏ
3
ᎏ
ᎏ
.
ᎏ
ᎏ
6
ᎏ
ᎏ
%
ᎏ
ᎏ
$
ᎏ
ᎏ
ᎏ
ᎏ
ᎏ
ᎏ
1
ᎏ
ᎏ
7
ᎏ
ᎏ
0
ᎏ
ᎏ
,
ᎏ
ᎏ
0
ᎏ
ᎏ
0
ᎏ
ᎏ
0
ᎏ
ᎏ
ᎏ
ᎏ
1
ᎏ
ᎏ
5
ᎏ
ᎏ
.
ᎏ
ᎏ
5
ᎏ
ᎏ
%
ᎏ
ᎏ
EXHIBIT 7.2
Effect of Increased Sales Revenue on Costs and Net Income
Restaurant B
Restaurant A
Sales revenue $
ᎏ
ᎏ
9
ᎏ
ᎏ
0
ᎏ
ᎏ
0
ᎏ
ᎏ
,
ᎏ
ᎏ
0
ᎏ
ᎏ
0
ᎏ
ᎏ
0
ᎏ
ᎏ
1
ᎏ
ᎏ
0
ᎏ
ᎏ
0
ᎏ
ᎏ
.
ᎏ
ᎏ
0
ᎏ
ᎏ
%
ᎏ
ᎏ
$
ᎏ
ᎏ
9
ᎏ
ᎏ
0
ᎏ
ᎏ
0
ᎏ
ᎏ
,
ᎏ
ᎏ
0
ᎏ
ᎏ
0
ᎏ
ᎏ
0
ᎏ
ᎏ
1
ᎏ
ᎏ
0
ᎏ
ᎏ
0
ᎏ
ᎏ
.
ᎏ
ᎏ
0
ᎏ
ᎏ
%
ᎏ
ᎏ
Variable costs $450,000 50.0% $270,000 30.0%
Fixed costs
ᎏ
4
ᎏ
0
ᎏ
0
ᎏ
,
ᎏ
0
ᎏ
0
ᎏ
0
ᎏᎏ
4
ᎏ
4
ᎏ
.
ᎏ
4
ᎏ
%
ᎏ
ᎏ
6
ᎏ
0
ᎏ
0
ᎏ
,
ᎏ
0
ᎏ
0
ᎏ
0
ᎏᎏ
6
ᎏ
6
ᎏ
.
ᎏ
7
ᎏ
%
ᎏ
Total costs $
ᎏ
ᎏ
8
ᎏ
ᎏ
5
ᎏ
ᎏ
0
ᎏ
ᎏ
,
ᎏ
ᎏ
0
ᎏ
ᎏ
0
ᎏ
ᎏ
0
ᎏ
ᎏ
ᎏ
ᎏ
9
ᎏ
ᎏ
4
ᎏ
ᎏ
.
ᎏ
ᎏ
4
ᎏ
ᎏ
%
ᎏ
ᎏ
$
ᎏ
ᎏ
8
ᎏ
ᎏ
7
ᎏ
ᎏ
0
ᎏ
ᎏ
,
ᎏ
ᎏ
0
ᎏ
ᎏ
0
ᎏ
ᎏ
0
ᎏ
ᎏ
ᎏ
ᎏ
9
ᎏ
ᎏ
6
ᎏ
ᎏ
.
ᎏ
ᎏ
7
ᎏ
ᎏ
%
ᎏ
ᎏ
Net Income $
ᎏ
ᎏ
ᎏ
ᎏ
5
ᎏ
ᎏ
0
ᎏ
ᎏ
,
ᎏ
ᎏ
0
ᎏ
ᎏ
0
ᎏ
ᎏ
0
ᎏ
ᎏ
ᎏ
ᎏ
ᎏ
ᎏ
5
ᎏ
ᎏ
.
ᎏ
ᎏ
6
ᎏ
ᎏ
%
ᎏ
ᎏ
$
ᎏ
ᎏ
ᎏ
ᎏ
3
ᎏ
ᎏ
0
ᎏ
ᎏ
,
ᎏ
ᎏ
0
ᎏ
ᎏ
0
ᎏ
ᎏ
0
ᎏ
ᎏ
ᎏ
ᎏ
ᎏ
ᎏ
3
ᎏ
ᎏ
.
ᎏ
ᎏ
3
ᎏ
ᎏ
%
ᎏ
ᎏ
EXHIBIT 7.3
Effect of Decreased Sales Revenue on Costs and Net Income
Restaurant B
4259_Jagels_07.qxd 4/14/03 10:54 AM Page 303
(low fixed costs relative to variable costs). A company with low fixed costs will
be better off when sales revenue starts to decline. Exhibit 7.3 illustrates this, un-
der the assumptions that our two restaurants are going to have a decline in sales
revenue of 10 percent from the present $1,000,000 level and that there will be
no change in fixed costs. Exhibit 7.3 shows that, with declining sales revenue,
Restaurant A’s net income will be higher than Restaurant B’s.
In fact, if sales revenue declines far enough, Restaurant B will be in financial
difficulty long before Restaurant A. If the breakeven point were calculated (the
breakeven point is that level of sales revenue at which there will be neither net
income nor loss), Restaurant A’s sales revenue could go down to $800,000, while
Restaurant B would be in difficulty at $857,143. This is illustrated in Exhibit 7.4.
One could determine the breakeven level of sales revenue by trial and er-
ror, but there is a formula for quickly calculating this level. The formula, and a
more in-depth discussion of fixed and variable costs and how an awareness of
this structure can be of great value in many types of business decisions, is called
cost–volume–profit (CVP) analysis and is covered in Chapter 8.
PAYING A FIXED
OR A VARIABLE LEASE
Another situation where fixed and variable cost knowledge can be very use-
ful is in comparing the alternative of a fixed cost lease versus a variable cost
lease, based on a percentage of sales. For example, consider the case of a res-
taurant that has an opportunity to pay a fixed rent for its premises of $5,000 a
month ($60,000 a year) or a variable rent of 6 percent of its revenue. Before
making the decision, the restaurant’s management needs to first determine the
breakeven point of sales at which the fixed rental payment for a year would be
identical to the variable rent. The equation for this is
Fixed cost lease ؍ Variable cost lease
304 CHAPTER 7 COST MANAGEMENT
Restaurant A
Sales revenue $
ᎏ
ᎏ
8
ᎏ
ᎏ
0
ᎏ
ᎏ
0
ᎏ
ᎏ
,
ᎏ
ᎏ
0
ᎏ
ᎏ
0
ᎏ
ᎏ
0
ᎏ
ᎏ
1
ᎏ
ᎏ
0
ᎏ
ᎏ
0
ᎏ
ᎏ
.
ᎏ
ᎏ
0
ᎏ
ᎏ
%
ᎏ
ᎏ
$
ᎏ
ᎏ
8
ᎏ
ᎏ
5
ᎏ
ᎏ
7
ᎏ
ᎏ
,
ᎏ
ᎏ
1
ᎏ
ᎏ
4
ᎏ
ᎏ
3
ᎏ
ᎏ
1
ᎏ
ᎏ
0
ᎏ
ᎏ
0
ᎏ
ᎏ
.
ᎏ
ᎏ
0
ᎏ
ᎏ
%
ᎏ
ᎏ
Variable costs $400,000 50.0% $257,143 30.0%
Fixed costs
ᎏ
4
ᎏ
0
ᎏ
0
ᎏ
,
ᎏ
0
ᎏ
0
ᎏ
0
ᎏᎏ
5
ᎏ
0
ᎏ
.
ᎏ
0
ᎏ
%
ᎏ
ᎏ
6
ᎏ
0
ᎏ
0
ᎏ
,
ᎏ
0
ᎏ
0
ᎏ
0
ᎏᎏ
7
ᎏ
0
ᎏ
.
ᎏ
0
ᎏ
%
ᎏ
Total costs $
ᎏ
ᎏ
8
ᎏ
ᎏ
0
ᎏ
ᎏ
0
ᎏ
ᎏ
,
ᎏ
ᎏ
0
ᎏ
ᎏ
0
ᎏ
ᎏ
0
ᎏ
ᎏ
1
ᎏ
ᎏ
0
ᎏ
ᎏ
0
ᎏ
ᎏ
.
ᎏ
ᎏ
0
ᎏ
ᎏ
%
ᎏ
ᎏ
$
ᎏ
ᎏ
8
ᎏ
ᎏ
5
ᎏ
ᎏ
7
ᎏ
ᎏ
,
ᎏ
ᎏ
1
ᎏ
ᎏ
4
ᎏ
ᎏ
3
ᎏ
ᎏ
1
ᎏ
ᎏ
0
ᎏ
ᎏ
0
ᎏ
ᎏ
.
ᎏ
ᎏ
0
ᎏ
ᎏ
%
ᎏ
ᎏ
Normal Income -0- -0- -0- -0-
EXHIBIT 7.4
Breakeven Sales Revenue Level Depends on Cost Structure
Restaurant B
4259_Jagels_07.qxd 4/14/03 10:54 AM Page 304
Or it can be restated as
Annual breakeven sales revenue ؍
Inserting the figures, we can determine the sales revenue level as follows:
؍ $
ᎏ
ᎏ
1
ᎏ
ᎏ
,
ᎏ
ᎏ
0
ᎏ
ᎏ
0
ᎏ
ᎏ
0
ᎏ
ᎏ
,
ᎏ
ᎏ
0
ᎏ
ᎏ
0
ᎏ
ᎏ
0
ᎏ
ᎏ
In other words, at $1,000,000 of sales it makes no difference whether the res-
taurant paid a fixed rent of $60,000 or a variable rent of 6 percent of sales. At
this level of sales, management would be indifferent and it is often referred to
as the indifference point.
If management expected revenue to exceed $1,000,000, it would select a
fixed-rental arrangement. If sales revenue were expected to be below $1,000,000,
it would be better off selecting the percentage-of-sales arrangement.
SEPARATING COSTS INTO
FIXED AND VARIABLE ELEMENTS
Once costs have been categorized into fixed or variable elements, valuable
information is available for use in decision making. Some costs are easy to iden-
tify as definitely fixed or definitely variable. The semifixed or semivariable types
of costs must be broken down into the two separate elements.
A number of different methods are available for breaking down these semi-
costs into their fixed and variable components, some more sophisticated (and
thus usually more accurate) than others. Three will be discussed:
High–low method
Multipoint graph method
Regression analysis method
To set the stage, we will use the income statement of the Model Motel for
a year’s period (see Exhibit 7.5). The Model Motel is a no-frills, 70-unit bud-
get operation without food or beverage facilities. It operates at 59.9 percent oc-
cupancy and, as a result of good cost controls, is able to keep its average room
rate down to $40.00. Last year it sold a total of 15,300 rooms ($612,000 total
income divided by $40.00).
The first step is to list the expenses by category (fixed, variable, semivari-
able). The owner’s or manager’s past experience about the costs of the Model
Motel, or the past year’s accounting records, will be helpful in creating this list.
$60,000
ᎏ
6%
Fixed lease cost
ᎏᎏᎏ
Variable lease percentage
SEPARATING COSTS INTO FIXED AND VARIABLE ELEMENTS 305
4259_Jagels_07.qxd 4/14/03 10:54 AM Page 305
The figures in the fixed column (see Exhibit 7.6) are those that do not change
during the year with a change in sales volume (number of rooms sold). A fixed
cost may change from year to year (e.g., insurance rates may change or man-
agement may decide to vary the amount spent on insurance), however, such
changes are not directly related to, or caused by, the number of guests accom-
modated. The items in the variable column are the costs that are the direct re-
sult of guests using the facilities (if there are no guests or customers, there will
306 CHAPTER 7 COST MANAGEMENT
Sales revenue $612,000
Expenses
Employee wages $241,600
Management salary 40,000
Laundry, linen, and guest supplies 77,400
Advertising 15,000
Maintenance 34,600
Utilities 36,200
Office/telephone 8,000
Insurance 9,200
Interest 16,600
Property taxes 40,200
Depreciation
ᎏᎏ
7
ᎏ
0
ᎏ
,
ᎏ
0
ᎏ
0
ᎏ
0
ᎏ
Total expenses (
ᎏ
5
ᎏ
8
ᎏ
8
ᎏ
,
ᎏ
8
ᎏ
0
ᎏ
0
ᎏ
)
Net income $
ᎏ
ᎏ
ᎏ
ᎏ
2
ᎏ
ᎏ
3
ᎏ
ᎏ
,
ᎏ
ᎏ
2
ᎏ
ᎏ
0
ᎏ
ᎏ
0
ᎏ
ᎏ
EXHIBIT 7.5
Income Statement Without a Cost Breakdown
Fixed Variable Semivariable
Employee wages $241,600
Management salary $40,000
Laundry, linen, and guest supplies $77,400
Advertising 15,000
Maintenance 34,600
Utilities 36,200
Office/telephone 8,000
Insurance 9,200
Interest 16,600
Property taxes 40,200
Depreciation 70,000
EXHIBIT 7.6
Costs Allocated as Fixed, Variable, and Semivariable
4259_Jagels_07.qxd 4/14/03 10:54 AM Page 306
be no cost for laundry, linen, and guest supplies). As occupancy levels increase
or decrease, the variable costs will also increase or decrease proportionally. The
figures in the semivariable column are those we must separate into their fixed
and variable components.
To demonstrate the three methods of breaking down a semivariable cost, we
will use the wages cost of $241,600. Since much of the wage cost is related to
number of rooms sold, we need a month-by-month breakdown of the sales rev-
enue for each month and the related wage cost for each month. This informa-
tion could be broken down by week, but there should be sufficient accuracy for
all practical purposes with a monthly analysis. The sales and labor cost break-
down is given in Exhibit 7.7. Note that the sales column figures are in numbers
of units sold. This column could have been expressed in dollars of sales rev-
enue without it affecting our results (as long as the average room rate of $40.00
had been relatively consistent during the year).
HIGH–LOW METHOD
The high–low method is also called the maximum-minimum method. It
has three steps. With reference to Exhibit 7.7, note that the month of August is
identified as the high month, which identifies it as the month with the highest
units sold and the highest wage costs. In contrast, January is the low month, and
HIGH—LOW METHOD 307
Units (Rooms) Sold Wage Costs
January (low month) 500 $ 14,400
February 1,000 15,800
March 1,300 19,800
April 1,200 21,600
May 1,400 24,400
June 1,500 24,200
July 2,100 26,200
August (high month) 2,100 26,400
September 1,500 23,600
October 1,000 15,200
November 1,000 14,800
December
ᎏᎏ
ᎏ
7
ᎏ
0
ᎏ
0
ᎏᎏᎏ
1
ᎏ
5
ᎏ
,
ᎏ
2
ᎏ
0
ᎏ
0
ᎏ
Totals 1
ᎏ
ᎏ
5
ᎏ
ᎏ
,
ᎏ
ᎏ
3
ᎏ
ᎏ
0
ᎏ
ᎏ
0
ᎏ
ᎏ
$
ᎏ
ᎏ
2
ᎏ
ᎏ
4
ᎏ
ᎏ
1
ᎏ
ᎏ
,
ᎏ
ᎏ
6
ᎏ
ᎏ
0
ᎏ
ᎏ
0
ᎏ
ᎏ
EXHIBIT 7.7
Analysis of Units Sold and Wage Costs by Month
4259_Jagels_07.qxd 4/14/03 10:54 AM Page 307
Instead of using units and wage costs to determine variable costs of units
sold, sales revenue could be used equally as well to separate wages costs into
its fixed and variable elements. This method determines the variable cost per
dollar of sales revenue:
shows units sold and wage costs were at their lowest for the year. To use this
method, the change in costs that has occurred between the high and low months
depends on the change in sales volume (the delta symbol ⌬ represents change).
308 CHAPTER 7 COST MANAGEMENT
Step 1: Deduct the low figure from the high figure of each unit and cost
categories:
Units (Rooms) Sold Wage Costs
August (high) 2,100 $26,400
January (low) (
ᎏ
ᎏ
5
ᎏ
0
ᎏ
0
ᎏ
)(
ᎏ
1
ᎏ
4
ᎏ
,
ᎏ
4
ᎏ
0
ᎏ
0
ᎏ
)
Change ⌬ 1
ᎏ
ᎏ
,
ᎏ
ᎏ
6
ᎏ
ᎏ
0
ᎏ
ᎏ
0
ᎏ
ᎏ
⌬ $
ᎏ
ᎏ
1
ᎏ
ᎏ
2
ᎏ
ᎏ
,
ᎏ
ᎏ
0
ᎏ
ᎏ
0
ᎏ
ᎏ
0
ᎏ
ᎏ
Step 2: Divide the change in wage costs by the change in units sold:
ϭϭ$
ᎏ
ᎏ
7
ᎏ
ᎏ
.
ᎏ
ᎏ
5
ᎏ
ᎏ
0
ᎏ
ᎏ
Variable cost (VC) per unit sold
Step 3: Use the VC per unit answer in Step 2 to calculate the fixed cost
element:
Total wage costs for August (high) $26,400
Variable cost [2,100 units sold ϫ $7.50 a unit] ϭ (
ᎏ
1
ᎏ
5
ᎏ
,
ᎏ
7
ᎏ
5
ᎏ
0
ᎏ
)
Fixed cost $
ᎏ
ᎏ
1
ᎏ
ᎏ
0
ᎏ
ᎏ
,
ᎏ
ᎏ
6
ᎏ
ᎏ
5
ᎏ
ᎏ
0
ᎏ
ᎏ
Using the same procedures, the low wage costs and low units sold, and the
variable cost per unit, the same fixed cost can be found:
Total wage costs for January (low) $14,400
Variable cost [500 units sold ϫ $7.50 a unit] ϭ (
ᎏ
ᎏᎏ
3
ᎏ
,
ᎏ
7
ᎏ
5
ᎏ
0
ᎏ
)
Fixed cost $
ᎏ
ᎏ
1
ᎏ
ᎏ
0
ᎏ
ᎏ
,
ᎏ
ᎏ
6
ᎏ
ᎏ
5
ᎏ
ᎏ
0
ᎏ
ᎏ
$12,000
ᎏ
1,600
⌬ Costs
ᎏ
⌬ Units
4259_Jagels_07.qxd 4/14/03 10:54 AM Page 308
HIGH—LOW METHOD 309
Step 1: Deduct the low figure from the high figure of each revenue and cost
catagories:
Units Average Total Sales Wage
Sold Rate Revenue Costs
August (high) 2,100 ϫ $40.00 ϭ $84,000 $26,400
January (low) 500 ϫ 40.00 ϭ (
ᎏ
2
ᎏ
0
ᎏ
,
ᎏ
0
ᎏ
0
ᎏ
0
ᎏ
)(
ᎏ
1
ᎏ
4
ᎏ
,
ᎏ
4
ᎏ
0
ᎏ
0
ᎏ
)
Change ⌬ $
ᎏ
ᎏ
6
ᎏ
ᎏ
4
ᎏ
ᎏ
,
ᎏ
ᎏ
0
ᎏ
ᎏ
0
ᎏ
ᎏ
0
ᎏ
ᎏ
⌬ $
ᎏ
ᎏ
1
ᎏ
ᎏ
2
ᎏ
ᎏ
,
ᎏ
ᎏ
0
ᎏ
ᎏ
0
ᎏ
ᎏ
0
ᎏ
ᎏ
Step 2: Use the change in sales revenue and wage costs from Step 1 to find
the variable cost per dollar of sales revenue:
ϭϭ$
ᎏ
ᎏ
0
ᎏ
ᎏ
.
ᎏ
ᎏ
1
ᎏ
ᎏ
8
ᎏ
ᎏ
7
ᎏ
ᎏ
5
ᎏ
ᎏ
per dollar of sales revenue
Step 3: Use the VC per dollar of sales answer from Step 2 to calculate the
fixed cost element:
Total wage costs for August (high) $26,400
Variable cost [$84,000 sales revenue ϫ $0.1875] ϭ (
ᎏ
1
ᎏ
5
ᎏ
,
ᎏ
7
ᎏ
5
ᎏ
0
ᎏ
)
Fixed cost $
ᎏ
ᎏ
1
ᎏ
ᎏ
0
ᎏ
ᎏ
,
ᎏ
ᎏ
6
ᎏ
ᎏ
5
ᎏ
ᎏ
0
ᎏ
ᎏ
As was the case with using low units, we can use the low wage costs, low
sales revenue, and variable cost per dollar of sales revenue and the same fixed
costs can be found:
Total wage costs for January (low) $14,400
Variable cost [$20,000 sales revenue ϫ $0.1875] ϭ (
ᎏᎏ
3
ᎏ
,
ᎏ
7
ᎏ
5
ᎏ
0
ᎏ
)
Fixed cost $
ᎏ
ᎏ
1
ᎏ
ᎏ
0
ᎏ
ᎏ
,
ᎏ
ᎏ
6
ᎏ
ᎏ
5
ᎏ
ᎏ
0
ᎏ
ᎏ
*
[
Alternative: VC is also (500 units sold ϫ $7.50) ϭ $
ᎏ
ᎏ
3
ᎏ
ᎏ
,
ᎏ
ᎏ
7
ᎏ
ᎏ
5
ᎏ
ᎏ
0
ᎏ
ᎏ
]
The calculated fixed cost is $10,650 a month, or 12 ϫ $10,650 ϭ $
ᎏ
ᎏ
1
ᎏ
ᎏ
2
ᎏ
ᎏ
7
ᎏ
ᎏ
,
ᎏ
ᎏ
8
ᎏ
ᎏ
0
ᎏ
ᎏ
0
ᎏ
ᎏ
a year.
$12,000
ᎏ
$64,000
⌬ Costs
ᎏ
⌬ Sales
4259_Jagels_07.qxd 4/14/03 10:54 AM Page 309
With reference to Exhibit 7.6, we can now separate our total annual wage
cost into its fixed and variable elements.
Total annual wages $241,600
Fixed costs (
ᎏ
1
ᎏ
2
ᎏ
7
ᎏ
,
ᎏ
8
ᎏ
0
ᎏ
0
ᎏ
)
Variable costs $
ᎏ
ᎏ
1
ᎏ
ᎏ
1
ᎏ
ᎏ
3
ᎏ
ᎏ
,
ᎏ
ᎏ
8
ᎏ
ᎏ
0
ᎏ
ᎏ
0
ᎏ
ᎏ
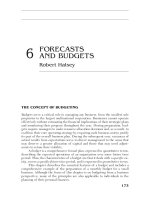
The calculation of the monthly fixed cost figure has been illustrated by arith-
metical means. The high–low figures could equally as well have been plotted
on a graph, as illustrated in Exhibit 7.8, and the fixed cost read from where the
dotted line intersects the vertical axis. If the graph is accurately drawn, the same
monthly figure of approximately $10,600 is obtained.
The high–low method is quick and simple. It uses only two sets of figures.
Unfortunately, either one or both of these sets of figures may not be typical of
the relationship between sales and costs for the year (for example, a one-time
bonus may have been paid during one of the months selected). Other, perhaps
less dramatic, distortions may be built into the figures.
These distortions can be eliminated, as long as one is aware of them, by ad-
justing the raw figures. Alternatively, standard costs rather than actual costs could
be used for the low and high sales months.
An alternate method to the high–low method that will show any monthly
distortions in individual figures is to plot the cost and sales figures for each of
the 12 operating months (or any number of months in an operating period) on
310 CHAPTER 7 COST MANAGEMENT
EXHIBIT 7.8
Maximum–Minimum Figure
0
$5,000
$10,000
$15,000
$20,000
Units (rooms sold)
Wages
500 1,000 1,500 2,000
4259_Jagels_07.qxd 4/14/03 10:54 AM Page 310
a graph. As well, the graph will show if the information is linear. If it is not lin-
ear, then you cannot use these methods to separate a semivariable cost into its
fixed and variable components.
MULTIPOINT GRAPH
Exhibit 7.9 illustrates a multipoint graph for our sales in units and our
wage cost for each of the 12 months. Sales and costs were taken from Ex-
hibit 7.7. The graph illustrated is for two variables, sales and wages. In this case,
wages are given the name dependent variable and are plotted on the vertical
axis. Wages are dependent on sales because they vary with sales. Sales, there-
fore, are the independent variable. The independent variable is plotted on the
horizontal axis. After plotting each of the 12 points, we have what is known as
a scatter graph: a series of points scattered around a line that has been drawn
through them. A straight line must be drawn.
There is no limit to how many straight lines could be drawn through the
points. The line we want is the one that, to our eye, seems to fit best. Each in-
dividual doing this exercise would probably view the line in a slightly different
position, but most people with a reasonably good eye would come up with a
line that, for all practical purposes, is close enough. The line should be drawn
MULTIPOINT GRAPH 311
EXHIBIT 7.9
Scatter Graph
0
$5,000
$10,000
$15,000
$20,000
Units (rooms sold) (Independent variable)
Y
X
Wages (Dependent variable)
500 1,000 1,500 2,000
4259_Jagels_07.qxd 4/14/03 10:54 AM Page 311
so that it is continued to the left until it intersects the vertical axis (the depen-
dent variable). The intersect point reading is our fixed cost (wages, in this case).
Note that, in Exhibit 7.9, our fixed cost reading is approximately $9,000. This
is the monthly cost. Converted to annual cost, it is $9,000 ϫ 12 ϭ $108,000.
Our total annual wage cost would then be broken down this way:
Fixed wages cost $108,000
Variable wages cost $
ᎏ
1
ᎏ
3
ᎏ
3
ᎏ
,
ᎏ
6
ᎏ
0
ᎏ
0
ᎏ
Total Wages Cost $
ᎏ
ᎏ
2
ᎏ
ᎏ
4
ᎏ
ᎏ
1
ᎏ
ᎏ
,
ᎏ
ᎏ
6
ᎏ
ᎏ
0
ᎏ
ᎏ
0
ᎏ
ᎏ
Note that, in drawing graphs for the purpose discussed, the point at which
the vertical and horizontal axes intersect should be given a reading of 0. The
figures along each axis should then be plotted to scale from the (0, 0) intercept
point.
The straight line on a scatter graph can be drawn by eye, and for most pur-
poses will give us a fixed cost reading that is good enough. However, the ques-
tion arises as to whether there is one best method that provides the most accurate
answers related to the graph or the high-low methods. The answer is yes, and
the most accurate method is known as regression analysis.
REGRESSION ANALYSIS
With regression analysis there is no need to draw a graph, plot points, and
draw a line through them. The objective in drawing the line is to find out where
the line intersects the vertical axis so we can read, at that intersection point, what
the fixed costs are. Once we know the fixed costs, we can then easily calculate
the variable costs (total costs Ϫ fixed costs ϭ variable costs). In regression
analysis, a number of equations have been developed for different purposes. One
of the equations allows us to calculate the fixed costs directly, without a graph.
Before the equation is used, we have to take the units (rooms) sold and the
wage cost information from Exhibit 7.7 and develop it a little further, as has
been done in Exhibit 7.10. In Exhibit 7.10 the units (rooms) sold column has
been given the symbol X (X is for the independent variable). The wage cost col-
umn (the dependent variable) has been given the symbol Y. Two new columns
have been added: XY (which is X multiplied by Y ) and X
2
(which is X multi-
plied by X). The equation is:
Fixed costs ؍
(
Α
Y)(
Α
X
2
) ؊ (
Α
X)(
Α
XY)
ᎏᎏᎏ
n(
Α
X
2
) ؊ (
Α
X)
2
312 CHAPTER 7 COST MANAGEMENT
4259_Jagels_07.qxd 4/14/03 10:54 AM Page 312
Two new symbols have been introduced in this equation: Α means the sum
of, or the column total figure, and n is the number of periods, in our case
12 (months).
Replacing the symbols in the above equation by the column totals from
Exhibit 7.10, we have:
Fixed costs ؍
؍
؍
؍ $
ᎏ
ᎏ
8
ᎏ
ᎏ
,
ᎏ
ᎏ
7
ᎏ
ᎏ
5
ᎏ
ᎏ
6
ᎏ
ᎏ
.
ᎏ
ᎏ
0
ᎏ
ᎏ
4
ᎏ
ᎏ
a month
Our answer could be rounded to $8,800 a month, which gives us a total an-
nual fixed cost of
$8,800 ؋ 12 ؍ $
ᎏ
ᎏ
1
ᎏ
ᎏ
0
ᎏ
ᎏ
5
ᎏ
ᎏ
,
ᎏ
ᎏ
6
ᎏ
ᎏ
0
ᎏ
ᎏ
0
ᎏ
ᎏ
$277,654,000,000
ᎏᎏ
31,710,000
$5,351,440,000,000 ؊ $5,073,786,000,000
ᎏᎏᎏᎏᎏ
265,800,000 ؊ 234,090,000
$241,600(22,150,000) ؊ (15,300)(331,620,000)
ᎏᎏᎏᎏᎏ
12(22,150,000) ؊ (15,300)(15,300)
REGRESSION ANALYSIS 313
Units (Rooms) Sold Wage Costs XY X
2
Month X Y (X ؋ Y) (X ؋ X)
January 500 $14,400 $ 7,200,000 250,000
February 1,000 15,800 15,800,000 1,000,000
March 1,300 19,800 25,740,000 1,690,000
April 1,200 21,600 25,920,000 1,440,000
May 1,400 24,400 34,160,000 1,960,000
June 1,500 24,200 36,300,000 2,250,000
July 2,100 26,200 55,020,000 4,410,000
August 2,100 26,400 55,440,000 4,410,000
September 1,500 23,600 35,400,000 2,250,000
October 1,000 15,200 15,200,000 1,000,000
November 1,000 14,800 14,800,000 1,000,000
December
ᎏᎏ
ᎏ
7
ᎏ
0
ᎏ
0
ᎏᎏ
1
ᎏ
5
ᎏ
,
ᎏ
2
ᎏ
0
ᎏ
0
ᎏᎏᎏ
1
ᎏ
0
ᎏ
,
ᎏ
6
ᎏ
4
ᎏ
0
ᎏ
,
ᎏ
0
ᎏ
0
ᎏ
0
ᎏᎏᎏ
ᎏ
4
ᎏ
9
ᎏ
0
ᎏ
,
ᎏ
0
ᎏ
0
ᎏ
0
ᎏ
Totals 1
ᎏ
ᎏ
5
ᎏ
ᎏ
,
ᎏ
ᎏ
3
ᎏ
ᎏ
0
ᎏ
ᎏ
0
ᎏ
ᎏ
2
ᎏ
ᎏ
4
ᎏ
ᎏ
1
ᎏ
ᎏ
,
ᎏ
ᎏ
6
ᎏ
ᎏ
0
ᎏ
ᎏ
0
ᎏ
ᎏ
$
ᎏ
ᎏ
3
ᎏ
ᎏ
3
ᎏ
ᎏ
1
ᎏ
ᎏ
,
ᎏ
ᎏ
6
ᎏ
ᎏ
2
ᎏ
ᎏ
0
ᎏ
ᎏ
,
ᎏ
ᎏ
0
ᎏ
ᎏ
0
ᎏ
ᎏ
0
ᎏ
ᎏ
2
ᎏ
ᎏ
2
ᎏ
ᎏ
,
ᎏ
ᎏ
1
ᎏ
ᎏ
5
ᎏ
ᎏ
0
ᎏ
ᎏ
,
ᎏ
ᎏ
0
ᎏ
ᎏ
0
ᎏ
ᎏ
0
ᎏ
ᎏ
EXHIBIT 7.10
Illustration of Calculation of Regression Analysis Data
4259_Jagels_07.qxd 4/14/03 10:54 AM Page 313
COMPARISON OF RESULTS
Let us compare the results of our fixed/variable breakdown of the Model Mo-
tel’s annual wage cost using each of the three methods described. The results
are tabulated as follows:
Fixed Variable Total
High–low method $127,800 $113,800 $241,600
Multipoint graph method 108,000 133,600 241,600
Regression analysis method 105,600 136,000 241,600
In practice, only one of the three methods would be used. We know that re-
gression analysis is the most accurate; however, because it requires time to per-
form the necessary arithmetic, it should probably only be used by those who are
mathematically adept, or as a spot-check on the results of either of the other two
methods. Alternatively, the figures can be fed into a programmed calculator or
using spreadsheet software that will carry out all the necessary calculations.
Multipoint graph results are fairly close to the regression analysis figures,
which seems to imply that, if the graph is well drawn, we should have results
accurate enough for all practical purposes. The high–low method results are
about 17.3 percent different from what regression analysis tells us the most cor-
rect result should be. Therefore, the high–low method should be used with cau-
tion and only if the two periods selected are typical of all periods, which might
be difficult to determine.
Once a method has been selected, it should be applied consistently to all
semivariable expenses. With reference to our Model Motel’s cost figures in Ex-
hibit 7.6, so far we have analyzed the semivariable wage cost. We need to ana-
lyze similarly the three other semivariable costs: maintenance, utilities, and office/
telephone. Let us assume we have done so using regression analysis; our com-
pleted cost analysis gives us the fixed and variable costs shown in Exhibit 7.11.
ALTERNATIVE METHOD
As an alternative to separating semivariable costs by individual expense, the sit-
uation can be simplified by first adding together all semivariable costs, then ap-
plying one of the three methods outlined in this section to separate only the total
into its fixed and variable elements. This considerably reduces the time and ef-
fort involved. On the other hand, it might reduce the accuracy of the results. In
many cases, however, this reduced accuracy might still be satisfactory for mak-
ing decisions.
In Chapter 8, we shall see how we can use this cost breakdown informa-
tion for decision making concerning many aspects of our motel operation. Even
though a motel situation has been used, the same type of analysis can be
314 CHAPTER 7 COST MANAGEMENT
4259_Jagels_07.qxd 4/14/03 10:54 AM Page 314
carried out equally well for a restaurant or a department in a hotel. In a hotel,
the difficulty may be in allocating the overhead costs in an equitable manner to
the individual departments.
COMPUTER APPLICATIONS
A computerized spreadsheet program can be used to apply most of the con-
cepts discussed in this chapter. The formula for each concept has to be entered
into the program only once, and it will automatically calculate the results for
each situation. A spreadsheet can also be used to carry out the calculations nec-
essary to separate costs into their fixed and variable elements, using all three
methods outlined in this chapter.
SUMMARY 315
Fixed Variable
Employee wages $105,600 $136,000
Management salary 40,000
Laundry, linen, and guest supplies 77,400
Advertising 15,000
Maintenance 30,800 3,800
Utilities 28,400 7,800
Office/telephone 7,000 1,000
Insurance 9,200
Interest 16,600
Property taxes 40,200
Depreciation
ᎏᎏ
7
ᎏ
0
ᎏ
,
ᎏ
0
ᎏ
0
ᎏ
0
ᎏ
ᎏᎏᎏᎏᎏᎏᎏ
Totals $
ᎏ
ᎏ
3
ᎏ
ᎏ
6
ᎏ
ᎏ
2
ᎏ
ᎏ
,
ᎏ
ᎏ
8
ᎏ
ᎏ
0
ᎏ
ᎏ
0
ᎏ
ᎏ
$
ᎏ
ᎏ
2
ᎏ
ᎏ
2
ᎏ
ᎏ
6
ᎏ
ᎏ
,
ᎏ
ᎏ
0
ᎏ
ᎏ
0
ᎏ
ᎏ
0
ᎏ
ᎏ
EXHIBIT 7.11
Final Cost Allocation by Fixed or Variable Costs
SUMMARY
One way of increasing net income in a business is to increase sales revenue.
Another way is to control costs. To do this, one must understand that there are
different types of costs.
A direct cost is one that is the responsibility of, and is controllable by, a
department head or department manager. An indirect cost, sometimes called an
overhead cost, is not normally charged to an individual department. If such costs
4259_Jagels_07.qxd 4/14/03 10:54 AM Page 315
316 CHAPTER 7 COST MANAGEMENT
are broken down by department and allocated to the departmental income state-
ment, the resulting departmental profit or loss figure must be interpreted with
great care.
All costs are controllable costs, whether they are direct or indirect ones; it
is only the level of responsibility for control of a cost that changes whether a
cost is controllable or noncontrollable.
A joint cost is one that is shared by two or more departments, or by the or-
ganization as a whole. A joint cost could be a direct one (such as wages) or an
indirect one (such as building maintenance). A discretionary cost is one that can
be incurred if a particular person, generally the manager, decides to spend the
money. A relevant cost is one that needs to be considered when making a specific
decision. If a cost makes no difference to the decision, then it is not relevant.
A sunk cost is a cost that is in the past and not relevant to certain decisions.
The initial expenditure on a piece of equipment bought five years ago that will
be traded in is a sunk cost insofar as the decision to buy a new machine today
is concerned.
An opportunity cost is the income forgone by not doing something. A mo-
tel could run its own restaurant at a profit, or lease it out. If it runs it itself, the
loss of rent income is an opportunity cost. However, the motel owner would
happily endure this opportunity cost if net income from running the operation
were greater than any potential rent income.
A standard cost is what a cost should be for a given level of revenue or vol-
ume of business. The final three types of cost discussed in this chapter were
fixed costs, variable costs, and semifixed or semivariable costs. Fixed costs are
costs that do not change in the short run, regardless of the volume of sales (the
general manager’s annual salary is an example). Variable costs are those that do
vary in the short run and do so in direct proportion to sales (food and liquor
costs are two good examples of variable costs). Most costs, however, do not fall
neatly into either the fixed or the variable category; they are semifixed or semi-
variable costs. To make useful decisions concerning fixed and variable costs and
their effect on net income at various levels of sales, the semicosts must be di-
vided into their fixed and variable elements. Three methods were used to illus-
trate how this can be done.
The high–low method, which, although quick and easy to use, may give
misleading results if the high and low sales periods selected are not truly
representative of the costs in all periods.
The multipoint graph eliminates the possible problem built into the
high–low method. The graph is subject to some element of personal judg-
ment, but in most cases will give results that are close enough for most
decision-making purposes.
Regression analysis, which is the most accurate method, involves quite
a number of calculations and can probably best be used as a spot check
on the results of using one of the other two methods.
4259_Jagels_07.qxd 4/14/03 10:54 AM Page 316
EXERCISES 317
DISCUSSION QUESTIONS
1. Differentiate between a direct cost and an indirect cost.
2. Define discretionary cost and give two examples (other than those given in
the text) of such a cost.
3. Differentiate between a fixed cost and a variable cost and give an example
of each that is not in the text.
4. Why are some costs known as semifixed or semivariable?
5. Why might it not be wise to allocate an indirect cost to various departments
on the basis of each department’s sales revenue to total sales revenue?
6. What do you think might be the relevant costs to consider in deciding which
one of a number of different vacuum cleaner models to buy for housekeeping
purposes?
7. Explain why you think it sometimes makes sense to sell below cost.
8. Define the term high operating leverage and explain why, in times of in-
creasing sales revenue, it is more profitable to have high rather than low
operating leverage.
9. With figures of your own choosing, illustrate how the high–low calculation
method can be used to separate the fixed and variable elements of a cost.
10. Explain why the high–low method may not be a good method to use to sep-
arate the fixed and variable portions of a cost.
11. Give a brief explanation of how to prepare a graph when using the multi-
point graph method for separating the fixed and variable elements of a cost.
ETHICS SITUATION
A hotel owner decides that to control his costs he cannot offer employees a
raise next year. However, they are not told that the hotel’s manager has been of-
fered a 10 percent increase in salary if he can convince the employees that the
no-pay-raise policy is justified. He has agreed to do this and accept his raise.
Discuss the ethics of this situation.
EXERCISES
E7.1 If revenue from a sale was $4,800 and variable costs were $2,304, what
is the variable cost percentage?
E7.2 If sales revenue was $24,440 and variable costs were 42 percent, what is
the contribution margin?
4259_Jagels_07.qxd 4/14/03 10:54 AM Page 317
318 CHAPTER 7 COST MANAGEMENT
PROBLEMS
P7.1 You are planning to purchase a range and have to make a choice among
the following three models:
Model 1 Model 2 Model 3
Cash cost $ 5,000 $ 5,500 $ 5,300
Estimate life 5 years 5 years 5 years
Trade-in value at end of life $ 1,000 $ 1,200 $ 800
Cash from sale of old machine $ 200 $ 200 $ 200
Installation of new machine $ 75 $ 100 $ 100
Initial training cost in year 1 $ 350 $ 300 $ 250
Annual maintenance contract $ 300 $ 275 $ 200
Annual cost of supplies $ 200 $ 200 $ 200
Annual wage costs of employees $32,000 $32,000 $32,000
Strictly on the basis of lowest cost over the five-year period, which model
would be the best investment? (Note: In your calculations, ignore any
costs that are not relevant.)
P7.2 The fixed cost of the banquet department of a hotel is $400 a day. A cus-
tomer selected a menu for 100 persons that would have a food cost of
$6.00 per person, a variable wage cost of $1.75 per person, and other
variable costs of $0.25 per person.
a. Calculate the total cost per person if this banquet were booked.
b. What should be the total selling price (revenue) and the price per per-
son if a 20 percent operating income on sales revenue is wanted?
c. The customer does not want to pay more than $11.25 per person
for this function. She is a good customer; she has booked many
E7.3 You were asked to cater a buffet for 40 people at $15 per person, your
variable costs average 75 percent, and fixed costs are $50 per day. Deter-
mine your contribution margin and operating income or loss and whether
you will accept or reject the proposal.
E7.4 You have decided to allocate $14,000 of indirect costs to your café and
bar operations based on square footage used. The café occupies 1,920
square feet and the bar occupies 480 square feet. How much of the $14,000
will be allocated to the café?
E7.5 Using the high–low method, find total fixed cost and the variable cost per
guest if you had 14,000 and 10,000 guests, and labor costs were $15,500
and $12,000, respectively.
4259_Jagels_07.qxd 4/14/03 10:54 AM Page 318
functions in the banquet room in the past and is expected to do so in
the future. The function is three days from now, and there is no like-
lihood you will be able to book the room for any other function. Ex-
plain why you would, or would not, accept the $11.25 per-person
price.
(Note: Assume that the hotel has only one banquet room.)
P7.3 You have the following monthly information about a large restaurant
complex comprising three departments:
Dining Coffee
Room Shop Lounge Total
Sales revenue $184,800 $135,600 $152,900 $473,300
Direct costs (
ᎏ
1
ᎏ
5
ᎏ
4
ᎏ
,
ᎏ
6
ᎏ
0
ᎏ
0
ᎏ
)(
ᎏ
1
ᎏ
2
ᎏ
9
ᎏ
,
ᎏ
0
ᎏ
0
ᎏ
0
ᎏ
)(
ᎏ
1
ᎏ
2
ᎏ
7
ᎏ
,
ᎏ
6
ᎏ
0
ᎏ
0
ᎏ
)(
ᎏ
4
ᎏ
1
ᎏ
1
ᎏ
,
ᎏ
2
ᎏ
0
ᎏ
0
ᎏ
)
Department income $
ᎏ
ᎏ
ᎏ
ᎏ
3
ᎏ
ᎏ
0
ᎏ
ᎏ
,
ᎏ
ᎏ
2
ᎏ
ᎏ
0
ᎏ
ᎏ
0
ᎏ
ᎏ
$
ᎏ
ᎏ
ᎏ
ᎏ
ᎏ
ᎏ
6
ᎏ
ᎏ
,
ᎏ
ᎏ
6
ᎏ
ᎏ
0
ᎏ
ᎏ
0
ᎏ
ᎏ
$
ᎏ
ᎏ
ᎏ
ᎏ
2
ᎏ
ᎏ
5
ᎏ
ᎏ
,
ᎏ
ᎏ
3
ᎏ
ᎏ
0
ᎏ
ᎏ
0
ᎏ
ᎏ
$ 62,100
Indirect costs (
ᎏᎏ
5
ᎏ
2
ᎏ
,
ᎏ
0
ᎏ
0
ᎏ
0
ᎏ
)
Operating income $
ᎏ
ᎏ
ᎏ
ᎏ
1
ᎏ
ᎏ
0
ᎏ
ᎏ
,
ᎏ
ᎏ
1
ᎏ
ᎏ
0
ᎏ
ᎏ
0
ᎏ
ᎏ
The owner wants to allocate indirect costs to each department based on
square footage to get a better picture of how each department is doing.
Dining room 1,200 sq. ft.
Coffee shop 840 sq. ft.
Lounge 960 sq. ft.
a. Allocate the indirect costs as indicated.
b. The owner has an offer from the souvenir store operator who is will-
ing to rent the coffee shop space for $8,000 a year. Advise the owner
whether to accept the offer.
c. Before making a final decision, the owner of the restaurant decides
to evaluate the changes to indirect costs if the coffee shop space is
rented.
Present Costs if Coffee
Indirect Costs Costs Shop Rented
Administrative and general $14,100 $13,400
Advertising and promotion 9,800 9,200
Utilities 4,500 4,300
Repairs and maintenance 4,200 3,900
Insurance 3,600 3,300
Interest 5,400 5,400
Depreciation 10,400 7,100
PROBLEMS 319
4259_Jagels_07.qxd 4/14/03 10:54 AM Page 319
If the coffee shop is not operated, it is estimated that lounge revenue will
decline by $13,600 a year and lounge direct costs will go down by
$10,200. Dining room revenue and direct costs will not be affected.
Should the owner accept the offer to rent out the coffee shop?
P7.4 You have the following income statements for each of the four quarters
of a restaurant operation:
1
st
Qtr. 2
nd
Qtr. 3
rd
Qtr. 4
th
Qtr.
Sales revenue $34,200 $44,800 $37,200 $20,300
Cost of sales (
ᎏ
1
ᎏ
2
ᎏ
,
ᎏ
8
ᎏ
0
ᎏ
0
ᎏ
)(
ᎏ
1
ᎏ
6
ᎏ
,
ᎏ
9
ᎏ
0
ᎏ
0
ᎏ
)(
ᎏ
1
ᎏ
4
ᎏ
,
ᎏ
7
ᎏ
0
ᎏ
0
ᎏ
)(
ᎏᎏ
8
ᎏ
,
ᎏ
4
ᎏ
0
ᎏ
0
ᎏ
)
Gross Margin $
ᎏ
ᎏ
2
ᎏ
ᎏ
1
ᎏ
ᎏ
,
ᎏ
ᎏ
4
ᎏ
ᎏ
0
ᎏ
ᎏ
0
ᎏ
ᎏ
$
ᎏ
ᎏ
2
ᎏ
ᎏ
7
ᎏ
ᎏ
,
ᎏ
ᎏ
9
ᎏ
ᎏ
0
ᎏ
ᎏ
0
ᎏ
ᎏ
$
ᎏ
ᎏ
2
ᎏ
ᎏ
2
ᎏ
ᎏ
,
ᎏ
ᎏ
5
ᎏ
ᎏ
0
ᎏ
ᎏ
0
ᎏ
ᎏ
$
ᎏ
ᎏ
1
ᎏ
ᎏ
1
ᎏ
ᎏ
,
ᎏ
ᎏ
9
ᎏ
ᎏ
0
ᎏ
ᎏ
0
ᎏ
ᎏ
Operating Expenses
Wages $ 9,800 $11,600 $10,200 $ 7,400
Supplies 1,600 1,900 1,700 900
Advertising 600 800 700 400
Utilities 2,500 2,900 2,600 1,900
Maintenance 300 400 300 200
Insurance 500 500 500 500
Interest 600 600 600 600
Depreciation 400 400 400 400
Rent
ᎏᎏ
3
ᎏ
,
ᎏ
0
ᎏ
0
ᎏ
0
ᎏᎏᎏ
3
ᎏ
,
ᎏ
0
ᎏ
0
ᎏ
0
ᎏᎏᎏ
3
ᎏ
,
ᎏ
0
ᎏ
0
ᎏ
0
ᎏᎏᎏ
3
ᎏ
,
ᎏ
0
ᎏ
0
ᎏ
0
ᎏ
Total expenses $
ᎏ
1
ᎏ
9
ᎏ
,
ᎏ
3
ᎏ
0
ᎏ
0
ᎏ
$
ᎏ
2
ᎏ
2
ᎏ
,
ᎏ
1
ᎏ
0
ᎏ
0
ᎏ
$
ᎏ
2
ᎏ
0
ᎏ
,
ᎏ
0
ᎏ
0
ᎏ
0
ᎏ
$
ᎏ
1
ᎏ
5
ᎏ
,
ᎏ
3
ᎏ
0
ᎏ
0
ᎏ
Operating income (loss) $
ᎏ
ᎏ
ᎏ
ᎏ
2
ᎏ
ᎏ
,
ᎏ
ᎏ
1
ᎏ
ᎏ
0
ᎏ
ᎏ
0
ᎏ
ᎏ
$
ᎏ
ᎏ
ᎏ
ᎏ
5
ᎏ
ᎏ
,
ᎏ
ᎏ
8
ᎏ
ᎏ
0
ᎏ
ᎏ
0
ᎏ
ᎏ
$
ᎏ
ᎏ
ᎏ
ᎏ
2
ᎏ
ᎏ
,
ᎏ
ᎏ
5
ᎏ
ᎏ
0
ᎏ
ᎏ
0
ᎏ
ᎏ
($
ᎏ
ᎏ
ᎏ
ᎏ
3
ᎏ
ᎏ
,
ᎏ
ᎏ
4
ᎏ
ᎏ
0
ᎏ
ᎏ
0
ᎏ
ᎏ
)
The owner is contemplating closing the restaurant in the fourth quarter
in order to eliminate the loss and take a three-month vacation. The owner
has asked for your help, and after an analysis of the fourth-quarter ex-
penses, you determine the following:
Wages: $3,000 is a fixed cost of key personnel who would be kept on
the payroll even if the operation were closed for three months.
Supplies: Cost varies directly with sales revenue; none of the supplies
costs are fixed.
Advertising: Half of the cost is fixed, the rest is variable.
Utilities: Even if closed for three months, the restaurant will still re-
quire some heating; this is expected to cost $100 a month.
Maintenance: Some light maintenance work could be done during the
closed period; estimated cost $100.
Insurance: Insurance cost will be reduced $200 if closed for three
months.
Interest: Will still have to be paid, even if closed.
320 CHAPTER 7 COST MANAGEMENT
4259_Jagels_07.qxd 4/14/03 10:54 AM Page 320
Depreciation: With less customer traffic and reduced wear and tear
on equipment, there would be a 75 percent reduction in depreciation
expense for the fourth quarter.
Rent: This is an annual expense of $12,000 that must be paid regard-
less of whether the restaurant is open or closed.
Explain what advice you would give the owner.
P7.5 A company owns three motels in a ski resort area. Although there is some
business during the summer months, the company finds it very difficult
to staff the three operations during this period and is contemplating clos-
ing one of the three motels. The sales revenue and breakdown of costs
during this period are as follows:
Motel A Motel B Motel C
Sales revenue $265,000 $325,000 $425,000
Variable costs 160,000 150,000 135,000
Fixed costs 110,000 167,000 260,000
a. Assuming one of the motels must be closed and that its closing will
have no effect on the sales revenue of the other two, explain which
motel should be closed and why.
b. Would your answer be the same if sales revenue remained as shown
above and the variable and fixed costs changed as shown below?
Motel A Motel B Motel C
Variable costs $100,000 $167,000 $250,000
Fixed costs 110,000 113,000 112,000
P7.6 An entrepreneur is contemplating purchasing one of two similar com-
petitive motels and has asked for your advice. Present revenue of each
motel is $450,000 per year. Jack’s motel has annual variable costs of 50
percent of sales revenue and fixed costs of $200,000; Jock’s motel has
annual variable costs of 60 percent of sales revenue and fixed costs of
$155,000. The entrepreneur thinks that, if he purchased Jack’s motel, he
could save $10,000 a year on interest expense (a fixed cost). Alterna-
tively, if he purchased Jock’s motel, he could improve staff scheduling
to the point that the wage saving would reduce total variable cost to 55
percent. In the case of either purchase, he thinks that sales revenue can
be increased by 20 percent a year. Calculate the present net income of
each motel, then, given these assumptions, advise the entrepreneur which
one he should buy, including any cautionary comments.
PROBLEMS 321
4259_Jagels_07.qxd 4/14/03 10:54 AM Page 321
P7.7 Stella’s Steak House has been operating for the past 10 years, and Stella
has to negotiate her lease on the premises for the next 5 years. Her op-
tions are to pay a fixed monthly rent of $2,500 or to pay a variable
monthly rent of 6 percent of her sales. Over the next five years she an-
ticipates her sales to average $550,000 per year.
a. What is Stella’s indifference point on an annual sales revenue basis?
b. Which option should she choose? Explain.
P7.8 A hotel wishes to analyze its electricity cost in its rooms department in
terms of fixed and variable elements. Monthly income statements show
that during its busiest and slowest months, cost and rooms occupied in-
formation is as follows:
Rooms Cost Rooms Sold
Busiest $2,600 2,400
Slowest 2,000 1,200
Use the high–low method to calculate the following:
a. Variable cost per room occupied
b. Total variable cost for the busiest and the slowest month
c. Total fixed cost per month
P7.9 You have the following information from the records of a restaurant:
Sales Revenue Wage Costs
January $11,100 $5,500
February 13,100 5,900
March 14,900 6,100
April 19,100 7,100
May 22,000 9,000
June 24,200 9,600
July 26,300 9,700
August 27,000 9,900
September 23,900 8,500
October 20,100 7,600
November 18,200 8,000
December 16,000 7,100
Use the high–low method to calculate total fixed cost and total variable
cost for the year.
P7.10 Complete a regression analysis to determine total annual fixed and
variable costs using the sales revenue and wage costs shown in Prob-
lem 7.9. Compare regression analysis results with the results obtained
322 CHAPTER 7 COST MANAGEMENT
4259_Jagels_07.qxd 4/14/03 10:54 AM Page 322
in Problem 7.9, and comment about the results between the two dif-
ferent methods used to find total annual fixed and variable costs.
P7.11 A restaurant has the following 12-month record of revenue and wages:
Sales Revenue Wage Costs
January $24,900 $11,300
February 24,200 11,100
March 25,600 11,200
April 24,200 11,400
May 34,000 13,200
June 46,200 18,600
July 53,300 21,600
August 44,000 16,100
September 34,200 15,100
October 30,400 12,800
November 28,200 11,200
December 27,000 13,000
Adjustments to the base information shown: Included in the July wages
is a lump sum retroactive wage increase of $2,400, which would not nor-
mally be part of the July wage cost. Also, in December, the restaurant
catered a special Christmas function that brought in $3,200 in sales rev-
enue, and cost the restaurant an additional $900 in wages. The Decem-
ber wage figure also included $1,200 in Christmas bonuses to the staff.
Use the high–low method to calculate the restaurant’s monthly fixed wage
costs.
CASE 7 323
CASE 7
Charlie is thinking of spending $3,000 more in year 2004 on advertising (part
of marketing expense). Because of his marketing courses, he believes he can de-
sign appealing advertisements to be placed in local newspapers and aimed at
the business luncheon trade. He estimates that if the ads are placed, they will
bring in 15 more people at lunch each day.
The average check for the additional lunch guests would be the same as that
calculated in Case 6. Use a 52-week year and the days open from Case 6. As-
sume that the food and beverage total cost of sales percentage will be the same
as in year 2004. (This percentage was calculated in Case 3.)
To serve the extra guests, a new employee will have to be hired at lunch for
four hours. Hourly rate of pay including fringe benefits (a free meal while on
duty, vacation pay, and so on) will be $5.42 an hour. The following variable
4259_Jagels_07.qxd 4/14/03 10:54 AM Page 323
expenses will remain at the same percentage to sales revenue as they were in
year 2004 (see Case 3):
Laundry
China and tableware
Glassware
Other operating expenses
All other expenses are assumed to be fixed and are unaffected by the in-
creased volume of business. Prepare calculations to show whether the $3,000
should be spent. Refer to the income statement for the 4C Company’s restau-
rant for year 2004.
324 CHAPTER 7 COST MANAGEMENT
4259_Jagels_07.qxd 4/14/03 10:54 AM Page 324
THE COST–VOLUME–PROFIT
APPROACH TO DECISIONS
INTRODUCTION
CHAPTER 8
This chapter introduces the cost–
volume–profit (CVP) method, which
can assist management in evaluating
current and future events regarding
sales revenue inflow and cost out-
flows. A number of basic questions
will be identified and discussed using
examples to explain CVP analysis.
A graphical explanation and
presentation of CVP is then given,
showing how the breakeven level of
sales revenue can be determined and
how the level of operating income
(profit) for a particular volume of
sales can be arrived at.
Before discussing and illustrating
the CVP equation (which eliminates
the need for a graph), several specific
key assumptions and limitations in-
herent in the CVP approach will be
addressed. The equation is used to
determine the breakeven level of
sales revenue, the sales revenue
needed to cover a new fixed cost, the
additional sales revenue required to
cover a changed variable cost, or
multiple changes in costs. The CVP
answers can be obtained in sales rev-
enue dollars or sales end units, such
as rooms sold or guests served.
The CVP equation can also be
used to determine the effect that a
change in selling prices will have
on operating results to determine ad-
ditional sales volume required to
cover a loss, or to analyze a new
investment.
This chapter illustrates how the
CVP equation can be used to handle
various situations concerning joint
costs in multiple-department organi-
zations and concludes with a discus-
sion on incorporating income tax in
the CVP calculation.
4259_Jagels_08.qxd 4/14/03 11:02 AM Page 325
326 CHAPTER 8 THE COST–VOLUME–PROFIT APPROACH TO DECISIONS
CHAPTER OBJECTIVES
After studying this chapter, the reader should be able to
1 Briefly discuss the assumptions and limitations inherent in CVP analysis.
2 Identify and discuss the various functions shown in a graph of sales levels,
and fixed and variable costs.
3 State the CVP equation used to determine the sales level in dollars and
the equation used to determine the sales level in units.
4 Demonstrate by example how the CVP equations are used to determine
breakeven sales in dollars and in units.
5 Demonstrate by example how the CVP equations are used to determine
sales volume in dollars and sales quantity in units.
6 Explain the term contribution margin and the format of a contribution
margin income statement.
7 Discuss how operating income before tax and net income (after tax) can
be used in the CVP equation.
8 Discuss the use of CVP analysis to solve problems concerning joint fixed
costs in a multiple-department organization.
THE CVP
APPROACH TO DECISIONS
Managers of hotels, motels, restaurants, and beverage operations, as well as
other hospitality operations providing general goods and services, ask questions
such as these:
What will my operating income be at a specified level of sales revenue?
What is the amount of additional sales revenue needed to cover the cost
of expansion and still provide the wanted level of operating income?
What effect will a change of selling prices have on my operating income?
What effect will a change in the variable cost of sales have on my oper-
ating income?
What increase in sales revenue is necessary to cover the cost of a wage
increase and still provide the wanted levels of operating income?
These are but a few of many questions, which cannot be answered simply
from a traditional income statement. They are, however, easily answered using
4259_Jagels_08.qxd 4/14/03 11:02 AM Page 326