Liabilities liquidity and cash management balancing financial risks phần 9 ppt
Bạn đang xem bản rút gọn của tài liệu. Xem và tải ngay bản đầy đủ của tài liệu tại đây (271.7 KB, 34 trang )
252
CREDIT RISK,MARKET RISK,LEVERAGE, AND THE REGULATORS
product by product. The sponsor prices new products. Risk assessment and profitability are other
processes with an impact on limits.
The departments responsible for credit risk and market risk (see Chapter 15) act as oversight to
ensure that limits are respected. Salespeople have different limits for derivatives trades and for secu-
rities, and there is in place a system to warn the compliance department when limits are broken,
since among marketing people there is always a tendency toward assuming greater risk.
Concomitant to the study of limits should be the classification into expected, unexpected, and
catastrophic credit risks. Annual credit risk provisions should equal the sum of expected credit loss-
es computed in an analytical way from historical information, differentiating among expected,
unexpected losses, and extreme events. Expected losses, or predictable risk, is essentially a cost of
doing credit-related transactions.
Actual losses that occur in any one day, week, month, or year may be higher or lower than the
expected amount, depending on economic environment, interest rates, exchange rates, and other
market factors influencing the investments inventoried in the portfolio. Unexpected losses can be
estimated through worst-case scenarios over a one-year time horizon, focusing on historical events
of low default probability but higher dollar amounts as well as historical recovery rates. Outliers
and spikes are used as proxies of likely but improbable extreme events.
TAKING ACCOUNT OF MANAGEMENT QUALITY IN ESTABLISHING CREDIT
LIMITS
Financial instruments that potentially subject a company to concentrations of credit risk consist
principally of investments, debt instruments, loans, and trade receivables. While every management
tries to place its investments with high-credit quality counterparties, a sound policy will put limits
on the amount of credit exposure to any one party, at any time, for any transaction, based on the
analysis of its credit standing and financial staying power.
The credit standing changes over time, and, historically, there are more downgrades than
upgrades. Management negligence is the key reason. In the mid-1990s Sumitomo Corporation lost
$2.6 billion. (Some sources say the red ink was $5.1 billion.) In 1996 stockholders sued, charging
Sumitomo with gross negligence under the commercial code, asking for 200 billion yen ($1.7 bil-
lion) in damages. Five years later, in 2001, the case is still pending, a victim of Japan’s slow-mov-
ing legal system and cover-ups protecting big business.
This is a pity because prolonged legal suits hurt the company’s credit standing. Legal system
dynamics may be, however, changing. In September 2000, the Osaka District Court heard the case
of Daiwa Bank shareholders, ordering 11 current and former company directors, including bank
president Takashi Kaiho, to pay a record $775 million for negligence after a bond trader in the
bank’s New York branch piled up $1.1 billion in losses.
Mitsubishi Motors is another case of the growing anger of shareholders. Mitsubishi Motors
shareholders filed suit against former company officials implicated in a scandal that has dented
vehicle sales and the firm’s stock price. They are asking for $84.6 million to compensate for
write-offs that followed management’s admission that it had covered up reports of defects in its
autos for 30 years.
All these references on lack of transparency are important because, when it comes to credit risk,
investors and lenders often are acting in good faith, unaware of what goes on in mismanagement.
253
Credit Risk, Daewoo, and Technology Companies
When the bad news breaks out, it is already too late. Banks have the lawyers to file lawsuits, but
until recently individual Japanese investors would not take such initiative. With shareholder
activism on the rise, there is a new factor weighing on counterparty risk.
These examples emphasize that transparency is the best policy. When it comes to taking risks,
limits have to be set, keeping the business environment within which a company operates in per-
spective. Depending on the company’s business, there may be a concentration of credit risk not only
by industry or geographic region but also as a function of the quality of management of a counter-
party. (See in Chapter 4 the top positions in the definition of operational risk.)
It is useful to avoid concentration of credit risk in a company’s business partners; recall the
disastrous aftermath of this concentration on Nortel, Lucent, Ericsson, Cisco, and Qualcomm.
At Intel, too, the company’s five largest customers account for about 39 percent of net revenues and
approximately 34 percent of net accounts receivable. With such concentration of counterparty
risk, Intel:
• Performs ongoing credit evaluations of its customers’ financial condition, and
• Deems necessary sufficient collateral to act as a buffer if worse comes to worst.
As this example and many others document, it is wise to adopt credit policies and standards that
can accommodate business expansion while keeping close watch on a number of key factors inher-
ent to credit risk. Typically, credit risk is moderated by the diversity of end customers; also typi-
cally, the crucial credit risk variables evolve over time, a factor that managers do not always take
into account.
As an example from banking, the former Manufacturers Hanover Trust of New York said in a
late 1970s meeting that, day in and day out, it had a credit line exposure of between $2.0 and $2.5
billion with General Motors. At that time, GM was not particularly well managed. While no one
was expecting it to go bankrupt, Lee Iacocca revealed that while he was Chrysler’s CEO, his com-
pany had contemplated making a leveraged buyout for GM—which, if done, would have substan-
tially reduced the credit rating of the rolling loan.
Few senior bankers appreciate that measuring and managing credit risk are two highly connect-
ed operational risk issues that greatly impact on the safety of the bank’s capital and its ability to sur-
vive adverse conditions. Fundamentally, lending officers respond to two major influences:
1. Loan policy, including acceptable grade collateral and limits
2. The leadership shown by senior bank management in analytical approaches to relationship
banking
This leadership concerns both the bank as a whole and specifics connected to credit and loan
policies as well as business partner handling. In short, it concerns the way to manage the bank’s
assets at risk. Like the analysis of market risks, credit risk management is conditioned by what has
been said about concentration of exposure. Banks fail because:
• They put all their eggs in a few baskets.
• They fail to reevaluate critically how counterparties are managed.
• They lack a rigorous internal control function.
• Their lending is too much influenced by sales drive and market share.
254
CREDIT RISK,MARKET RISK,LEVERAGE, AND THE REGULATORS
Marketing people and relationship managers push the lending officer to give the loans, even
when there is an inordinate counterparty risk. By contrast, loan portfolio managers who like to
ensure high-quality assets concentrate on returns commensurate to risks being taken. Typically, con-
flicting drives blur senior management’s judgment. The idea that high-quality assets and high yield
can work in synergy paralyzes credit risk decisions and sees to it that credit institutions fail to take
appropriate steps. At the same time, relationship managers are not trained to find out what the
clients do with the money lent by the bank, which might help in reducing credit risk.
USING SIX SIGMA TO STUDY DETERIORATING CREDIT RISK
Internal control should flesh out contradictions between policy and practice in credit risk manage-
ment. Banks eager to improve their internal controls for lending are busy establishing a valid sys-
tem for internal performance rating. They begin by identifying strategic influences, such as: admis-
sible client rating targets as percentages of total business; the ability to dynamically update percent
of delinquency by carefully studied category of client; and credit risk as percent of original busi-
ness target, which integrates credit risk, market risk, and other risks. (See Chapter 15.)
Real-time information is important because pricing should be based on a spread over cost of
funds plus reinsurance. Other strategic decision factors are collections; recovery as percent of
changed items; and profitability derived by the bank for its loans—by class and as a total.
Classic statistical studies of the sort taught in business schools are not enough. Many statistical
analyses are opaque, therefore useless. A dynamic stratification permits analysts to make a distri-
bution of working assets, with risks attached to each class and with emphasis on concentrations and
associated exposure. Experimental design is highly advisable, and it is practiced by tier-1 organi-
zations. An example is the use of Six Sigma by GE Capital.
5
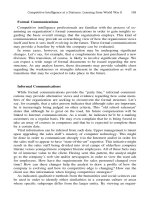
The torrent of normal distributions in Exhibit 13.5 explains in a nutshell the concept behind Six
Sigma. A small standard deviation means high quality; a large standard deviation means poor qual-
ity. The nature of the distribution tells a lot about the underlying quality level. This concept can be
applied very nicely with loans, investments, and trades.
For instance, a valuable pattern that should be carefully analyzed is loan structure as a measure
of policy performance. A target figure is the distribution of risk weighting the bank’s loan portfo-
lio. What is more, performance evaluation and risk measurement can be automated to a substantial
degree through the able use of technology.
Agents (knowledge artifacts) should be mining daily and intraday the database,
6
interactively
reporting by exception when preestablished limits are reached and breached; tracking incidents of
breaking them, even temporarily; and establishing the quality of management hidden beneath the
statistics. Banks that fail to analyze their information and to experiment bias their financial results
toward an out-of-control condition.
Similar concepts can be used for the analysis of leveraged conditions. In the second half of the
1990s and in 2000, the gearing was not only at the consumer level—even if private sector debt
jumped from 168 percent of GDP in 1994 to about 200 percent in 1999. A bigger culprit was the
financial sector, whose debt skyrocketed from 54 percent of gross domestic product (GDP) to 80
percent during the same period. Much of this credit may well have served as fuel for the bull mar-
ket for equities. On the other hand, excess credit does not really stay in the stock market. For every
buyer of shares, there is a seller who ends up with cash.
255
Credit Risk, Daewoo, and Technology Companies
Excess credit and liquidity correlate (see Part Two). Some analysts suggest that global competi-
tion, deregulation, and technological strides would have led to outright deflation in the Group of
Ten countries were it not for such rapid credit growth. This growth has created excess liquidity—a
situation where credit grows, as measured by the relationship between commercial bank credit
and GDP.
Excess credit and credit rating also correlate with one another, but negatively. It is therefore not
surprising that, compared to 1998, 1999 saw a very significant increase in downgrades of syndicat-
ed loan ratings, while the number of upgrades was mild. This pattern continued in 2000. Credit
institutions responded to declining credit quality by increasing the gap between the price of lend-
ing to good borrowers and to not-so-good ones. Some of the poorer borrowers have not been get-
ting loans at all, as screening standards rose.
• Still, bad loans increased by about 7 percent in the second quarter of 2000.
• Banks’ reserves were at their lowest level in more than a dozen years.
Six Sigma methodology can nicely be used in the context of these points about the control of
credit quality. Volatility of the reserves-to-loans ratio is an example. Adjusted for the riskiness of
the banks’ loans, the reserves-to-loans ratio is at its lowest since 1950. The pains experienced by the
economy because of these downgrades are significant also for another reason. They are indicators
of risks inside a bank’s loan portfolio.
In principle, the syndicated loan market in the United States offers a quick method of evaluating
industry exposure because industrial companies often use banks to arrange financing quickly,
before issuing stock or bonds. As a result, properly analyzed, the market for syndicated loans
reveals trends in credit. Such analysis suggests that during 1999, there was a steady slide in the
quality of these loans. According to Moody’s, 2000 showed no sign of a reversal. This is bad news
Exhibit 13.5 Three Standard Deviations Usually Fit Between Quality Control Target and
Customer Specifications, But This Is Not Enough
Source: With the permission of General Electric.
256
CREDIT RISK,MARKET RISK,LEVERAGE, AND THE REGULATORS
for Chase Manhattan and Bank of America, banks that together arrange more than half of all syn-
dicated loans.
A rigorous statistical analysis also should include smaller banks that had bought syndicated
loans previously. Such banks are becoming increasingly reluctant to continue buying these loans,
because of concerns about poor and declining credit quality. Another source of money has been the
loan participation, or prime rate funds. Tied to the quality of the underlying loans, their net assets
slipped in 2000.
Industry sector evaluation also can be achieved through advanced statistical methods. In this
case, the quality of loans to the technology, media, and telecommunications (TMT) companies have
been particularly poor. The bank with the biggest involvement in TMT is ABN AMRO, which has
been most active in the syndicated loan market. The Dutch bank’s share of syndicated loans to the
TMT sector was estimated at $13 billion in September 2000, ranking it fourth globally.
• On paper, that share is small compared with ABN-AMRO’s total assets base of euro 458 billion
($415 billion).
• If the bank had kept all those debts on its own books, the loans would have been equivalent to
74 percent of its tier-1 capital.
Still another domain of financial leverage where Six Sigma methodology can be used effective-
ly is junk bonds. In March 2001 the international junk bond market was in a state of serious decline.
In Europe all the top high-yield front runners in 1999 and 2000 were U.S. institutions, but some
European banks were not that far behind. UBS Warburg and ING Barings have been building up
their businesses in these highly risky instruments.
On October 10, 2000, Morgan Stanley issued a statement saying that junk bond losses cut its
earnings in the third quarter by about 3.5 percent, and markdowns in the fourth quarter would be of
similar magnitude. Junk bond blues and TMT correlate. The uncertainty in the high-yield market is
strongly related to uncertainty about the credit quality of some telecommunications and technolo-
gy issues. (See also Chapter 1 and the second section in this chapter.) European and American banks
find themselves doubly exposed through both their lending business and their investment opera-
tions. Therefore, they are well advised to use rigorous analytics to pinpoint their weakest spots.
IMPACT OF THE INTERNET ON CREDIT CONTROL
The Internet is enabling credit insurers to reach new markets and also provide new products,
such as unbundling existing services by separately pricing and selling information on risk and risk
coverage. Other services, such as invoicing and debt collection, are also brought on a global scale,
thereby providing additional sources of earnings.
A significant contribution of networks at large and of the Internet in particular is facilitating less
expensive distribution and data collection channels for many services including claims adjustment.
Direct business-to-business (B2B) Internet transactions offer an opportunity for credit insurers.
7
By
providing lines of credit to buyers on the Internet, they:
• Enhance their fee-based revenues through new channels
• Leverage their proprietary information on creditworthiness of buyers
• Enter the market for derivatives and asset-backed securities
257
Credit Risk, Daewoo, and Technology Companies
These business lines present opportunities and challenges for credit insurers. One of the chal-
lenges is the development and use of model-based real-time systems permitting specific credit
enhancements—for example, real-time evaluation of fair value of asset-backed commercial paper,
trade receivables, and liabilities incurred by insured parties.
Because of its capillarity, the Internet helps credit insurance companies deliver more timely and
better personalized information to clients as well as in reducing paperwork costs related to data pro-
cessing, because a good deal of the work is done on-line. Insurers expect the Internet will help to
improve efficiency in underwriting, distribution, administration, and claims settlement.
These activities just described lead toward lower costs for credit insurers and guarantors, who
believe that Internet business could bring about 10 percent cost savings. Such estimates, however,
tend to ignore the fact that significant expenditures on information technology have to be made to
get the expected results, and these expenditures will consume part of the savings.
Investors and credit institutions can profit from on-line information. They can use experimental
design to analyze risk factors and correlations involving counterparty risk. As Exhibit 13.6 shows,
a whole spectrum of risk correlation may exist between debt issuer and guarantor, and this can be
exploited through analytical studies.
Different credit insurance companies offer different strategies in exploiting the Internet’s poten-
tial. The strategy of Euler, a credit insurance company, is helping clients to manage the insurance
policies through its Online Information Service. Clients can:
Exhibit 13.6 Counterparty Risk Involving Debt Issuer “A” and Credit Issuer “B”
SPEC TRU M OF EX PO SUR E
A
A
A
A
A
B
B
B
B
B
N EGAT IVE CORRELATIO N ,-1
ZERO C O R R E LATIO N , 0
POS ITIVE C O RR E LATIO N ,+.2
POS ITIVE C O RR E LATIO N ,+.5
POS ITIVE CORRELATION, +1
QUALITY
OF
GUARANTY
HIGH
NILL
258
CREDIT RISK,MARKET RISK,LEVERAGE, AND THE REGULATORS
• Check outstanding limit on their customers.
• Track claims which were filed.
• Get responses to requests for extensions in credit limits.
Another credit insurer, Coface, uses the Internet to enhance relationship management. It also
handles credit limit requests and policy amendments on-line, thereby improving service and reduc-
ing cost. Gerling Kredit provides insurance for the entire selling chain, from B2B transactions to
business-to-consumer (B2C) deals. Gerling controls Trusted Trade, whose goal is insuring B2B,
while Trusted Shops protects online consumers from a company’s failure to deliver goods as well
as from damaged goods delivery.
Still another credit insurer, NCM, provides online services through eCredible.com. Its offerings
include credit management services and the eCredible Payment Guarantee. The former offers a
credit certificate issued to the seller’s customers helping to authenticate the buyer’s creditworthi-
ness. Buyers are assigned a spending limit, based on data provided by independent rating institu-
tions, credit agencies, or NCM’s own database. As these examples help demonstrate, credit
risk–related products are on the upswing and networks are instrumental in promoting them.
NOTES
1. D. N. Chorafas, Credit Derivatives and the Management of Risk (New York: New York Institute
of Finance, 2000).
2. For Babylonian cultural history, see B. Meissner,
Babylonian and Assyrian (Heidelberg, 1921);
and B. L. Van der Waerden,
Science Awakening (Groningen: P. Noordhoff, 1954).
3. D. N. Chorafas,
Managing Credit Risk, Vol. 1: Analyzing, Rating and Pricing the Probability of
Default (London: Euromoney Books, 2000).
4.
Business Week, February 19, 2001.
5. D. N. Chorafas,
Managing Operational Risk: Risk Reduction Strategies for Banks Post-Basle
(London: Lafferty, 2000).
6. D. N. Chorafas,
Agent Technology Handbook (New York: McGraw-Hill, 1998).
7. D. N. Chorafas,
Internet Supply Chain. Its Impact on Accounting and Logistics (London:
Macmillan, 2001).
259
CHAPTER 14
Marking to Market and Marking to
Model the Loans Book
One of the notions advanced by the Accounting Standards Board (ASB) in the United Kingdom that
goes beyond the 1996 Market Risk Amendment by the Basle Committee on Banking Supervision
is that of marking to market the banking book. The major challenge in this connection is valuing
gains and losses in the loans portfolio and mapping them into a reliable financial statement.
How can the loans book be marked to market? A linear answer seems to be: “Like any other
asset.” But while some loans, such as mortgages, can be relatively easy to mark-to-market, others
pose a number of problems and many institutions lack the experience to overcome them. In my
view, the greatest current weakness in accounting for market risk associated with loans is the
absence of the needed culture (and supporting technology) to steadily measure all assets and liabil-
ities as close as possible to fair value.
• This measurement should be done in a way similar to the one we use with budgets: plan versus
actual (see Chapter 9).
• With assets and liabilities, the plan may be the historical cost; the actual, the current
market price.
How can a loans portfolio be marked to market for those items that do not have an active market?
The answer is by approximation through modeling—provided that the model is valid, its hypotheses
are sound, and this procedure is consistently used. Yield curves can help. (See Chapter 11.)
One of the ways to mark to model corporates is through bond equivalence using Macauley’s algo-
rithm for duration. This algorithm was developed in the 1930s for application with mortgages but
became very popular with rocket scientists in the mid1980s because of securitization of debt. The
concept of duration might be extended to corporate loans, sovereign debt, and other cases.
Discounted cash flows (see Chapter 9) also assists in the evaluation of the intrinsic worth of an asset.
More sophisticated approaches combine market risk and credit risk, as will be seen in Chapter
15. Many experts consider the integration of market risk and credit risk to be at the top of the finan-
cial modeling food chain. Integrative solutions are particularly important because, between 1997
and 2000, a structural change took place within the financial industry that alters the ways of con-
fronting risk. Every year this structural change becomes more visible and fast-paced, affecting prac-
tically every professional and every firm.
260
CREDIT RISK,MARKET RISK,LEVERAGE, AND THE REGULATORS
One of the major contributors to risk redimensioning is the merger activity that has reduced the
number of players in the financial landscape while competitive conditions have been recast: New
windows of opportunity open up for the giants but smaller, more agile companies focus their
resources and take advantage of business conditions by using cutting-edge technology.
CAN THE LOANS PORTFOLIO BE MARKED TO MARKET?
In the past, the answer to the question in the heading would have been a categorical “No!” But
we live in different times. Today, to a very significant extent, the assets and liabilities a bank pos-
sesses can be securitized and sold to the market. In addition, new regulations recognize the market
risk embedded into the banking book and ask for its definition.
The Group of Ten regulators have revamped their capital adequacy standards through the
issuance in 1999 of “A New Capital Adequacy Framework” as a consultative paper. The Basle
Committee on Banking Supervision aims to make the rules of reporting credit risk in the twenty-
first century more sophisticated than they ever were.
Some of the significant differences between the 1988 Capital Accord and the New Capital
Adequacy Framework is that the former set a fixed rate for capital and addressed only credit risk,
not operational risk. Market risk has been regulated through the 1996 Market Risk Amendment, but
only in regard to trading book exposure. By contrast, the new framework addresses interest-rate risk
in the banking book. The framework also pays a great deal of attention to market discipline. The
principles established by the Committee of Sponsoring Organizations (COSO) of the Treadway
Commission dominate,
1
particularly in connection to:
• Encouraging high standards of disclosure by financial institutions, and
• Enhancing the role of market participants in inciting banks to hold adequate capital.
This has had a definite effect on loans policies. The strategy banks have classically followed with
their loans now needs to be updated to answer the new requirements posed by regulators and by the
market. The change is an evolutionary one because many credit institutions have been using for
years in connection with their loans:
• The rating of the borrower through independent agencies
2
• A view of credit risk based on the exact type, amount, collateral, and covenants of the loan
The concept embedded in the second item is strengthened by the New Capital Adequacy
Framework, which promotes both the employment of credit ratings by independent agencies and an
internal ratings-based (IRB) approach. The Basle Committee suggests that sophisticated financial
institutions might use IRB for setting capital charges—which is a form of precommitment. (See also
Chapter 15.)
The IRB approach mainly addresses credit risk, but the new regulatory policy also aims to
account for market risk in the banking book. One problem with loans encountered by most banks
is that, depending on market conditions and prevailing psychology, their structure tends to magni-
fy underlying market movements. Regulators seem to be well aware of this. For instance, in the
261
Marking to Market and Marking to Model the Loans Book
United Kingdom, the ASB specifies four measures that are broadly in line with current U.S. norms
and practices:
1. A standard disclosure matching the one already introduced in the United States, to ensure reli-
able financial reporting by all public entities
2. The use of an operating and financial review (OFR) to reveal a bank’s or other company’s pol-
icy on risk and the way it uses financial instruments
3. A series of quantitative disclosures, such as the interest-rate and currency profiles of its posi-
tions, to be displayed in the notes
4. A rigorous presentation of market risk reflecting the effect of movements in key rates on all
positions and instruments a company holds
The implementation of points 2 to 4 calls for sensitivity analysis able to describe the effect of
market changes on gains and losses. For instance, what will be the effect on the exposure taken by
the institution of a small fraction of rise or fall in interest rates? (For a practical example on the con-
trol of interest-rate exposures, see Chapter 12.)
Few banks have the needed ability in quantitative analysis to recognize that market sensitivities
are nonlinear. This is easily seen in Exhibit 14.1, which presents the pattern of interest rates as a
function of duration in situations other than backwardation. Linearized sensitivity is an approxima-
tion that holds for minor changes in interest rate but tends to distort fair value calculations as inter-
est-rate volatility. Exhibit 14.1 presents a yield curve analysis of the effects of credit risk and spread.
As Chapter 12 has explained, the Office of Thrifts Supervision in the United States has devel-
oped an excellent interest-rate reporting system for savings and loans. This has been an important
cultural development for small, unsophisticated banks. Once the culture is there, and the tools, this
experimental analysis can be applied effectively to all positions affected by interest-rate volatility:
Exhibit 14.1 Yield Curve Analysis on the Effects of Credit Risk and Spread Risk
TEAMFLY
Team-Fly
®
262
CREDIT RISK,MARKET RISK,LEVERAGE, AND THE REGULATORS
• The loans portfolio,
• Investments being made, and
• Derivatives instruments.
Top-tier American banks are indeed applying what-if scenarios through simulation. They started
doing so on their own initiative in the mid-to-late 1980s. In this way, they have obtained a very valu-
able decision support system that has been extended geographically, by product line, by client rela-
tionship, and in other implementation domains.
Regulators are increasingly watching out for changes in volatility and liquidity, and they
target a proactive strategy in terms of supervision. The best-managed commercial banks and invest-
ment banks do the same. But a surprisingly large number of credit institutions are not aware
how much their survival depends on the careful study of interest rates and currency rates—and on
their prognostication. In many institutions, senior management does not pay enough attention to
experimentation. Therefore, regulators are right in asking for disclosure of market value of the loans
portfolio.
Modeling will be more intricate under the dual risk perspective of interest-rate risk and
currency risk. Some of the bigger players, such as Citibank and Barclays, now claim to deal in
more than 100 currencies, and certain banks say that they have tripled the number of their
exotic-currency trades in the past five years. All this calls for paying more attention to analysis,
not less.
Few investors appreciate that one of the interesting (and intricate) aspects of the loans portfolio
is that, except for small local banks, it is seldom in one currency. A British bank may extend loans
in dollars, euro, yen, or any one of 100 currencies in any country in which it operates. This risk usu-
ally is mitigated by the bank raising matching deposits, and in some cases loan capital, in the same
currency as the loan—but in general this classic model of hedging is less than perfect. To tune it up,
the institution has to take into account at the same time:
• Counterparty risk,
• Interest-rate risk,
• Country risk,
• Currency risk,
• Liquidity risk, and
• Operational risk.
Typically, disclosure on currency risk calls for the choice of a base currency. A common denom-
inator will be difficult for money center banks unless a common base of reference is chosen, such
as the U.S. dollar or a basket of currencies. In the latter case, results always will have to be
expressed in a base currency, if for no other reason than financial reporting requirements.
Selecting appropriate criteria to be applied to permit nearly homogeneous interpretation of
movements in interest rates, currency rates, and other criteria can be fairly complex because solu-
tions must address at the same time volatility, liquidity, and current market price, along the frame
of reference which was presented in Exhibit 13.2 in the last chapter.
263
Marking to Market and Marking to Model the Loans Book
USING THE YIELD CURVE AS A GATEWAY TO SOPHISTICATED SOLUTIONS
Yield curves were explained in Chapter 11 and virtual financial statements in Chapter 6. The pres-
ent discussion brings the two issues together to underline, by way of practical example, the need for
a first-class method for reporting the risk embedded in the banking book, not only the trading book.
An integrated approach to fair value estimates that targets both the banking book and the trad-
ing book brings into perspective the requirement that the bank’s chief financial officer (CFO), chief
information officer (CIO), chief auditor, and members of the board think in terms of a bifurcation
in accounting practices. As I already mentioned:
• Virtual financial statements available in real-time serving management accounting and control
purposes should be accurate but not necessarily precise.
• In contrast, regulatory financial reporting—including a growing array of financial disclosures—
should be precise and abide by the laws of the land.
For instance, to weed out of the banking book interest-rate risk, an internal interest-rate swap can
be a rewarding exercise particularly for intraday and daily management reports. For internal
accounting reasons, this swap will bring interest-rate risk into the institution’s trading book. An
internal interest-rate swaps method typically works through time buckets:
• If the loans in the banking book have a life up to, say, 15 years, then it is advisable to build up
to five buckets for 1, 2, 5, 10, and 15 years.
• Reporting should be handled through knowledge artifacts, based on a model with predefined
time periods into which are placed the loans to be priced and hedged.
A similar method can be used effectively with other instruments, such as a maturity premium
regarding country risk. Exhibit 14.2 presents an example with five buckets. Notice that the time
ranges of these buckets do not necessarily need to be equal. A buckets approach can help in hedg-
ing, essentially amounting to an internal netting function by time slots, approximating what the
1996 Market Risk Amendment calls the standard method for marking to market the trading book.
In implementing this methodology in connection with interest rates, a zero coupon yield curve
can be used. This method is known from a number of practical applications that fall under the cumu-
lative title sensitivity models. The key to a valid solution lies in the ability of converting loans posi-
tions into bond positions. As an example, say that the institution has a swap book of 2000 interest-
rate swaps:
1. The analyst develops the time buckets, along the lines discussed in text.
2. Then the analyst takes as a frame of reference bullet bond payments corresponding to the right
time bucket.
The analyst can use sensitivities to convert these positions to zero bonds and to calculate cash
flow. Based on maturities, he or she can reduce, for example, 2000 different payments to the posi-
tions of 10 buckets. With time slotting comes the challenge of evaluating exposure.
264
CREDIT RISK,MARKET RISK,LEVERAGE, AND THE REGULATORS
Bonds can be geared. There is a long list of derivatives using bonds as underliers. Therefore,
since the early 1990s, my favorite approach is to convert the notional principal amount associated
with derivatives into real money at risk through a demodulator.
3
Many banks disagree because they
think that the notional principal amount does not have a relation to risk exposure. This is a false
assumption as well as an internal contradiction because these same banks use stress analysis.
• An institution is well advised to use the demodulator of notional principal for internal manage-
ment accounting, as a way to subject positions to a stress test.
• This procedure provides the board and senior management with a compass on exposure at dif-
ferent values of the demodulator, chosen according to prevailing market conditions.
Financial analysis and its tool have to be very flexible and innovative. While different models are
needed to deal with different financial instruments, experience teaches that these models evolve
over time, as users’ know-how increases and demands for experimental solutions become more
sophisticated. Classification factors also play a role. In terms of exposure, for example, in handling
options one distinguishes between:
• Bought options, where the worst case is a simple write-off of the premium that was paid, and
• Written options, where sophisticated models are necessary for pricing, because there is no bot-
tom to possible losses
Regulators believe that the growing expertise of commercial banks and investments banks in
modeling serves several purposes: It makes reporting a little more objective, it presents banks with
Exhibit 14.2 Five Time Buckets with Time to Maturity Premium Regarding Country Risk
265
Marking to Market and Marking to Model the Loans Book
a fairly uniform approach to the measurement of risk, and it advances a methodology that enhances
control of credit risk, market risk, and other types of risk.
In the majority of cases, marking to market and marking to model are complementary process-
es. It may be possible to mark to market some of the loans in a portfolio, particularly the more con-
ventional ones. Others would have to be marked to model. Even with conventional-type loans, mod-
els may have to be used to reflect specific valuations because of covenants.
In all cases, the models built work through approximations. This is true not only because of the
assumptions made and the hypotheses used but also because data on which some of the extrapola-
tions have been based changes over time, while the algorithm(s) also may contain an error. Few
organizations appreciate the importance of data, yet data makes up 80 percent of the problems in
modeling. All these factors lead to model risk.
Exhibit 14.3 provides an example of data change in a little over one month; it presents two yield
curves of 10-year implied forward interest rates in Euroland. The implied forward yield curve,
which is derived from the term structure of interest rates observed in the market, reflects the mar-
ket expectation of future levels for short-term interest rates. The data used in the estimation has been
based on swaps contracts.
The new global perspective for interest-rate risk management enlarges the concepts of modeling
and of regulation and brings them to an international dimension. No doubt, as they are implement-
ed, the new financial reporting requirements will have a major impact on:
Exhibit 14.3 Implied Forward Overnight Euro Interest Rates
266
CREDIT RISK,MARKET RISK,LEVERAGE, AND THE REGULATORS
• Marketplaces
• Equity and bond prices
• Loans being contracted
• Derivatives trades being made
The requirements also will lead to new definitions of prudential reporting rules. Some of the
many basic questions regarding the variables to be taken into account include:
• the relative weight of each variable
• the method of integrating different risks
• how exposure should be reflected in the profit and loss statement
Simply stated, the question is: “What is earnings at risk?’ Multivariable exposure and recognized
but not realized gains and losses are examples of evolving definitions.
A rigorous comparative analysis poses different requirements from the better-known method of
calculating the average all-in spread from a sample of recently issued loans or bonds. While with
adjustments to provide plausible estimates of par market pricing for current deals banks may come
nearer to present value, this and similar approaches do not necessarily satisfy the basics behind fair
value estimates of loans positions.
The value at risk (VAR) model recommended by the Basle Committee and the G-10 central
banks
4
should be seen as nothing more than a stepping-stone to more complex solutions for meas-
uring exposure that will develop over the coming years. Still, because the able use of VAR requires
a cultural change, it is wise not to skip this stepping-stone but to try to improve it. After all, central
banks now welcome eigenmodels (the bank’s own models) in the computation of risk.
MISMATCH IN CAPITAL REQUIREMENTS BETWEEN COMMERCIAL BANKS
AND INVESTMENT BANKS
At the end of the 1980s, Dr. Gerald Corrigan, then chairman of the New York Fed and the Basle
Committee, and Sir David Walker, then chairman of the Securities and Investments Board in
Britain, put forth a proposal that led to the distinction between banking book and trading book. The
proposal became known as the “building block approach.” This happened after the 1988 Capital
Accord, as voices were raised for its revision.
The building block approach is relatively simple in design. It calls for dividing a credit institu-
tion’s business into two parts: trading and banking. The idea was that the Basle Committee’s capi-
tal standards of 1988 would apply to the banking book, while a new capital requirement should be
worked out for the trading book. An April 1993 discussion paper by the Basle Committee ensued,
which was redrafted and reissued in April 1995 incorporating the use of models. It became the
Market Risk Amendment in January 1996.
The contents of trading book and banking book are shown in a snapshot in Exhibit 14.4. Both have
assets and liabilities. Credit risk and market risk are present in both of them, although there tends to
be more market risk in the trading book and a greater amount of credit risk in the banking book.
267
Marking to Market and Marking to Model the Loans Book
Within the trading book separate charges are made for the market risk component and for the
underwriter (issuer-specific) element of the portfolio, subject to certain changes in capital needs.
The U.S. Securities and Exchange Commission (SEC) did not find this to be a satisfactory solution.
The SEC feared that many of the reductions in capital requirements implied in the rules by the
British Securities and Futures Authority (old SFA) that were to be adopted by the Basle Committee
for the trading book would dilute the SEC’s capital requirements for large investment banks.
The SEC’s decision not to agree to the proposed common standard on trading book capital
requirements for commercial banks and investment banks was taken at IOSCO’s annual conference
in London in 1992. Prior to this, regulatory thinking about a common ground for credit institutions
and broker-dealers had reached, so to speak, a high-water mark.
After the 1992 conference, another bifurcation was created with the publication by the European
Union of the Capital Adequacy Directive (CAD), which resulted in further divisions in regulations
between the Basle Committee and, this time, the European Union Executive. Some of the gap was
filled in the mid-1980s, after the Amsterdam accord that led to CAD II. Gaps also exist in the way
the 1996 Market Risk Amendment is implemented from one G-10 country to the next. Because not
all markets are the same, and because past policies die slowly, individual central banks of the G-10
have established their own requirements beyond those elaborated by the Basle Committee.
The Bank of England has a rule that no bank can lend to any individual nonbank 25 percent or
more of its capital. This and similar rules assist in controlling the exposure of commercial banks to
industrial companies and to nonbanks. Twenty-five percent of a bank’s capital is, however, a huge
amount. When Long Term Capital Management crashed in late September 1998, the United Bank
of Switzerland lost the $1.16 billion it had invested in a transaction with this hedge fund. This was
about 3 percent of its capital—and it still represented large losses that took the bank some time to
recover from.
Exhibit 14.4 A Bird’s-Eye View of Risks Embedded in Banking Book and Trading Book
268
CREDIT RISK,MARKET RISK,LEVERAGE, AND THE REGULATORS
Another interesting issue to regulators and to the bank’s own management is how institutions
with global operations address some other risks, such as country risk, associated with their loans.
Pure credit risk is not the only exposure with loans. Sticking to the fundamentals, one can say that
the loans book basically incorporates three risks:
1. The classic credit risk
2. Liquidity risk (with country risk associated to it)
3. Interest-rate risk, which can be absolute or structural
Structural interest-rate risk is essentially mismatch risk. (See Chapter 12.) Top-tier commercial
banks tackle the challenge of top management’s awareness of credit risk, liquidity risk, and interest-
rate risk through virtual financial statements that are available intraday and address assets and liabil-
ities both in the banking book and in the trading book. As with the virtual balance sheets, discussed
in Chapter 6, they are available intraday and serve a worthwhile purpose in terms of management deci-
sions because they permit users to answer ad hoc queries regarding present value as well as exposure.
Chapter 6 also mentioned Cisco’s use of virtual balance sheets. The State Street Bank has virtu-
al statements available on 30 minutes notice. Among industrial companies, Intel, Microsoft,
Motorola, and Sun Microsystems also produce virtual financial statements updated intraday. A vir-
tual statement is confidential, but its interactive approach is most valuable to senior executives.
Organizations that master high technology think highly of intraday:
• Balance sheets,
• Income statements, and
• Other financial documentation.
Moving from interday into intraday presents significant competitive advantages. In this connec-
tion, accuracy is more important than precision. Even if it involves, for example, a 3 percent error,
management loves to have a balance sheet available ad hoc in real time. This error rate is not accept-
able for regulatory reporting and for legal purposes, where precision is foremost.
In all likelihood virtual financial statements are a longer-term issue confronting FASB, ASB, and
every other accounting standards board. Regulatory requirements do not appear out of the blue sky.
Their purpose is not only to control but also to promote the well-being of the banking industry. It
is all a give and take.
These examples are only a few of the major changes taking place in accounting and in finance.
It is certain that the new regulations, marking to model, internal swaps, and virtual balance sheets
will radically change the way we value equity. They also will greatly impact on the way we look at
cash flow, earnings, and risks.
CREATIVE ACCOUNTING DAMAGES THE PROCESS OF SECURITIZATION
At any point in time, all loans have a value that, theoretically, can be defined with a certain accura-
cy. Alternatively, the value might be computed through algorithms. Both the theoretical and the
computational approaches are, for practical purposes, approximations. In the large majority of
cases, estimating the value of loans in the banking book is not an easy business because no two
loans are the same. Their market value differs in a number of ways principally:
269
Marking to Market and Marking to Model the Loans Book
• Amount,
• Counterparty risk,
• Covenants,
• Special conditions,
• Maturity, and
• Interest rates.
Volatility and liquidity are other key factors that are never the same in different markets or at dif-
ferent times in the same market. These are the crucial variables the market uses to look at the value
of loans. Volatility and liquidity help in framing prevailing psychology in investments—and there-
fore, in lending and in trading.
The correlation among volatility, liquidity, and market price is a domain where too little research
has been done. Yet the results of such studies are vital, particularly in connection with the securiti-
zation of loans by means of credit derivatives. Not all loans attract the same market interest in secu-
ritization terms:
• Some loans are liquid; others are not.
• Some loans have low credit risk; with others the risk of default is high.
• Some pools of loans have been studied analytically through option adjusted spread (OAS); with
others, the analytics are lousy.
Other things being equal, those financial instruments the market considers to be more transpar-
ent and well structured become more liquid and can be securitized more easily. Mortgages are a
good example. In the United States, some 80 percent of mortgages have been pooled and sold as
securities to institutional investors, particularly insurance companies and pension funds that are
interested in annuities.
Corporate loans are a different class. Until credit derivatives started rolling in 1996, only 3 per-
cent to 5 percent of corporate loans were securitized. One of the main reasons for investors’ apathy
to corporates has been that they are not uniformly structured or as transparent as the market would
like. Hence they have the potential of negative surprises.
The implementation of COSO by commercial banks might help credit derivatives because it
significantly increases transparency and reliability in financial reporting. Increased transparency
and reliability helps to make securitized corporates more appealing to investors. The underlying
concept is what General Electric calls the wing-to-wing approach, meaning that senior manage-
ment examines the entire process from both the customer’s perspective and its own. Transparency
and reliability in financial reporting can be instrumental in counterbalancing other shortcomings—
for instance, the fact that most corporates are inherently illiquid and they also carry a greater
event risk.
• A large number of business loans lack covenants, which specify cash flow, event risk guaran-
tees, and other crucial variables the borrower should observe.
• Hence, the credit institution (and the investor who buys them) has less control over them,
although it continues carrying these loans on its books.
270
CREDIT RISK,MARKET RISK,LEVERAGE, AND THE REGULATORS
These considerations are at the top of investors’ minds when they plan to diversify out of mar-
ket risk by assuming credit risk. Investors do appreciate that, in a pool of loans, some debtors may
be rated AA and hence have a relatively good credit standing while other companies have an A or
a BBB rating.
5
Some of the latter companies may even be known to use creative accounting prac-
tices. This puts market players on guard, because typically investors have an aversion to tricks that
may take place behind their backs.
Creative accounting gimmicks damage the process of securitization because investors know
these tricks are used most often to conceal what under a rigorous analysis would be imperfect busi-
ness.
6
Not all creative accounting is plain cheating. Some is cosmetic, with future benefits in mind.
An example is when a new CEO arrives in a company that contains both successful and troubled
divisions. The CEO then:
• Writes off the troubled divisions’ business
• Sells uninteresting assets for whatever can be gotten
Following this fire sale, the new CEO negotiates with the company’s compensation committee
for a generous bonus, based on rising earnings, a higher stock price, or both. Therefore, in studying
a company’s financial statements it is wise to separate true earnings from those that are one-time
events or generated by creative accounting practices that are hiding peculiar deals.
Another example of creative accounting is a case of stock price manipulation. In Wall Street,
maintaining a high stock price is key to corporate success. Aggressive accounting practices reduce
the impact of the buying binge on earnings. For instance, Softbank (a heavily indebted Japanese
company that specializes in investing in the United States) decided to write off $2.7 billion in good-
will from the Ziff-Davis and Comdex buyouts over 30 years rather than the more conventional 10
to 15 years.
“If they wrote off the goodwill over 10 years, they would barely be profitable,” figured Jonathan
Dobson, a fund manager with Jardine Fleming Investment Management’s OTC Fund. As a result,
in July 1996 he dumped his $30 million stake, about 5 percent of his total Japan holdings. A case
about creative accounting also can be made with regard to loans and to options.
The classic case with options concerns their pricing, which time and again has been based on a
volatility smile—the assumption that future volatility would be low. Options prices and volatilities
correlate. Because high-priced options do not sell well, many traders convinced management that
future volatility would be benign—but low-priced options brought major risks to the company.
Estimating future volatility is not an exact science. Some brokers’ opinions about what to expect
in future volatility might be biased, often because of conflict of interest; these brokers also might
be the parties who will sell the options. This happened in early 1997 with NatWest Markets, and the
bank lost a rumored £300 million ($420 million). Such losses led to the demise of NatWest Markets.
Its parent company, National Westminster Bank, dismantled it and sold its pieces to other invest-
ment banks. Eventually, NatWest also fell, to the Royal Bank of Scotland.
Volatility smiles concern future interest rates, and they affect pricing not only of options but also
of other instruments. This is one of the examples of erroneous hypotheses (which I also referred to
in connection with models). The algorithms addressing credit risk may be reasonably good, but if
the hypotheses that we create are unsound or the data that we feed into our model are unreliable,
then the results we get will not be dependable. Model risk is not limited to the algorithms and
heuristics of the model, although these also are basic elements. Assumptions, hypotheses, and data
271
Marking to Market and Marking to Model the Loans Book
play a crucial role in terms of the reliability of what the model delivers.
There are available today some good models for credit risk. Examples of algorithms for mark-
ing-to-model counterparty risk are provided by CreditMetrics, by J. P. Morgan; the Actuarial Credit
Risk Accounting (ACRA), by the Swiss Bank Corporation (now United Bank of Switzerland);
CreditRisk+, by Credit Swiss; and Loan Accounting System (LAS), by KPMG.
8
Developed in the
late 1980s by Bankers Trust, Risk Adjusted Return on Capital (RAROC) has been the first to apply
marking-to-model procedures to credit risk. It is, by all evidence, the most successful modeling
approach for credit risk. Exhibit 14.5 explains the sequential sampling on which RAROC is based.
I recently studied RiskCalc by Moody’s Investors Service, including choices that led to its design
and the hypotheses embedded into its structure. This model supports a rating methodology for pri-
vate companies based on power curves as predictors of default. It is primarily addressing middle-
market lending, which is still a largely subjective process in search of analytics.
The concept of power curves rests on Pareto’s law, statistical inference, and database mining.
Rich databases enhance the predictive potential of models. RiskCalc incorporates critical factors
that help in the survivability of a company or, alternatively, can tell how well (or how badly) a given
organization manages its business. Examples are:
• Level of leverage,
• Profitability,
• Liquidity,
• Inventories, and
• Sales growth.
Exhibit 14.5 Sequential Sampling Plan to Avoid Inflexible Yes/No Decisions Taking a Higher
Risk for Reinsurance
TEAMFLY
Team-Fly
®
272
CREDIT RISK,MARKET RISK,LEVERAGE, AND THE REGULATORS
The relation between estimated default frequency (EDF), in the ordinate, and the absolute value
of a given ratio, in the abscissa, regarding the default likelihood in connection to each of these fac-
tors is not linear. The power curve maps the fraction of all companies with the value or score relat-
ing to factors just listed to survivability. By so doing, it permits users to analyze the most likely pat-
tern of defaults.
Other quantitative approaches, and their models, fulfill different objectives, such as marking to
model a portfolio of derivatives; still others address exposure embedded into the loans book. In their
fundamentals, these are as different from one another as the instruments they help to manage.
Typically, a bank’s commitment with a loan is paid upfront. By contrast, one of the major problems
with accounting for derivative financial instruments is that they are easy to buy upfront, and, at least
initially, they may cost nothing.
Derivatives involve no historical cost, as do other classic instruments. In fact, the lack of histor-
ical cost connected to many derivative financial products contradicts some of the principles of
accounting, which are based on historical cost. Of course, not all derivatives value is zero. A num-
ber of options, for instance, have some value at inception, as do off-exchange contracts and most
derivatives at any time after inception.
As this brief discussion demonstrates, the design of models and their use must be focused. Few
banks appreciate this simple but basic fact. Some use a model designed to prognosticate the behav-
ior of a certain instrument or control its exposure for other totally unrelated financial products.
When this happens, the results are highly misleading or, under the best conditions, they are zero.
SECURITIZATION OF CORPORATE LOANS THROUGH CREDIT DERIVATIVES
The concept of credit derivatives is based on two pillars:
1. The bank’s desire to liquefy its corporate loans and other assets related to its lending business, and
2. The belief that the credit universe is evolving into a liquid, transparent market of the type char-
acterizing other global markets, such as foreign exchange.
3. Historically, however, this second hypothesis is not fool-proof.
While over the years mortgage-backed financing prospered, corporate loans have not been easi-
ly liquefied. Creative accounting is one of the reasons investors do not particularly like securitized
corporates. Creative accounting increases credit risk, which is anyway not so transparent. Many of
the loans in the securitization pool were given to companies with no public rating by independent
companies. Investors therefore must rely on the word of the bank that gave these loans and also may
be the underwriter. The market for credit derivatives is globalized. Some people think this market
is a brilliant approach to credit risk management. Others do not buy this notion because of
unknowns attached to the securitization of credit risk. There exist several types of credit derivatives
instruments. The more popular are:
• Asset swaps,
• Total return swaps,
• Default swaps, and
• Credit-linked notes.
273
Marking to Market and Marking to Model the Loans Book
The good news for institutions is that credit derivatives permit them to pass off to other parties
the risk of default on some of the loans in their portfolio. Investors, however, demand a higher pre-
mium for this combination of market risk and credit risk, and the securitization of corporates
requires fairly accurate pricing methods.
A different way of saying this is that the complexity of pricing financial instruments increases.
Other things being equal, it is relatively easy to establish the price of a futures contract in com-
modities. When the cost of soybeans rises, the price of the futures contract on the commodity
increases by a corresponding amount.
• In the case of commodities futures, the relationship between the price of the underlier and that
of the derivatives tends to be linear.
• This is not true with other instruments, such as credit derivatives, because compound risk leads
to nonlinear pricing algorithms.
It is no less true that commercial loans have become complex, linked to other credit and non-
credit products and services, while derivatives are becoming customized. Therefore, correct pricing
requirements multiply. The classic pattern characterizing commercial loans is being restructured
even in domains in which a historical trend has existed for as long as anyone can remember. Other
sectors of the economy have had a similar experience.
“We are starting to see evidence that the capital markets are working to moderate the real estate
cycle,” says Greg A. Smith of Prudential Securities.
9
“This is particularly true for office building
construction. The problems in the non-Treasury debt markets are siphoning some capital away from
real estate. The dependence of real estate activity on the capital markets, rather than on private
lenders (which is the historical pattern), has reduced the overall amount of money available to real
estate at the top of the cycle.”
Comparative analysis is one way to look into pricing products for the financial markets in an
environment of galloping change in instruments, including changes in the way they are priced and
being channeled to the capital market. Comparative analysis might provide a simpler pricing
process, without too many simplifications, by looking directly to the market for pricing informa-
tion. This works best for standardized products traded in liquid markets; that is, in an environment
of known risks. The secret is keeping a close watch on the market’s view of risk, both current and
forthcoming.
Investors are always concerned about the unknown. When transparency does not hold the upper
ground and there is no guarantor for securitized corporates, the market will not go for these products.
Investors also know that many banks do not keep the risks embedded in their loans under lock and key.
Credit derivatives are an interesting idea if for no other reasons than only rarely have there been
attempts to rid the balance sheet of unwanted risks. As mentioned earlier, one of the basic factors
for this is that corporate loans have not been transparent. The bank holding the loans keeps many
secrets close to its chest. The equity markets would never have reached their current levels of liq-
uidity and efficiency if it had not been for well-regulated financial disclosure.
The above statements talk volumes about the contribution of transparent financial reporting to
the securitization of corporates.
10
Short of the aforementioned preconditions, credit derivatives will
go up to a point but not further. Serious investors require a framework to account for loan market
dependability. Specifically, they are looking for documentation regarding the difference between
the values with which they are confronted:
274
CREDIT RISK,MARKET RISK,LEVERAGE, AND THE REGULATORS
• The value the open market would assign to a pool of loans, and
• The one the lender would assign internally to the same loans.
By comparing loan values derived from internally calibrated risk premiums with those obtained
from market risk premiums, it might be possible to quantify pricing disparities. With this, informed
judgments can be made about how to reconcile pricing dictated by the marketplace with the bank’s
internal pricing of credit risk, including its loan servicing costs.
Risk management models are needed to help identify, qualify, and quantify credit risk. Another fun-
damental requirement is a solid methodology, as all commercial banks have problems in managing
their loan portfolios—because, quite often, these portfolios tend to be very illiquid and undiversified.
When bankers work on the securitization of loans, they must appreciate that they are working
from a different perspective from fund managers who design and build their portfolios practically
from scratch. While the precondition is understanding the risk/reward profile of the loans portfolio
the bank owns, this is not enough all by itself. Some experts believe that while players in credit
derivatives may be a little ahead of themselves in terms of when this market is likely to flourish, the
market is definitely one that is worth watching.
NOTES
1. D. N. Chorafas, Reliable Financial Reporting and Internal Control: A Global Implementation
Guide (New York: John Wiley, 2000).
2. D. N. Chorafas,
Credit Risk Management, Vol. 1: Analyzing, Rating and Pricing the Probability
of Default (London: Euromoney Books, 2000).
3. D. N. Chorafas,
Managing Credit Risk, Vol. 2: The Lessons of VAR Failures and Imprudent
Exposure (London: Euromoney Books, 2000).
4. See D. N. Chorafas,
The 1996 Market Risk Amendment. Understanding the Marking-to-Model
and Value-at-Risk (Burr Ridge, IL: McGraw-Hill, 1998).
5. Chorafas,
Credit Risk Management.
6. Terry Smith,
Accounting for Growth (London: Century Business Books, 1992).
7.
Business Week, August 12, 1996.
8. D. N. Chorafas,
Credit Derivatives and the Management of Risk (New York: New York Institute
of Finance, 2000).
9. Global Equity Research,
Investor Weekly, Prudential Securities, New York, September 23, 1998.
10. Chorafas,
Reliable Financial Reporting and Internal Control.
275
CHAPTER 15
Changes in Credit Risk and Market
Risk Policies
Credit risk is present in all transactions into which a bank enters, whether the other party is anoth-
er institution; a manufacturing, merchandising, or any other type of company; or a physical person.
One or more of a bank’s counterparties may go bankrupt prior to fulfilling its contractual obliga-
tions. Or some of the counterparties may be unwilling to perform, as happened several times in the
1990s with derivatives contracts.
Quite similarly, any transaction made by a financial institution involves market risks. Their ori-
gin may be commitments concerning interest rates, from loans to derivative financial instruments;
currency exchange rates; equities and equity indices; as well as other commodities: Many of the
credit risks and market risks taken by an institution correlate. But so far few banks have the know-
how and technology to integrate them into the coherent estimate of exposure.
The rigorous quantitative measurement of exposure is a relatively new notion in finance, but
there is enough know-how from engineering and the physical sciences to make feasible this solu-
tion in connection with products and processes in banking, brokerage, and other financial industries.
The application of engineering measurement principles to banking and finance should not be an
exception, especially when it is commonly perceived that credit risk and market risk are on the rise.
Measurement represents an appropriate means of increasing control and of improving the qual-
ity of management. However, the need for measurements regarding financial products and process-
es contrasts in many cases with deficiencies some of the current metrics reveal when analyzed from
a rigorous implementation viewpoint. To a substantial extent, these problems are a consequence of
the use of inadequate methods of definition and validation.
Because the profession of banking is becoming more sophisticated year after year, the measure-
ment of credit risk and market risk is now seen as a key issue for financial and nonfinancial insti-
tutions. Even if in the 1990s losses from corporate defaults were rather low, default rates rose. They
are expected to rise significantly more in the near future. And because volatility is high, market risk
is also increasing.
To cope with this dual amplification of risk, top-tier banks use innovative models, methods, and
techniques to measure and manage their exposure internally. One approach is fair value assessment
of nonliquid assets and liabilities—for instance, bank loans and deposits. The Financial Accounting
Standards Board (FASB) defines fair value as market value other than a fire sale, at which a will-
ing seller and a willing buyer agree to exchange assets.
276
CREDIT RISK,MARKET RISK,LEVERAGE, AND THE REGULATORS
Chapter 14 discussed marking to model. Reference was made to several credit risk models cur-
rently available, such as RAROC, LAS, and ACRA, which can be used effectively (but carefully)
to estimate credit risk. The use of models itself involves risks: Assumptions may be faulty; hypothe-
ses may be undocumented; and data obsolete, biased, or outright inaccurate.
The exploration of these issues and avoidance of their pitfalls stimulates the effective sharing of
ideas on how to identify risks and bring them under control. There are indeed many challenges.
Increasingly, bankers find that the ability to integrate counterparty exposure with the different types
of market risk is the cornerstone to the able handling of their institution’s business. Such integration
helps in better appreciating the risks the bank is taking in its daily practice and in managing those that
are already in its portfolio. This is one of the major changes in credit risk and market risk policies.
ART OF CREDIT RISK AND MARKET RISK INTEGRATION
Bankers should not only appreciate the similarities and differences between exposures in credit
risk and market risk but also understand the information needs and computational requirements nec-
essary to estimate each one of them accurately and bring the two together. The aggregation of mar-
ket and credit risk is critical in determining the true risk of loss faced by a credit institution, invest-
ment bank, or any other entity.
This integration is important inasmuch as a rational way to allocate economic capital
1
is on the
basis of combining risk of loss prevailing in different channels. Without appropriate measurements
and steady follow-up on these measurements, any business is subject to the law of unintended con-
sequences. Integrated credit risk and market risk figures, by major client, correspondent bank, or
other counterparty, is a basic ingredient of both:
• Active portfolio management, and
• A proactive risk control system.
Take as an example Long Term Capital Management (LTCM), the nearly bankrupt Rolls-Royce
of the hedge funds. Money center banks, brokerage firms, and other counterparties that dealt with
LTCM faced both credit risk and market risk, and they did so in a triple capacity:
1. They were shareholders in LTCM.
2. They loaned money to LTCM.
3. They did derivatives trades with LTCM.
Cases along this triple line of exposure happen practically every day. Therefore, a prudent risk
evaluation by senior management obliges the integration of market risk and credit risk along a
framework that makes feasible a rigorous analytical approach and provides results pointing to cor-
rective action. This framework should, for instance, permit managers to:
• Assess the credit risk embedded into a derivatives portfolio.
• Evaluate the implications of netting agreements on credit risk.
• Test correlation assumptions between market risk and obligor default.