Managing cash flow an operational focus phần 7 ppt
Bạn đang xem bản rút gọn của tài liệu. Xem và tải ngay bản đầy đủ của tài liệu tại đây (176.31 KB, 37 trang )
explanation of why the present conditions are happening, the underlying causes,
and how to prevent them from recurring. Recommendations should be practical
and reasonable so that management easily sees the merits in adopting them.
In developing recommendations, try to answer these questions:
1. What is recommended to correct the situation?
2. Is the recommendation based on a logical connection to the present prac-
tice?
3. Is the recommendation practical and reasonable for implementation?
Many times, a workable recommendation seems to suggest itself, but in
other cases the study team may need some ingenuity to come up with a recom-
mendation that is sensible and has a reasonable chance of being adopted.
Recommendations should be as specific and helpful as possible, not simply that
operations have to be improved, controls must be strengthened, or planning sys-
tems must be implemented. Team members should do their best to make certain
that their recommendations are practical and acceptable to those responsible for
taking action.
RECOMMENDATIONS SHOULD BE LOGICAL,
PRACTICAL, REASONABLE, SPECIFIC, AND HELPFUL.
The study team should strive for a cooperative atmosphere with manage-
ment and operating personnel, whereby the team’s role becomes one of a helping
and a change agent. In such a working relationship, there is a much greater likeli-
hood that management will accept the recommendations.
SPECIFIC RECOMMENDATIONS
The cash management study team performs the following work steps:
1. Observation of all accounting function activities
2. Development, analysis, and summary of survey forms for each account-
ing function
3. Interviews of all accounting management and operations personnel
4. Development and analysis of systems flowcharts for all accounting func-
tions and activities
5. Development and analysis of data as shown above for each area of the
accounting function
6. Contact with and visits to three representative competitors to determine
similarities and differences and to identify best practices
214 Analyzing Non-Value-Added Functions
7. Periodic meetings with accounting personnel to review findings and con-
clusions to determine their appropriateness
Based on the preceding work steps, the following recommendations are
developed by functional accounting area:
Accounts Payable
The following five recommendations were made for accounts payable:
1. Reduce the number of accounts payable payments through consideration
of the following recommendations:
• Eliminate all payments for $100 or less by establishing a direct payment
system such as department credit cards, immediate cash payments, or
telephone orders as a release from a total dollar commitment.
• Reduce the number of payments for larger items by negotiating with the
major vendors as to paying at the time of merchandise receipt with the
guarantee of on-time quality deliveries. Items to consider in such negoti-
ations include long-term commitments with shorter term releases, the
ability to deliver on time at close to 100 percent quality (no returned
items), the loss of a discount (at present mostly 1 percent for 10 days or an
annual rate of 18.4 percent), and savings in accounts payable processing
• Solicit other vendors to become part of a similar payment system. The
study team talked to the six major vendors, and they are all interested in
developing such a pay-on-receipt system. Two of the company’s competi-
tors have already installed such systems. It is estimated that the company
can reduce the number of accounts payable payments to be processed
from the present level of 26,000 annually to fewer than 6,000.
2. Work with major (and other) vendors to educate them on how the com-
pany operates so that they can be directly plugged into the company’s
production control system, allowing for 100 percent on-time deliveries
and quality of product.
3. Integrate the receipt of merchandise with the approval of the payment
that will eliminate the need for accounts payable personnel to review the
same documentation. In effect, the receipt of the merchandise should trig-
ger the processing of the payment.
4. Reduce the number of personnel assigned to the accounts payable func-
tion, once the above recommendations are in place, from the present level
of nine people to no more than two. There is no need for a manager and a
supervisor or accounts payable processors. The remaining processing can
be accomplished through the use of two data base analyzers. This should
result in an annual savings of over $115,000 based on last year’s actual
costs of $164,400.
Specific Recommendations 215
5. Integrate the above cost savings into product cost structures so that the
company can effectively reduce its product costs and related pricing to
become more competitive.
Accounts Receivable
Six recommendations were developed for accounts receivable:
1. Integrate the sales forecast system into the overall company plan so that
manufacturing can produce to a higher level of real customer orders
assuring a greater degree of quality on-time deliveries. This will allow the
company to better negotiate with their major customers as to long-term
commitments and increased overall sales.
2. Establish long-term contracts with each of the company’s major customers
including the ability to receive payment via electronic data transfer at the
time of shipping merchandise. This will require the company to guaran-
tee 100 percent quality and on-time deliveries. If this can be accomplished,
the company can negotiate such long-term contracts locking in price, pro-
duction and delivery schedules, and future payments for cash flow pur-
poses. This will enable the company to prepare better profit and cash flow
projections.
3. Reduce the number of customer billings through the implementation of
the following recommendations:
• Establish a direct cash payment system for items less than $500, using
credit cards, direct cash payments, and similar vehicles.
• Implement a policy of payment upon shipment or receipt of merchandise
for major customers, considering such factors as ability to make on-time
quality deliveries, negotiated long-term contracts with adequate notice as
to delivery schedules so as to incorporate such deliveries into the produc-
tion schedule, the loss of a 1 percent 10 day discount for the customer, and
the ability of the customer to pay on this basis.
• Encourage other customers to accept either the direct cash or pay on
receipt system. With better control over costs and pricing, the company
should be able to lower prices overall to make these systems attractive to
their customers. Three competitors are already implementing such sys-
tems into their operations. It is estimated that the company can reduce the
number of customer bills from the present level of 30,000 annually to less
than 4,000.
4. Establish effective credit policies so that customers are sold only the
amount of merchandise they can pay for. Such credit policies must be flex-
ible so that each customer’s sales can be maximized without sacrificing
the risk of long or no payment.
5. Once the above recommendations are in place, reduce the number of per-
sonnel assigned to the accounts receivable function from the present level
of 13 personnel to no more than 4 individuals. There is no need for a man-
216 Analyzing Non-Value-Added Functions
ager and a supervisor or accounts receivable processors. The remaining
processing can be accomplished through the use of two database analyz-
ers, one customer service contact, and one credit and collections coordi-
nator. This should result in annual savings of over $150,000 based on last
year’s actual costs of $264,100.
6. Integrate billing, accounts receivable, and collections into the overall com-
pany computer system so that minimal offline processing is necessary.
This will result in the use of two database analyzers rather than accounts
receivable processors.
Payroll
The biweekly payrolls being processed by the company do not incorporate any
features that would be unexpected in standard payroll processing. It is presently
costing the company over $136,000 annually to process these payrolls. It is recom-
mended that the company consider one of three proposals for an outside payroll
service providers to take over these functions at an annual savings of at least
$100,000. We have talked to the following payroll vendors and their annual costs
to support the company’s 250-person payroll would be as follows:
ABC Payroll $35,000
The Payroll Company $28,000
Your Payroll Inc. $32,000
All of these vendors are reputable in the field, and all offer the features nec-
essary for the company:
• Uploading of payroll data from the company’s computer systems
• Integration of payroll processing with manufacturing labor distribution
and the company’s budget system
• Processing of all salary payrolls on an exception basis; that is no input
required unless there has been a change
• Processing and control of all payroll changes, with feedback and approval
by the company, prior to payroll processing
• Full maintenance of personnel related data fields such as vacation time
accrued and taken, sick time, personal leave, nonchargeable time, and so
on
• Confidentiality in processing all payrolls including the management pay-
roll
• Downloading of data files and reports from their computer system to the
company’s as a standard or a request basis, or in combination
• Preparation and submission of all payroll reports to regulatory and taxing
authorities
• Preparation of W-2’s for each individual at the end of the year
Specific Recommendations 217
All five of the company’s competitors that were visited presently handle
their payrolls in this manner.
General Ledger
The company has an integrated computerized accounting system in which each of
the subsystems automatically updates the general ledger. It also allows for auto-
matic posting of standard journal entries. There is little else that needs to be
entered into the general ledger. The company should allow the system to work as
intended. Through the use of one data base analyzer the company should be able
to presume that the general ledger is accurate. With such up-to-date processing
accuracy, the company should be able to prepare financial statements (via screen
display or hard-copy report) whenever it desires.
Within the company, functional disciplines (e.g., sales, manufacturing, mar-
keting, purchasing, accounting, and computer processing) are interdependent. All
of these functions must work together to successfully achieve organizational goals
and objectives. The overall plans of the organization must be clearly communi-
cated so that each functional area is aware of what needs to be done to ensure
smooth integration with other areas and the entire company. Effective profit plan-
ning and budgeting are among the tools used to coordinate the organizational
plans and the detailed activities of each of the disciplines. The budget then is a
detailed plan depicting the manner in which monetary resources will be acquired
and used over a period of time. The budget is the quantitative manifestation of the
current year of the company’s strategic plan. It is an integral part of the compa-
ny’s short-term operating plan.
The company’s budget system, within the preceding definitions, can be ini-
tiated and maintained through the computer system. Revenue transactions can be
automatically posted through the recording of sales transactions. These sales data
can be compared to sales forecasts (by sales person, customer, product, customer,
and so on). Expense transactions can be automatically posted against the budget
system with suspect items flagged and automatic budget adjustments processed.
The budget should be considered as part of the company planning process and as
a continual process (not once a year) with flexible budgeting concepts considered.
In this manner, the company plan can be continuously reviewed and updated
along with the corresponding budget.
FLEXIBLE BUDGETING MEANS A CHANGE IN THE
REPORTING OF THE BUDGET—NOT A CHANGE TO
THE BUDGET ITSELF.
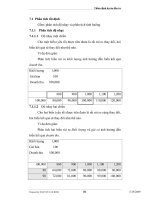
A manufacturing budget report was shown in Exhibit 6.10. An example of a flex-
ible budget, using the same data, is shown in Exhibit 6.11. The adjusted budget
218 Analyzing Non-Value-Added Functions
figures in Exhibit 6.11 reflect what the budget would have been at the actual level
of units produced.
The preparation of a flexible budget requires the company to know its fixed
and its variable costs, so that the budget numbers can be adjusted appropriately.
Flexible budgeting does not mean a change in the budget—only a change in the
reporting of the budget figures to reflect the company’s actual activity level (Units
Produced in this example). This process allows the company to compare actual
costs incurred to what those costs should have been at the experienced level of
activity, and thereby allows more realistic and effective cost control to be estab-
lished.
With the implementation of the preceding recommendations, the company
will be able to eliminate the entire general ledger function, with annual savings of
$120,000. One of the previously mentioned database analyzers would also be
responsible for the general ledger data files.
Internal Statements for Profit Improvement
The reporting process in the company is typically given little attention unless it is
unsatisfactory to the recipient. Effective reporting is the means by which the
accounting function communicates with the rest of the company. Good reporting
can do wondrous things in communicating effectively within the company, while
poor reporting can be doubly negative in its impact: first, because poor reporting
may have unusable, incorrect, or untimely information and thereby lead to
improper understanding and decisions; and second, because poor reports, even if
accurate, can cause the reader to turn away in frustration if the information
desired is buried deep within a morass of irrelevant (to the reader) or confusing
Specific Recommendations 219
Division A Division B
Adj. Adj.
Budget Actual Variance Budget Actual Variance
Units produced 20,000 18,000 (2,000) 20,000 24,000 4,000
Sales $ 900 $ 940 $ 40 $ 1,200 $ 1,152 ($48)
Costs:
Material 180 190 (10) 240 225 15
Direct labor 126 130 (4) 168 160 8
Var. overhead 122 125 (3) 162 158 4
Fixed overhead 175 170 5 175 173 2
_______ ______ _____ _______ ______ ____
Total costs 603 615 (12) 745 716 29
_______ ______ _____ _______ ______ ____
Gross Profit $ 297 $ 325 $28 $ 455 $ 436 ($19)
_______ ______ _____ _______ ______ ____
_______ ______ _____ _______ ______ ____
Exhibit 6.11 Manufacturing Budget Report—Flexible
($$ in 000s)
facts and figures. Good reporting should encompass effective concepts and fea-
tures, such as:
• Exception reporting. Highlighting only those areas requiring attention
• Flexible budget reporting. Directed toward a range rather than a single level
of activity and that can be adjusted to reflect changes resulting from vari-
ations in activity
• Summarized reporting. Providing appropriate information for each level
within the organization so that these activities can be operated effectively
• Comparative reporting. Comparing operating results with realistic stan-
dards such as:
• Actual versus budget (or what it should be)
• Current year or period versus previous year or period
• Standard costs and/or revenues
• Company goals, objectives, and detail plans
• External benchmarks, such as competitors’ results or industry standards
GOOD REPORTING IS ACCOUNTING’S
OPPORTUNITY TO COMMUNICATE EFFECTIVELY
WITH OPERATING FUNCTIONS.
The company’s typical financial statements, consisting of a balance sheet,
income statement, and statement of cash flow are primarily directed toward the
reporting of historical results to management and a host of outsiders such as
lenders and creditors, shareholders and investors, and regulatory agencies. It
often takes at least 10 days to complete these financial statements after the end of
a month. Although this information may be useful to those to whom the reports
are directed, it has more limited operational value to those responsible for running
major areas of the company and generating results. The primary reason for this
reduced value is that the financial reports are geared toward the expectations and
needs of the external users, and these expectations are different from the needs of
internal users who require data to tell them what is happening operationally at
present that will assist them in future decision making.
In order to develop meaningful internal statements and reports, an analysis
of operations is performed to determine what useful information is needed to
properly conduct operations in the most economical, efficient, and effective man-
ner. To this end, the company has to recognize both the internal and external envi-
ronments in which it operates. Among the internal and external issues that have
to be considered are:
• Market and customers
• Production or service provision processes
220 Analyzing Non-Value-Added Functions
• Growth opportunities and/or requirements
• Systems: computer, control, personnel, inventory
• Workforce needs
• Human resource philosophies
• Strategic directions
TRADITIONAL FINANCIAL STATEMENTS DON’T
MEET OPERATIONAL NEEDS.
To effectively analyze financial data and related statements and determine
how the organization is doing, and to zero in on critical areas needing attention
and assistance, the company can use certain analytical tools:
• Comparisons. Financial statements are historical documents that are basi-
cally static—showing data related only to a specific period of time.
However, business owners and managers (and other financial statement
users) are concerned not only with the period being reported, but also
with the trend of events over longer periods of time. Accordingly, finan-
cial statement analysis for just one period of time is of limited value.
However, when financial statement data are compared with one or
more of the following, the company can gain a better understanding of
trends and make proper decisions about their significance. Although
none of us can change the past (or predict the future), the company can
use past performance as a yardstick or benchmark of present position for
making more accurate decisions for the future. Possible comparisons
include:
• Historical performance of the business itself (results of prior periods)
• Competitors’ performance (other similar businesses)
• General industry performance (other businesses within the same
industry)
• Organizational goals, objectives, and detail plans
• Trend percentages. Financial statement analysis can also be accomplished
through the use of trend percentages, which are used to state a number of
years’ financial data in terms of a base year. The rule in using trend per-
centages is that at least three data points must be examined before a trend
can be identified.
• Common-size statements. A common-size financial statement shows the line
items as in percentages as well as in absolute dollars. Each line item on the
financial statements is shown as a percentage of a total, either total assets
or sales. The presentation of common-size statements is known as vertical
analysis—revealing changes in the relative amount of each line item.
Specific Recommendations 221
• Financial and operational ratios. Proper financial analysis of the company’s
results provides for the measurement and evaluation of progress towards
accomplishing both financial and operational goals and objectives (i.e.,
earning an adequate return on investment or maintenance of a satisfacto-
ry market position). The company’s financial position usually involves
two fundamental considerations:
1. Potential for survival: Measured by liquidity (ability to meet short-term
financial obligations), solvency (ability to meet long-term financial obli-
gations), and leverage (ratio of external to internal funds used to make
up the capital structure of the company)
2. Performance: Toward meeting financial and operational goals, meas-
ured by asset management and profitability results
Ratios, which represent a mathematical relationship between two quantita-
tive conditions, are the primary method used for such analysis. When measured
over a period of time, ratios identify changes or trends in the company’s opera-
tions. They also provide valuable information in identifying operational trouble
spots. Identifying the real operational problems of an organization and the inher-
ent causes (not the symptoms) can be extremely difficult, and sometimes only a
creative approach will uncover the real underlying situation.
The company should develop and provide a financial statement and internal
operations reporting package that:
• Integrates the company’s financial statements with the operating needs of
the organization
• Uses financial data in an operating format to identify operational prob-
lems and causes within the organization
• Uses financial and operating data for more effective decision making
directed toward positive growth
The preparation and analysis of the basic financial statements is only the
starting point for developing an encompassing financial and operational report-
ing package. If financial statement analysis is done properly, it can provide useful
information about the company’s past financial performance and current status.
However, without recognizing the company’s internal operations (and external
environment) and the manner in which it operates, financial analysis alone cannot
tell the entire story. The internal operating and external issues that have to be con-
sidered can include the following:
• Product analysis. What to sell, to whom, product costs, and what to charge
(pricing structures)
• Customer base. What markets to be in, who to sell, how much of which
products, how to service
222 Analyzing Non-Value-Added Functions
• Sales forecasting. How much of which products, to whom, and how to sell
• Manufacturing or service providing processes: what to provide, how to
provide, and efficiencies to use
• Integrated systems. Sales/marketing, manufacturing, engineering, finan-
cial, and personnel
• Planning and budgeting systems. Strategic, long-term, short-term, and detail
plans
WITHOUT UNDERSTANDING THE BUSINESS’S
INTERNAL AND EXTERNAL ENVIRONMENT RATIOS
TELL ONLY PART OF THE STORY.
Businesses that do not understand these principles and use improper inter-
nal operations reporting may engage in many bad practices that sacrifice good
customer sales for immediate cash, such as:
• Selling off inventory at less than desirable prices (sometimes at a real loss)
to acquire cash. This results in unfavorable sales and jeopardizes more
favorable future sales. It also may set a bad precedent and unfair expecta-
tions for customers.
• Selling more to existing customers at larger than normal markdowns,
which may result in sacrificing future sales and establishing a bad
precedent.
• Selling to existing customers greatly in excess of their established credit
limits, which may result in the customers’ inability to pay and discontin-
uation of future orders.
• Relaxing payment terms so as to sell off excess goods or services.
Although the business may make a sale, it may not be able to collect on it
for a long time—or ever.
• Selling to less than desirable customers. Again, the company may make
the sale, but never collect on it. It must be kept in mind that the company
is not in the sales and accounts receivable business.
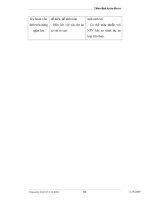
A suggested set of financial reports are shown in Exhibits 6.12 through 6.16.
Review of Internal Operations
The information uncovered through the preceding financial reporting and analy-
sis assists management and operations personnel in identifying the impact of
financial policies and conditions on the company’s cash and profitability posi-
tions. However, effective operational analysis should go beyond financial analysis
Specific Recommendations 223
to include a more in-depth review and analysis of specific areas of the company’s
operations as well.
Most companies are in more than one business; that is, they offer their cus-
tomers a number of different product lines. For instance, the company may offer
a low-end, a medium-end, and a high-end line; or a basic, standard, and custom
or specialty line; or it may provide a basic piece of equipment (e.g., copy machine),
224 Analyzing Non-Value-Added Functions
Current Year Previous Year
$% $%
ASSETS
Cash $ 60 0.4 $ 400 4.1
Accounts receivable 3,720 24.2 2,160 21.9
Inventory 5,360 34.8 2,400 24.3
______ ____ ______ ____
Current Assets 9,140 59.4 4,960 50.3
Property, plant and equipment 7,580 49.2 5,680 57.6
Accumulated depreciation (2,160) (14.0) (1,540) (15.6)
______ ____ ______ ____
Net property, plant and equipment 5,420 35.2 4,140 42.0
Other assets 840 5.4 760 7.7
TOTAL ASSETS $15,400 100.0 $9,860 100.0
______ ____ ______ ____
______ ____ ______ ____
LIABILITIES AND EQUITY
Liabilities:
Accounts payable $ 1,960 12.7 $ 840 8.5
Notes payable 200 1.3 200 2.0
Current maturities long-term debt 840 5.5 680 6.9
Other current liabilities 560 3.6 440 4.5
______ ____ ______ ____
Current liabilities 3,560 23.1 2,160 21.9
Long-term debt 7,680 49.9 5,200 52.8
______ ____ ______ ____
Total Liabilities 11,240 73.0 7,360 74.7
Equity:
Common stock 200 1.3 200 2.0
Additional paid-in-capital 200 1.3 200 2.0
Retained earnings 3,760 24.4 2,100 21.3
______ ____ ______ ____
Stockholders’ equity 4,160 27.0 2,500 25.3
______ ____ ______ ____
TOTAL LIABILITIES AND EQUITY $15,400 100.0 $9,860 100.0
______ ____ ______ ____
______ ____ ______ ____
Exhibit 6.12a Comparative Balance Sheets and Income Statements
Balance Sheet as of December 31 ($$ in 000s)
Showing % of Total Assets
Specific Recommendations 225
Current Year Previous Year
$% $%
Net sales $12,500 100.0 $9,360 100.0
Cost of goods sold:
Material 2,260 18.1 1,720 18.4
Labor 3,260 26.1 2,340 25.0
Manufacturing expenses 2,080 16.6 1,720 18.4
______ ____ _____ ____
Total Cost of Goods Sold 7,600 60.8 5,780 61.8
______ ____ _____ ____
Gross Profit 4,900 39.2 3,580 38.2
Selling expenses 1,120 9.0 840 9.0
General and administrative
expenses 1,480 11.8 1,040 11.1
______ ____ _____ ____
Total Operating Expenses 2,600 20.8 1,880 20.1
______ ____ _____ ____
Net Profit before Taxes 2,300 18.4 1,700 18.1
Provision for Income Taxes 640 5.1 480 5.1
______ ____ _____ ____
NET INCOME $ 1,660 13.3 $1,220 13.0
______ ____ _____ ____
______ ____ _____ ____
Exhibit 6.12b Income Statement for Year Ending December 31 ($$ in 000s)
Showing % of Sales
USES OF FUNDS
$ Change % Change
Accounts receivable $1,560 72.2%
Inventory 2,960 123.3%
Net property, plant and equipment 1,280 30.9%
Other assets 80 10.5%
_____
Total $5,880 62.2%
_____ _____
_____ _____
SOURCES OF FUNDS
$ Change % Change
Retained earnings $1,660 79.1%
Long-term debt 2,640 44.9%
Accounts payable 1,120 133.3%
Cash reduction 340 85.0%
Other liabilities 120 27.3%
_____\
Total $5,880 53.8%
_____ _____
_____ _____
Exhibit 6.13 Uses and Sources of Funds from Previous Year to Current Year ($$ in 000s)
replacement parts, and supplies. An analysis of the company’s records can be
used to develop individual income statements for each of its product lines.
In many cases, such an analysis, employing existing records, may be
extremely difficult or costly. Therefore, it is best to establish what information will
be needed in setting up the company’s reporting system. Data collection and com-
puter processing procedures should be established to automatically provide the
operating data and statistics desired for effective management.
Income statements can then be constructed using the following process:
• Net sales. Analysis of actual invoices for the year and distribution of sales
amounts to respective product lines
• Cost of goods sold. Material, labor, and manufacturing expenses assigned to
product line, based on totals derived from actual manufacturing orders
and production data
• Operating expenses. Actual marketing and administrative costs by prod-
uct line may be difficult to determine. If so, these costs can be prorated
based on sales volume of the product line or some other logical basis for
allocation
An example of an income statement by product line is shown in Exhibit 6.17.
Note that each product line can be considered a separate business or profit
center. In addition, the company can consider each product within a product line
226 Analyzing Non-Value-Added Functions
$ Change % Change
SALES $3,140 33.5%
Cost of goods sold:
Material 540 31.4%
Labor 920 39.3%
Manufacturing expenses 360 20.9%
_____
Total Cost of Goods 1,820 31.5%
Gross Profit 1,320 36.9%
Selling expenses 280 33.3%
General and administrative expenses 440 42.3%
_____
Total Operating Expenses 720 38.3%
Net Profit 600 35.3%
Provision For Income Taxes 160 33.3%
_____
NET INCOME $ 440 36.1%
_____ _____
_____ _____
Exhibit 6.14 Income Statement Change from Previous Year to Current Year ($$ in 000s)
Specific Recommendations 227
Current Previous
Year Trend Year
Dollars Index Dollars
Net Sales $12,500 1.34 $9,360
Cost of goods sold:
Material 2,260 1.31 1,720
Labor 3,260 1.39 2,340
Manufacturing expenses 2,080 1.21 1,720
_____ ____ _____
Total Cost of Goods Sold 7,600 1.31 5,780
Gross Profit 4,900 1.37 3,580
Selling expenses 1,120 1.33 840
General and administrative expenses 1,480 1.42 1,040
_____ ____ _____
Total Operating Expenses 2,600 1.38 1,880
Net Profit 2,300 1.35 1,700
Provision for income taxes 640 1.33 480
_____ ____ _____
NET INCOME $1,660 1.36 $1,220
_____ ____ _____
_____ ____ _____
Exhibit 6.15 Income Statement Trend Percentages from Previous Year to Current Year
Previous Year = Base Year @ 1.00 ($$ in 000s)
Current Previous
Year Year
1. Survival Ratios
a. Liquidity ratios
• Current ratio 2.57 : 1 2.30 : 1
• Quick ratio 1.06 : 1 1.19 : 1
b. Leverage/solvency ratios
• Debt to equity 2.70 : 1 2.94 : 1
• Debt to assets 0.73 : 1 0.75 : 1
2. Performance Ratios
a. Accounts receivable
• Turnover 3.36 ϫ 4.33 ϫ
• Collection period 108.6 days 84.2 days
b. Inventory
• Turnover 1.96 ϫ 2.89 ϫ
• Age 186.2 days 126.3 days
c. Accounts payable
• Days 70.1 days 40.0 days
• To Accounts Receivable 1.90 ϫ 2.57 ϫ
Exhibit 6.16 Financial and Operational Ratio Analysis: Current and Previous Year
as a separate profit center, as well as each production job, customer order, or each
individual customer. Each of these analyses helps to determine exactly what is
happening currently, trends in previous periods, and what remedial action may be
necessary.
Product-line reporting should be integrated with the original sales forecast
and modifications, which should be part of the company’s planning process. This
reporting allows company management to determine whether they are progress-
ing toward the right goals and whether any action must be taken. Such action
could result in product modifications, sales and marketing changes, or changes in
customer philosophy, work plan, or sales methodologies. It is the ability to deter-
mine specifically what information is significant to report that makes the report-
ing most valuable to the individual users and to company management.
IDENTIFY THE COMPANY’S KEY OPERATING
INDICATORS.
In addition to financial data, ratios, and trends, the company should look at
other key operating indicators such as backlog, real customer sales, accounts
receivable and collections, inventory changes, personnel levels and use, and so on.
228 Analyzing Non-Value-Added Functions
Products
Total A B C
Net Sales $12,500 $5,900 $4,300 $2,300
Cost of goods sold:
Material 2,260 760 740 760
Labor 3,260 1,600 1,300 360
Manufacturing Expenses 2,080 1,040 720 320
_______ ______ ______ ______
Total Cost of Goods Sold 7,600 3,400 2,760 1,440
Gross Profit 4,900 2,500 1,540 860
Selling expenses 1,120 348 586 186
General/administrative expenses 1,480 816 246 418
_______ ______ ______ ______
Total Operating Expenses 2,600 1,164 832 604
NET PROFIT $ 2,300 $1,336 $ 708 $ 256
_______ ______ ______ ______
_______ ______ ______ ______
Sales—% of total 100.0% 58.1% 30.8% 11.1%
Gross Profit—% of sales 39.2% 42.3% 35.8% 37.4%
Net Profit—% of sales 18.4% 22.6% 16.5% 11.1%
Exhibit 6.17 Income Statement by Product Line ($$ in 000s)
Based on the operational analysis, it is apparent that sales, accounts payable,
accounts receivable, and the number of employees have all increased. Is this the
sign of a healthy, growing company? Growing, yes; healthy, not necessarily. Such
increases can be interpreted completely differently. For example:
• Increased sales may be the result of sales to existing customers exceeding
safe credit limits or to less desirable customers, creating possible col-
lectibility or non-payment problems.
• Increased accounts payable and accounts receivable may mean increases
in returned merchandise to vendors and to the company by its customers,
indicating unacceptable vendors and dissatisfied customers.
• Increased accounts receivable may mean recorded sales without corre-
sponding collected accounts.
• Increased number of employees may mean more management and
increased expenses, without corresponding increases in value-added pro-
ductivity.
• Increased work volumes may be more a function of building personnel
empires and keeping those employees busy than of real volume increases.
The correct interpretation of what is really happening in a company could
well be distinguishing between the healthy company with best practices from the
sick organization with many operating deficiencies. It is best to identify such
Specific Recommendations 229
Products
ABC
1. Sales prices and units sold
Total sales in $ $5,900 $4,300 $2,300
Units sold in 000s 62.0 55.4 65.6
Average unit price $95.16 $77.62 $35.06
2. Backlog statistics
Total backlog in $ $1,980 $1,360 $1,060
Percent of sales 33.6% 31.6% 46.1%
3. Accounts Receivable
Total accounts receivable in $ $1,680 $1,240 $ 800
Collection days 103. 106.1 127.0
Turnover times 3.5 3.4 2.9
4. Inventory
Total inventory in $ $2,400 $1,760 $1,200
Turnover times 1.4 1.6 1.2
Average inventory age in days 258 230 304
Exhibit 6.18 Operating Information by Product Line ($$ in 000s)
230 Analyzing Non-Value-Added Functions
Current Year Previous Year
Number Annual Number Annual
Employees Dollars Employees Dollars
Type of Payroll
Manufacturing:
Manufacturing operations 102 $2,285 90 $1,624
Manufacturing supervision 26 975 17 841
General and administrative:
Accounting functions 38 787 31 634
All others 34 693 26 522
Sales department:
Sales staff 12 620 10 465
Sales management 8 512 6 348
____ ______ ___ ______
Total—All Payrolls 250 $5,872 180 $4,434
____ ______ ___ ______
____ ______ ___ ______
Current Year Previous Year
Payroll Payroll
Sales per % of Sales per % of
Employee Sales Employee Sales
Payroll Costs to Sales
Manufacturing operations $ 122,549 18.3% $ 104,000 17.4%
Manufacturing supervision 480,769 7.8% 550,588 8.9%
Accounting functions 328,947 6.3% 301,935 6.8%
Other general & administrative 367,647 5.5% 360,000 5.6%
Sales staff 1,041,667 5.0% 936,000 5.0%
Sales management 1,562,500 4.1% 1,560,000 3.7%
_____ _____
Total employees 50,000 47.0% 52,000 47.4%
_____ _____
_____ _____
Current Year Previous Year
Average Cost Per Employee
Manufacturing operations $22,400 $18,044
Manufacturing supervision 37,500 49,470
Accounting functions 20,700 20,452
Other general & administrative 20,380 20,077
Sales staff 51,700 46,500
Sales management 64,000 58,000
Total 23,488 24,633
Exhibit 6.19 Payroll and Employee Analysis ($$ in 000s)
Specific Recommendations 231
Current Year Previous Year
Customer Name Sales $ Percent Sales $ Percent
Product A
Paul Brothers Company $1,978 33.5% $1,440 29.4%
Apex Industries 1,706 28.9% 1,230 25.1%
Kontrol Manufacturing 566 9.6% 453 9.2%
Sandstone, Inc. 346 5.9% 578 11.8%
Textite Industries 270 4.6% 434 8.9%
Ace, Inc 442 7.5% 259 5.3%
______ ______ ______ ______
Subtotal 5,308 90.0% 4,394 89.7%
Other customers 592 10.0% 501 10.3%
______ ______ ______ ______
Total—All Customers $5,900 100.0% $4,895 100.0%
______ ______ ______ ______
______ ______ ______ ______
Product B
Paul Brothers Company $ 335 7.8% $ 460 15.0%
Apex Industries 475 11.0% 640 20.8%
Kontrol Manufacturing 678 15.7% 368 12.0%
Sandstone, Inc. 252 5.9% 84 2.7%
Textite Industries 173 4.0% 36 1.2%
Ace, Inc 858 20.0% 637 20.7%
______ ______ ______ ______
Subtotal 2,771 64.4% 2,225 72.4%
Other customers 1,529 35.6% 845 27.6%
______ ______ ______ ______
Total—All Customers $4,300 100.0% $3,070 100.0%
______ ______ ______ ______
______ ______ ______ ______
Product C
Paul Brothers Company $ 100 4.3% $ 220 15.8%
Apex Industries 144 6.3% 212 15.2%
Kontrol Manufacturing 319 13.9% 69 4.9%
Sandstone, Inc. 477 20.7% 187 13.4%
Textite Industries 520 22.6% 368 26.4%
Ace, Inc. 0 0.0% 142 10.2%
______ ______ ______ ______
Subtotal 1,560 67.8% 1,198 85.9%
Other customers 740 32.2% 197 14.1%
______ ______ ______ ______
Total—All Customers $2,300 100.0% $1,395 100.0%
______ ______ ______ ______
______ ______ ______ ______
Exhibit 6.20 Customers by Product Line ($$ in 000s)
problem areas before and as they happen—and take quick remedial action—
rather than wait until it is too late. The practice of preparing effective operating
reports that provide such information to management and operations personnel
needs to be instituted at the company.
Examples of such operating reports are shown in Exhibits 6.18 through 6.20.
Responsibility Accounting
HOLD PERSONNEL ACCOUNTABLE FOR ONLY
WHAT THEY CAN CONTROL.
Responsibility accounting and reporting is a control system in which managers
and operating personnel are held accountable for only those activities over which
they exercise a significant amount of control. Such a system assists in establish-
ing standards of performance against which to measure. Individual and group
results are then evaluated on the basis of performance, and positive remedial
action (e.g., coaching or facilitating) is offered to those not performing to expec-
tations. A system of responsibility reporting should be implemented by the com-
pany to control and monitor the successful achievement of planned activities and
results, as well as the effective use of resources (i.e., maximizing revenues and
minimizing expenditures).
Under a responsibility reporting system, individuals are delegated decision
making authority and held accountable for those activities occurring in their areas
of responsibility. The system operates according to the principle that individuals
should be responsible for their own performance (e.g., self-motivated disciplined
behavior) and the performance of all activities within their scope of responsibility
(e.g., vendors, customers, other employees). Advantages to the company of using
responsibility reporting include:
• Facilitates the delegation of authority and decision making
• Enables the company to implement planning and control programs
focused on establishing goals and objectives and the subsequent evalua-
tion of progress toward such objectives
• Establishes standards of performance to be used for evaluation purposes
• Provides criteria for performance evaluation
• Allows for identifying areas of concern by focusing on important vari-
ances from standards
• Assists in identifying the causes of problems so that the problems can be
fixed, rather than blame assessed
• Communicates clearly to each individual in the company those responsi-
bilities for which they will be held accountable, how they will be reward-
ed, and remedial action to be taken to prevent the recurrence of a negative
situation
232 Analyzing Non-Value-Added Functions
• Pins responsibility to the individual or work unit where corrective action
needs to be taken and ties the concern to other areas of the company that
might be affected by the condition and might be involved in the corrective
solution
ORGANIZATION RECOMMENDATIONS
The accounting functions are primarily working as if an integrated computerized
accounting system does not exist. Each function, although it inputs data into the
computer system, works on a stand-alone basis. Many of the activities that charac-
terize a manual accounting system (e.g., matching physical documents, checking
for coding errors, verifying math calculations) are still being performed. In addi-
tion, for limited control advantages, the company processes almost all vendor pay-
ments, customer billings, and collections on a manual basis. The cash management
study team’s recommendations to reduce the amount of accounts payable and
accounts receivable transactions, to outsource the payroll function, and to allow the
computer system to predominantly maintain the general ledger should allow the
company to realize personnel (and cash) savings of $692,700, as follows:
• Eliminate the internal controller position and its related staff positions.
For those functions such as borrowing, investing, capital expenditures,
and so forth, the company should engage the services of an external con-
troller. Study team members have talked to three extremely competent
individuals and their firms about assuming these duties and reviewing
financial and operational activities on an ongoing basis. Each one of them
would perform such services for a monthly fee of $3,000.
• Eliminate the manager and supervisor positions in each of the accounting
functions. The company should establish a policy of motivated self-disci-
pline for their employees so that such positions are unnecessary for polic-
ing the activities of their employees—in effect, all employees are
responsible for their own results.
• Use the integrated computer system as it was intended, so that the com-
pany does not have to pay processors but can engage database analyzers
and coordinators instead.
• Eliminate the clerical positions through the use of computerized routines
that are based on electronic data rather than on paper documentation.
• Streamline all remaining systems so that procedures can be accomplished
most economically, efficiently, and effectively, using computerized rou-
tines to the extent possible and eliminating all non-value-added activities.
• Dovetail all other company operations that would be affected by such
changes so that the company achieves overall benefits.
• Identify by-product benefits and best practices that can be implemented
within the remaining accounting activities and other related areas.
Organization Recommendations 233
The effective implementation of the preceding recommendations will result
in the following personnel requirements for the accounting functions:
External controller at $3,000 per month $ 36,000
Outside payroll processor 35,000
Database analyzers: for accounts payable,
accounts receivable, general ledger, and
reporting systems (two at $30,000 per year) 60,000
Systems coordinator to provide interface with
the other internal departments
and the outside payroll processor 25,000
_______
Total Proposed Personnel Costs 156,000
Present Personnel Costs 787,100
_______
Proposed Personnel Savings $631,100
_______
_______
In addition to these proposed personnel savings, the company should not
have to spend more than an additional $10,000 per year on other costs to support
these activities. This represents an additional annual savings of $61,600, based on
the current year’s actual costs of $71,600.
In reviewing the organizational concerns within the accounting functions,
the study team identified the following concerns to be addressed within the
accounting area as well as all other areas of the company:
• The need for a highly paid individual at the vice president level (e.g., con-
troller) for each function within the organization. This practice appears to
be justified by the perceived need to police and control those individuals
reporting to these persons. There is minimal value added by these indi-
viduals. For instance, the team is recommending the replacement of the
controller (but not necessary functions) by the use of an external controller
service.
• The use of managers for each function who report directly to a person at
the vice president level. These individuals are responsible for overseeing
the activities performed in their areas, but offer minimal value added
efforts. This appears to be an extension of the costly policing and control
philosophy.
• Individuals with the title “Supervisor,” who appear to be responsible for
accomplishing the daily activities but are really chief workers.
• The practice of adding individuals to the workforce rather than simplify-
ing work systems so that fewer personnel are required. For instance, there
are eight processors in the accounts receivable section, where no more
than two (even with present work volumes) are needed for most of the
month.
234 Analyzing Non-Value-Added Functions
• The assignment of clerical personnel to each functional activity. Although
a certain amount of clerical support is required for each activity, it is rare
that such support constitutes a full-time job (once redundancies and
unnecessary work steps are eliminated).
OTHER AREAS FOR REVIEW
The scope of this part of the company’s cash management study is to review and
analyze those functions and activities associated with the accounting division of
the company that can be eliminated, reduced, or performed more economically
and efficiently. However, the study team finds that many of their observations,
conclusions, and recommendations have an impact on other functional areas of
the company as well. Accordingly, they must bring these areas to the attention of
management so that they can take the appropriate follow-up action as part of a
quest for best practices in a program of continuous improvements. Examples of
other such areas for review are grouped in four major categories:
1. The recommendation to reduce the number of accounts payable transac-
tions includes the use of a direct cash payment system for small purchas-
es and payment to vendors at the time of receipt for large, long-term
contractual type purchases. Such practices will require the company to
address related activities in various ways:
• Responsibility of each department and work unit to control its own
budget and related expenditures using a direct cash system.
• Reduction in the number of purchase requisitions and purchase orders.
This will affect all departmental support staff as well as reduce pur-
chasing department efforts.
• Increased responsibility for purchasing department personnel to effec
tively negotiate with vendors, especially major vendors.
• With the present high level of merchandise returned to vendors, the
company must work more closely with its vendors to ensure close to
100 percent of on-time, quality deliveries.
• Manufacturing systems, such as production and inventory control,
must be fine-tuned so that they can effectively accommodate just in
time practices based on the reliability of vendors rather than on exces-
sive internal quality controls.
• Increased reliance on computer processing systems rather than elabo-
rate manual control systems.
2. Accounts receivable recommendations that encompass payment upon
receipt for small and low ticket sales and payment upon receipt for large
sales to major customers will require the company to consider the follow-
ing areas as well:
Other Areas for Review 235
• Establishment of procedures and controls to accommodate a cash pay-
ment system for low-ticket items.
• Effective negotiations with major customers to develop long-term
contracts with guaranteed delivery dates at prices at which the com-
pany can improve its profit margins. This will require a full analysis
of cost systems so that the company can produce the items at the low-
est cost possible. Each customer contract should be considered a prof-
it center.
• Integration of the sales function with company planning. Sales forecasts
must be more realistic so that they can be relied on to plan production
activities. Product should be produced for real customer orders rather
than for inventory. The sales department should be guided by the com-
pany plan rather than by the desire to maximize compensation. Such
changes may require a full analysis of the sales and manufacturing
areas, as well as the company planning processes.
• Customer analysis to determine with which present customers to
increase or decrease sales and which customers to terminate. In addi-
tion, there should be effective planning on which products to sell, in
what quantity, and to whom. Part of such a plan should be the identifi-
cation of prospective customers and how they can be approached.
• Increased attention to peripheral activities such as credit policies, col-
lection procedures, factoring, electronic data transfer, and so on.
• Increased discipline within the manufacturing area so the company can
meet all of its customer commitments on an on-time, quality basis.
Production schedule and control procedures must be integrated with
customer requirements. The company has to remove itself from the
inventory business and move back into the customer service and cash
conversion businesses.
3. The change from an internal Payroll Department to an outside payroll
processor necessitates that the company look at the following concerns:
• Accurate data discipline by all operating areas, as there will no longer
be personnel in-house to correct payroll input errors, which never
should have happened in the first place. Corrections can be made only
on an after-the-fact basis.
• Investigating the effective use of such outsourcing concepts for other
areas—for instance, the use of an external controller. Economies and
efficiencies can be realized in other areas as well, including manufac-
turing operations (e.g., grinding and smoothing), sales (e.g., brokers
and representatives), and engineering (e.g., per diem personnel as
needed).
• Integration of outsiders into company operations, making them part of
the organization even though they are not employees. The company
236 Analyzing Non-Value-Added Functions
must change its belief that everything must be controlled internally
with its own employees.
• Elimination of in-house activities and controls that will be taken over
by the outside servicer, such as data controls, numeric reconciliations,
and output verifications.
• The reduction and change in activities and related job positions, which
allow greater efficiency at much less cost within the accounting func-
tions, should be considered in an analysis of all other functions of the
company.
4. Integration of the general ledger with computerized subsystems and the
implementation of responsive financial and operating controls and report-
ing will have an impact on company operations in the following ways:
• Real time information will necessitate immediate action to address the
cause of a problem rather than the symptoms. This will require self-
motivated discipline by all employees and less reliance on managers
(and fewer managers) within a working together atmosphere. Such a
reporting system will assist the company in becoming a learning
organization.
• The reality of a continuous planning and flexible budget system will
require quick responsiveness to changes and more effective manage-
ment of each employee’s responsibilities.
• Adoption of an effective cost accounting system according to Activity
Based Costing principles will aid in reviewing all costs and activities in
an effort to bring costs and related prices to the minimum possible. This
will allow the company to become more competitive and build business
on a core of satisfied customers.
• Use of effective cash flow management techniques will allow for push-
ing costs to their minimums (e.g., labor and material), collecting sales
proceeds as soon as possible, and making payments as economically as
possible.
• Employees will have the flexibility to go to the work, rather than wait
for the work to come to them. Each employee should be evaluated and
rewarded based on results accomplished rather than a subjective sys-
tem such as seniority or personal preference.
• There will be greater reliance on computer procedures than on manual
controls, which should be implemented in all areas of the company.
CONCLUSION
Effective cash management study procedures allow a company to identify its crit-
ical problem areas and opportunities for improvement—maximizing positive
aspects of existing procedures and focusing the study on the most critical areas.
Conclusion 237
Through coordinating activities of various areas, the cash management study
process achieves positive changes in these areas simultaneously. The process also
allows such areas to work together in the analysis of present practices and the
implementation of new systems and procedures. In this manner, all areas learn
with less reinventing and change within the same time period.
The cash management study can be a stand-alone project to identify critical
problem areas and provide standardized improvements. It can also minimize the
practice of reinventing good practices that already exist in another part of the
organization. The study can also provide a comparison between the ways in
which different people perform the same task in the same area, or a comparison
of performance across different work units within the company. It can also pro-
vide the knowledge of operations and its effect on company cash flow.
In the review of the accounting function, a number of areas of potential
improvement are identified to make the company operate more economically, effi-
ciently, and effectively. The implementation of such improvements places the
company in a better position for future growth and profitability and will enable
the company to compete more effectively in the marketplace. Although there are
many other aspects of the company’s accounting practices that can be addressed
for productivity, cash flow, or profit improvements, these materials contain
effective examples of the types of conclusions and recommendations that can
result from such a cash management study. Because each company is different and
each cash management study is different, the resulting findings, conclusions, and
recommendations will also be unique to that study of the particular company.
In the present business atmosphere, with emphasis on customer service,
quality, economies and efficiencies, profit maximization, and cash management,
the cash management study becomes not a one-time, stand-alone project, but an
ongoing process of searching for best practices in a company program of continu-
ous improvements. The application of cash management procedures is everyone’s
responsibility.
CASH MANAGEMENT
IS EVERYONE’S RESPONSIBILITY.
238 Analyzing Non-Value-Added Functions