Báo cáo sinh học: "Characterization of porcine ENO3: genomic and cDNA structure, polymorphism and expression" potx
Bạn đang xem bản rút gọn của tài liệu. Xem và tải ngay bản đầy đủ của tài liệu tại đây (437.78 KB, 17 trang )
Original article
Characterization of porcine ENO3:
genomic and cDNA structure,
polymorphism and expression
Jian WU
1
**
, Donghai ZHOU
2
**
, Changyan DENG
3
*
, Xiaoxiong W U
1
,
Liangqi L
ONG
1
, Yuanzhu XIONG
3
1
Department of Basic Veterinary Medicine, School of Animal Sciences and School
of Veterinary Medicine, Huazhong Agricultural University, Wuhan 430070, P. R. China
2
College of Veterinary Medicine, Huazhong Agricultural University,
Wuhan 430070, P. R. China
3
Key Laboratory of Swine Genetics and Breeding, Ministry of Agriculture,
College of Animal Science and Technology, Huazhong Agricultural University,
Wuhan 430070, P. R. China
(Received 1st December 2007; accepted 4 March 2008)
Abstract – In this study, a full-length cDNA of the porcine ENO3 gene encoding a
434 amino acid protein was isolated. It contains 12 exons over approximately 5.4 kb.
Differential splicing in the 5
0
-untranslated sequence generates two forms of mRNA that
differ from each other in the presence or absence of a 142-nucleotide fragment. Expression
analysis showed that transcript 1 of ENO3 is highly expressed in liver and lung, while
transcript 2 is highly expressed in skeletal muscle and heart. We provide the first evidence
that in skeletal muscle expression of ENO3 is different between Yorkshire and Meishan pig
breeds. Furthermore, real-time polymerase chain reaction revealed that, in Yorkshire pigs,
skeletal muscle expression of transcript 1 is identical at postnatal day-1 and at other stages
while that of transcript 2 is higher. Moreover, expression of transcript 1 is lower in skeletal
muscle and all other tissue samples than that of transcript 2, with the exception of liver and
kidney. Statistical analysis showed the existence of a polymorphism in the ENO3 gene
between Chinese indigenous and introduced commercial western pig breeds and that it is
associated with fat percentage, average backfat thickness, meat marbling and intramus-
cular fat in two different populations.
pig / ENO3 / polymorphism
*
Corresponding author:
**
These two authors contributed equally to this work.
Genet. Sel. Evol. 40 (2008) 563–579
Ó INRA, EDP Sciences, 2008
DOI: 10.1051/gse:2008015
Available online at:
www.gse-journal.org
Article published by EDP Sciences
1. INTRODUCTION
Enolase is a glycolytic enzyme (2-phospho-D-glycerate hydrolyase) that catal-
yses the interconversion of 2-phosphoglycerate to phosphoenolpyruvate in the
glycolytic pathway. In higher vertebrates, the active enolase enzyme is a dimer
composed of three different subunits, alpha, beta and gamma, encoded by sepa-
rate genes. The expression of these genes is regulated in a tissue-specific and
development-specific manner: ENO1 (alpha enolase) is expressed in many tissues
while ENO2 (gamma enolase) is expressed only in cells of the nervous system
and ENO3 (beta enolase) is localized to muscle tissue [ 2]. A switch from alpha
enolase to beta enolase occurs in muscle tissue during development in rodents
[14]. During ontogenesis, striated muscle differentiation is accompanied by an
increase in beta-enolase expression and by a decrease in the expression of the
alpha isoform [6,11]. It has been shown that ENO3 is expressed in proliferating
adult myoblasts as well as in differentiated myotubes and that it is one of the ear-
liest markers of myogenic dif ferentiation in man [6]. In adult human muscle, over
90% of the enolase activity is accounted for by the beta-enolase subunit encoded
by the ENO3 gene. Mutations in this gene can be associated with metabolic myo-
pathies that may result from a decreased stability of the enzyme [4].
Feo et al. [5] have mapped ENO3 to human chromosome 17pter-p11 by anal-
ysis of rodent-human somatic cell hybrids and transfectant cell lines carrying dif-
ferent portions of human chromosome 17. In pig, the ENO3 gene has been
assigned to pig chromosome SSC12 [10]. However , data on the characterization
of the porcine ENO3 gene are still scarce. In the present study, we describe the
cDNA cloning and the expression analysis of two transcripts of the porcine
ENO3 gene. In addition, the genomic structure, polymorphism and association
analysis of this gene were studied.
2. MATERIALS AND METHODS
2.1. Isolation of porcine ENO3 gene
Initially, pig ESTs were i dentified using the cDNA sequence of human ENO3
(NM_053013) and mouse Eno3 (NM_007933) by running a BLASTN search
against the GenBank ‘EST-others’ databases. These ESTs were retrieved and
then assembled into one contig. From this contig and the human sequence, prim-
ers (EN-1F, EN-1R) and (EN-2F, EN-2R) were designed using Primer 5.0 soft-
ware (). These p rimers yielded two overlapping
polymerase chain reaction (PCR) products. The purified PCR products were
cloned into the pGEM-T vector (TaKaRa, Dalian, China) and sequenced using
standard M13 primers.
564
J. Wu et al.
The cDNA sequence of pig ENO3 gene was compared with the human and
mouse orthologous mRNAs and their genomic sequences to predict the genomic
organization of the pig gene, which was confirmed by PCR amplification and
sequencing. Four primer pairs were designed to amplify the genomic fragments
including all introns (Tab. I). Three genomic DNA mixture pools from three pig
breeds (Yorkshire, Landrace and Meishan) were used. DNA sequences were
compiled using the DNA star software (Madison, WI, USA). Sequence data
of ENO3 in different pig breeds were compared by BLAST (i.
nlm.nih.gov).
2.2. RACE-PCR and identification of transcripts
To amplify the 5
0
end of the ENO3 gene, cDNA was generated by the
SMART PCR cDNA Synthesis Kit (Clontech, Mountain View, CA, USA) using
as template total RNA isolated from the longissimus dorsi of Yorkshire pig and
the 5
0
- rapid amplification of cDNA ends (RACE) primer complementary to
exon 2 and the SMART II oligonucleotide primer (SMART 5
0
in Ta b. I).
Possible alternative splice donor sites in the 5
0
end were predicted by compar-
ing the genomic DNA sequence of the pig ENO3 gene with its cDNA sequence
and by using information available in man and mouse on the two beta-
enolase mRNA forms. Based on the pig genomic sequence, the primer pair
(EN-3F, EN-3R) was designed to amplify the other transcript from the
cDNA of Yorkshire pigs’ longissimus dorsi. These primers bind to the 5
0
end
of intron 1 and the exon 4-exon 5 region, respectively. The RNA secondary
structures in 5
0
-untranslated regions (UTR) of the two transcripts of the ENO3
gene were predicted using RNA secondary structure prediction s oftware
( />2.3. Analysis of ENO3 expression levels
Total RNA was extracted using TRIzoL reagent (Invitrogen, Carlsbad, CA,
USA) from the longissimus dorsi of Yorkshire pigs at postnatal day-1, day-60
and d ay-120 and Meishan pigs at postnatal day-60, respectively. We used
three animals of each breed and at each stage, which were reared in same condi-
tions and slaughtered at the same slaughterhouse on the same day. RNA samples
were also isolated from other tissues of Yorkshire breed at day-120 i.e. fat, heart,
liver, spleen, kidney, lung, stomach, small intestine and uterus. Reverse transcrip-
tase PCR was carried out using M-MLV Reverse Transcriptase (Promega, USA).
For amplification, two transcript primer pairs (trans-1F, trans-1R and trans-2F,
trans-2R) were designed using cDNA sequences as templates and Primer Express
Characterization of porcine ENO3
565
Table I. Primers used in this study.
Primer name Sequence (5
0
–3
0
) Binding
region
Annealing temperature (°C) Size (bp)
5
0
-RACE GCAGGTCCACCTCCACTGT Exon 2 59 155
SMART 5
0
GCAGTGGTATCAACGCAGAGTACGC
EN-1F AGCTGCCACCTCTACTCC Exon 1 55 218
EN-1R CCAGGTAGCGAGATTTGTC Exon 3
EN-2F CTTCCACGGGTATCTATGA Exon 3 55 1269
EN-2R GTTGGCACCAGTGTTTATT Exon 12
EN-3F CTGATGACTCTTCCAGCCTC Intron 1 58 295
EN-3R ACACTTAGTTTCTTTTCCAGCA Exon 4 ~ exon 5
trans-1F GTTGGAGCAAGCAGGACG 142 bp insert sequence 60 201
trans-1R TGCCCAGGTAGCGAGATT Exon 3
trans-2F GCGAAGACATCCCAGCCAT Exon 1 ~ exon 2 60 194
trans-2R GCCCAGGTAGCGAGATTTG Exon 3
GAPDH-F GAAGGTCGGAGTGAACGGAT Exon 2 60 251
GAPDH-R CTCATTTGATGTTGGCGGG Exon 4
Genomic 1-2F AGCTGCCACCTCTACTCC Exon 1 55 1191
Genomic 1-2R GTCCCGTCCTCTTTCCTA Intron 3
Genomic 3-6F CCGATTCCGAGCTGCTGT Exon 3 62 2438
Genomic 3-6R CATTGGTGGCGTCCTTCC Exon 7
Genomic 7-8F ATCAAGGGCAAATACGGG Exon 7 54 820
Genomic 7-8R GAGGTCCAGGTCTTCCAGT Exon 9
Genomic 8-11F GGCATCTGAGTTCTACCGC Exon 8 55 1702
Genomic 8-11R GGCACCAGTGTTTATTTCG Exon 12
SNP-F AGATTCTGCTTCGTCCCA Intron 9 55 687
SNP-R GGCTTCCACCTTCTCACT Exon 12
566 J. Wu et al.
software (Tab. I). Quantitative PCRs were performed in 25 lL volumes contain-
ing 12.5 lLof2 · SYBR Green Real-time PCR Master Mix (TOYOBO, Japan),
1 lL cDNA and 0.3 lM (final concentration) of each primer . PCR was run in the
Applied Biosystems 7500 Real-Time PCR System. Fluorescent signals were con-
tinually monitored at the end of each P CR cycle consisting of 1 min at 95 °Cfor
the initial denaturing step, 15 s at 95 °C, 15 s at 60 °C and 45 s at 72 °C for a total
of 40 cycles. The relative expression levels of the gene were analysed using the
Comparative Ct method, in which glyceraldehyde-3-phosphate-dehydrogenase
(GAPDH) was used as an internal control, to correct for the differences in
the mRNA quantities. For amplification of GAPDH, a specific primer pair
(GAPDH-F and GAPDH-R, see Tab. I) was used producing a 251 bp fragment
under the same PCR conditions as above. t-test was performed to conclude on
the significance of the observed dif ferences.
2.4. Detection of polymorphisms and association analysis
Based on the BLAST results of intron 9 sequences in Yorkshire, Landrace
and Meishan, primer pair (SNP-F, SNP-R) was used to detect PCR-StuI- restric-
tion fragment length polymorphism (RFLP). PCR was performed in 20 lL reac-
tion mix containing: 25 ng of genomic DNA pool, 150 lM dNTP, 0.25 lmol of
each PCR primer, 1 U Taq DNA polymerase supplied by the manufacturer.
PCRs were run as follows: an initial step at 94 °C for 4 min, 35 cycles at
94 °C for 40 s, 55 °C for 40 s, 72 °C for 40 s and a final extension step at
72 °C for 10 min. For the PCR-RFLP assays, 7.5 lL of PCR products was
digested with 5 U StuI (TaKaRa) in 1 X digestion buf fer with 1 X BSA added
in a total volume of 10 lL. Following the digestion at 37 °C for 4 h, the prod-
ucts were separated by electrophoresis on a 1.5% agarose gel in 1 X TAE buffer
and stained with 0.5 lgÆmL
À1
ethidium bromide.
Allele frequencies were determined in eight different populations. T he StuI
PCR-RFLP was genotyped in 132 pigs (34 Yorkshire pigs, 37 Landrace pigs,
35 Landrace · Yorkshire and 26 Yorkshire · Landrace pigs) [18] and 140 F
2
pigs
of a Yorkshire · Meishan reference family [17]. The association between geno-
type and p roduction traits was performed with the least square method (GLM pro-
cedure, SAS
Ò
version8.0).Themodelusedtoanalysethedatawasassumedtobe:
Y
ijk
¼ l þ G
i
þ S
j
þ B
k
þ b
ijk
X
ijk
þ e
ijk
½18
Y
ijk
¼ l þ G
i
þ S
j
þ F
k
þ b
ijk
X
ijk
þ e
ijk
½16
where Y
ijk
is the observation of the trait; l is the least square mean; G
i
is the
effect of ith genotype; S
j
is the effect of jth sex (j = 1 for male or 2 for female);
Characterization of porcine ENO3
567
B
k
is the effect of kth breed; F
k
is the effect of kth family; b
ijk
is the regression
coefficient of the slaughter weight and e
ijk
is the random residual.
3. RESULTS AND DISCUSSION
3.1. Two mRNA forms for the porcine ENO3 gene
Primer pairs (EN1F, EN1R) and (EN2F, EN2R) amplified two fragments
218 bp and 1269 bp long, respectively, which resulted in a consensus sequence
of 1426 bp corresponding to pig ENO3 coding sequence (GenBank Accession
No. DQ355513). Using RACE-PCR, we obtained a 155 bp fragment containing
all of exon 1 and part of exon 2. The sequence comparison of this 155 bp frag-
ment with the 1426 bp ENO3 coding sequence produced a full-length consensus
sequence of 1437 bp (GenBank Accession No. EU418440), which shares the
highest sequence identity with variant 2 of human ENO3 transcript that lacks
exon 1 as compared to variant 1. Aligning pig ENO3 cDNA and genomic
sequences with the human ENO3 sequence revealed a possible splice donor site
in the 3
0
end of exon 1. Primer pair (EN-3F, EN-3R) amplifies a 393 bp cDNA
fragment containing 140 bp of intron 1, exon 2, exon 3, exon 4 and part of
exon 5. Thus, two forms of pig ENO3 mRNA exist that differ by the presence
or absence of a 142-nucleotide fragment in the 3
0
end of exon 1. Based on the
sequence of the human ENO3 [7], porcine ENO3 transcript 1 containing the
142-nucleotide insert is the long form of ENO3 mRNA i.e. 1579 bp (GenBank
Accession No. EU418439) while transcript 2 corresponds to the short form of
ENO3 mRNA i.e. 1437 bp (GenBank Accession No. E U418440). Aligning this
pig sequence w ith the human ENO3 and mouse Eno3 cDNA sequences revealed
a 54 bp or 196 bp of 5
0
-untranslated sequence, 1305 bp of coding sequence
and78bpof3
0
-untranslated sequence. The sequence ‘‘AATAAA’’ indicating
a putative polyadenylation signal was found in the 78 bp fragment o f the
3
0
end sequence. The coding region of the porcine ENO3 as determined by
alignments shares 90 and 85% identity with human and mouse cDNAs, respec-
tively. The deduced protein contains 434 amino acids showing 97% sequence
similarity with the human and mouse proteins.
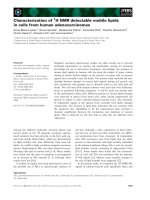
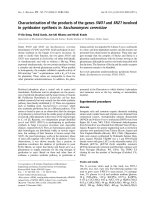
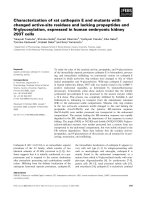
Computer-generated predictions of the most stable leader secondary struc-
ture of the two splice forms are illustrat ed in Figure 1. Introduction of the
142-nucleotide fragment (transcript 1) produced a markedly altered folding pat-
tern, leading to the formation of a very stable stem-loop structure with a p re-
dicted free energy = À42.7 kcalÆmol
À1
. In contrast, the potential structure of
the short transcript 2 had a predicted free energy = À4.8 kcalÆmol
À1
,represent-
ing a significantly less stable secondary structure.
568
J. Wu et al.
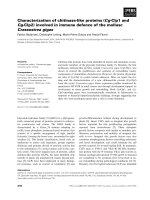
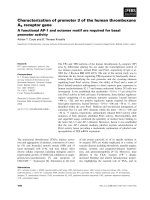
3.2. Differential expression of the two transcripts
Spatial e xpression analysis of ENO3 showed that the expression level of tran-
script 1 in muscle, fat, heart, small intestine, stomach and uterus is e xtremely
weak and slightly higher in liver, l ung and kidney (Fig. 2A). T he level of tran-
script 1 mRNA is undetectable in spleen (Fig. 2A). Real-time PCR revealed that
Figure 1. Predicted secondary structure of the 5
0
-UTR of ENO3 mRNA. The
software predicted the most stable stem-loop structure in the 5
0
-UTR of both
transcripts with the smallest free energy method. Overall free energy of form ation
values is À42.7 kcalÆmol
À1
and À4.8 kcalÆmol
À1
for the long (transcript 1) and the
short (transcript 2) splice forms, respectively.
Characterization of porcine ENO3
569
the expression level of transcript 2 was high in skeletal muscle and heart, with
medium levels in fat, lung and stomach, with low levels in liver , spleen, kidney,
small intestine and uterus (Fig. 2B). Compared to that of transcript 2, the expres-
sion level of transcript 1 is very low in all tissues, with the exception of liver and
kidney (Fig. 2B).
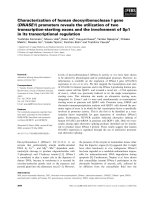
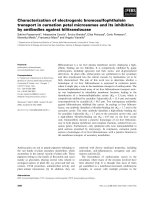
Expression of ENO3 transcript 1 m RNA showed no variation during the three
stages of skeletal muscle development in Yorkshire pigs, while expression of tran-
script 2 was highest in skeletal muscle at postnatal day-1 and lower at day-60 but
was upregulated wi th age (Fig. 3). Compared with that of transcript 2, the expres-
sion level of transcript 1 is very low in skeletal muscle (Fig. 3). An expression
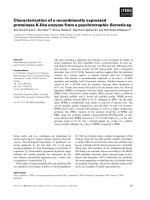
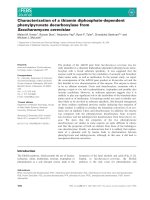
pattern was also analysed in the skeletal muscle of both Western Yorkshire and
Chinese Meishan pigs at day-60. The t wo transcripts were dif ferentially
expressed in the skeletal muscle between Yorkshire and Meishan (Fig. 4). More-
over , the transcript level of pig ENO3 transcript 1 was very low in all the samples
of skeletal muscle. The expression level of transcript 2 was higher in the skeletal
muscle of Yorkshire than that of Meishan but the expression of transcript 1
showed no difference between both breeds (Fig. 4).
3.3. Genomic structure of the ENO3 gene
The resulting overlapping PCR products were assembled into a single contig
revealing the complete sequence of pig ENO3 gene (GenBank Accession
No. DQ676935). A 5376 bp genomic DNA sequence covering the entire coding
region of the porcine ENO3 gene was amplified using four gene-specific primer
pairs (Tab. I) and compared with the cDNA sequence to clarify the exon/intron
organization. The porcine ENO3 gene is composed of 12 exons and 11 introns
(Fig. 5) with the first intron interrupting the 5
0
-untranslated sequence, just 2 bp
upstream of the initiation methionine codon. All splice donor and acceptor sites
conform to the typical 5
0
GT-AG 3
0
rule, with the exception of the donor site of
intron 4, which is GC instead of GT. Sizes of ENO3 exons vary between 5 2
and 223 bp and sizes of the introns vary between 82 and 1155 bp in size
(Tab. II). This sequence will be useful to search for SNPs and for association
analyses.
3.4. Detection of the ENO3 polymorphism and association analysis
By comparing the sequence from these different pig breeds, we detected sev-
eral SNPs and a T deletion mutation (g.404delT) at position 404 in intron 9 that
spans a StuI restriction site. Primer pair 4 amplifies a 687 bp fragment contain-
ing part of intron 9, exon 10, intron 10, exon 11, intron 11 and part of exon 12
570
J. Wu et al.
and was scanned for polymorphism. The 687 bp (allele A) PCR product was
digested into two fragments of 169 bp and 518 bp, respectively, the latter cor-
responding to allele B. Allele frequencies for the ENO3 StuI PCR-RFLP were
studied in a sample of 244 unrelated pigs, belonging to eight different popula-
tions (Tab. III). The allele distribution revealed that in Chinese indigenous
A
B
Figure 2. Spatial expression profiles of the two porcine ENO3 transcripts.
(A) Expression of ENO3 transcript 1 in different tissues. (B) Relative expression
levels of both transcripts. Real-time PCR analysed the expression of ENO3 in
different tissues of an adult Yorkshire pig. The relative expression levels of ENO3
mRNA were analysed using the Comparative Ct method, with GAPDH as the
reference gene in each sample. The difference in the levels of expression was
significant (P < 0.05) by t-test analysis.
Characterization of porcine ENO3
571
breeds, with the exception of the Bamei pigs, allele A was more frequent than in
western pig breeds i.e. genotype BB was prevalent in Landrace and Duroc but
not in Yorkshire pigs in which allele A was prevalent.
The results of the association analysis between ENO3 genotypes and product
traits in t wo d if ferent populations are given in Table IV. S tatistically significant
associations with fat percentage, average backfat thickness, meat marbling and
intramuscular fat were found in 140 F
2
Yorkshire · Meishan pigs. In the other
population of 132 pigs composed of 34 Yorkshire pigs, 37 Landrace pigs,
35 Landrace · Yorkshire and 26 Yorkshire · Landrace pigs, significant associ-
ations with fat percentage, meat marbling and intramuscular fat were also found.
No significant conclusion could be drawn for other carcass traits and meat qual-
ity trai ts. Pigs with the AA genotype tended to have more desirable characteris-
tics. Allele A was associated with an increase in meat marbling, intramuscular fat
and decrease of fat percentage in the two populations.
4. DISCUSSION
In the present study, we report the isolation of pig ENO3 gene and its struc-
tural features. The deduced polypeptide shows a high degree of homology with
1 day
60 da
y
120 day
Figure 3. Temporal expression profiles of the two porcine ENO3 transcripts. Relative
levels of ENO3 mRNA were calculated using the Comparative Ct method with
GAPDH as the reference gene in each sample. Bars represent the mean ± SE (n = 3).
1 day, 60 day and 120 day indicate three stages of skeletal muscle development in
Yorkshire pigs, postnatal day-1, day-60 and day-120, respectively. For transcript 1,
the differences in expression level for the three stages examined were not significant
(P > 0.05).
572 J. Wu et al.
that of other species. As in man and rat [13,15], porcine ENO3 gene spans a
region of about 6 kb and contains 12 exons. All intron/exon splice donor and
acceptor sites conform to the human ENO3 gene. In man, two mRNA forms
exist that differ from one another by the presence or absence of a 42 bp fragment
due to differential splicing in the leader sequence [7]. This mechanism of alter-
native splicing, generating two mRNA forms, is also conserved in mouse [12],
in which a 110 bp sequence is inserted in the 5
0
-UTR of the Eno3 gene
Figure 4. Differential expression analysis of the two porcine ENO3 transcripts in
different pig breeds. Real-time PCR analysis of both transcripts in the skeletal muscle
of Yorkshire and Meishan pigs at day-60. Relative levels of ENO3 mRNA were
calculated using the Comparative Ct method with GAPDH as the reference gene in
each sample. Bars represent the mean ± SE (n = 3). The differences in the expression
levels of transcript 2 between both pig breeds and between both transcripts in each
breed were significant (P < 0.05) by t-test analysis.
AT G
TGA
SNP
Figure 5. Schematic diagram of the genomic organization of pig ENO3 gene. Boxes
correspond to the 12 exons and horizontal lines correspond to the 11 introns. The
hatched box in the untranslated exon 1 represents the 142-nucleotide insert present in
the long form of ENO3 mRNA (transcript 1).
Characterization of porcine ENO3
573
Table II. Genomic structure of the porcine ENO3 gene.
Exon Sequence (5
0
–3
0
) Intron Sequence
I (52/194 bp) CATCCCAGgtctga/GGACGGAGgtactc 1 (612/470 bp) cctcttgccctgcagCC
ATG GCC
II (87 bp) GGCCAAGGgtaact 2 (270 bp) ttcctcccaccccagGCCGATTC
III (96 bp) GGGCAAAGgtgaga 3 (168 bp) cttcggcctctctagGGGTCCTG
IV (59 bp) TGGAAAAGgcaagt 4 (185 bp) aacctgcccttccagAAACTAAG
V (70 bp) AAATAAGTgtgagt 5 (397 bp) acttgcttcctccagCCAAGTTT
VI (134 bp) CCGTCCCTgtgagt 6 (1155 bp) gtctccccttctcagGCCTTCAA
VII (223 bp) CAATGAAGgtcagt 7 (91 bp) cttgccccctcccagCCCTGGAG
VIII (198 bp) CTATCCTGgtgagc 8 (397 bp) gccccttcccaccagTGGTCTCC
IX (202 bp) ATCCAGGCgtgagt 9 (426 bp) gtcctctccccccagCTGCAAAC
X (109 bp) CGGGACAGgtacgc 10 (159 bp) cttttccctcctcagATCAAGAC
XI (59 bp) CTCATGAGgtacag 11 (82 bp) gactttgctttccagGATTGAGG
XII (148 bp) CCAAG
TGA GAAGGTGGAAGCCCCTGGAGCCCGCAGGGCAGATCTGGGCCTTCAAGCCCTTCCCCCGA
AATAAA
CACTGGTGCCAAC
Uppercase letters correspond to exon sequences and lowercase letters to intron sequences. Exon and intron sizes are indicated in brackets. Putative
3
0
-mRNA processing signals are underlined. The initiation codon ATG and stop codon TGA are inserted in a box.
574 J. Wu et al.
(GenBank Accession No. X70182). As in man and mouse, two beta-enolase
transcripts with distinct sequences in their 5
0
-UTR are present in pig muscle with
a 142 bp insert in the long form of pig beta enolase mRNA.
As an early marker of human myogenesis [6], ENO3 is responsible for over
90% of the enolase activity in adult human muscle and plays an important role
in muscle diseases [4]. In our study, we used the real-time PCR technique to
examine the tissue expression of both ENO3 transcripts and expression changes
of these mRNAs during three important stages of skeletal muscle development
in dif f erent pig breeds. This technique is useful to identify some functions of
ENO3 during muscle development. A previous analysis of the relative expres-
sion of both spliced forms in developing and adult m uscle did not show any
stage-specific or tissue-specific pattern [12]. Our findings demonstrate that the
expression of pig ENO3 transcript 2 is high in adult skeletal muscle and heart.
The two spliced forms are expressed during the three postnatal stages of skeletal
muscle development in Yorkshire pigs and the highest levels are observed
in skeletal muscle at postnatal 1 day. In m ouse, [1] have shown that the level
of beta enolase i s increased in newborn and adult muscle, and [8]and[9]have
reported that it is also increased during foetal muscle development and during
terminal differentiation of myoblasts, respectively. Hence, it is possible that beta
enolase plays important roles during skeletal muscle development, including
muscle differentiation. In addition, transcript 2 is relatively more abundant in
skeletal muscle tissue and has a higher expression level in Western Yorkshire
than in Chinese Meishan pigs. Thus, we propose that the ENO3 transcript 2
might play an important and different role in different breeds in terms of tran-
script level during muscle development.
As shown, the alternative splice site of the dif ferent transcripts is in the 3
0
end
of exon 1. However, only one product is obtained after amplification with primer
Table III. Genotype and allele frequencies of pig ENO3 gene in eight pig breeds.
Breeds Number Genotype Allele frequencies
AA AB BB A B
Yorkshire 38 20 15 3 0.724 0.276
Landrace 39 3 22 14 0.359 0.641
Duroc 22 0 3 19 0.068 0.932
Meishan 42 25 15 2 0.774 0.226
Huainan 15 7 8 0 0.733 0.267
Qingping 45 26 19 0 0.789 0.211
Erhualian 31 28 3 0 0.952 0.048
Bamei 12 3 6 3 0.500 0.500
Characterization of porcine ENO3
575
Table IV. Association analysis of the ENO3 polymorphism.
Population Genotype Number Fat (%) Average
backfat
thickness (cm)
Marbling of
m. longissimus
dorsi
Marbling of
m. biceps femoris
Intramuscular
fat (%)
132 pigs = 34 Yorkshire
37 Landrace
35 Landrace · Yorkshire
26 Yorkshire · Landrace
AA 29 11.555 ± 0.438
ab
1.761 ± 0.134 2.853 ± 0.060
a
3.778 ± 0.078
a
1.968 ± 0.055
A
AB 59 11.379 ± 0.315
a
1.646 ± 0.046 2.714 ± 0.042
ab
3.609 ± 0.054
ab
1.840 ± 0.038
A
BB 44 12.388 ± 0.357
b
1.754 ± 0.440 2.686 ± 0.047
b
3.554 ± 0.061
b
1.680 ± 0.043
B
140 F
2
Yorkshire ·
Meishan offspring
AA 63 18.173 ± 0.566
a
2.172 ± 0.062
a
3.291 ± 0.024
a
4.214 ± 0.022
A
2.643 ± 0.075
A
AB 59 19.701 ± 0.630
ab
2.213 ± 0.069
ab
3.231 ± 0.027
ab
4.096 ± 0.024
B
2.226 ± 0.083
B
BB 18 20.985 ± 1.218
b
2.459 ± 0.133
b
3.146 ± 0.052
b
4.064 ± 0.046
B
1.917 ± 0.161
B
Different letters indicate significantly different least square mean values, small letters (a/b) indicate P < 0.05 and capital letters (A/B) indicate
P < 0.01.
576 J. Wu et al.
pair (EN1F, EN1R) and 5
0
-RACE primers and it contains the 3
0
end of exon 1
and shares similar structural features with those of human ENO3 transcript var-
iant 2. It is possible that the short form of mRNA has a high expression and the
long form of mRNA possesses a specific structure leading to low expression.
Furthermore, real-time P CR experiments revealed that the expression level of
pig ENO3 transcript 1 is very low in skeletal muscle and all other tissue samples.
Alternative splicing within the 5
0
-UTR is usually linked to alternative promoter
usage. However , multiple beta-enolase mRNA forms arise from the same pro-
moter , suggesting the possibility that regulated splicing may further control gene
expression [7]. Variation in mRNA stability may result in different transcript lev-
els [3]. Predictions of secondary structures indicate that the two transcripts of pig
ENO3 gene could form different secondary structures. A more stable secondary
structure may exist in the 5
0
end of trans cript 1 than in transcript 2 resulting in a
low expression of transcript 1. In addition, it has been shown i n man that tran-
scripts containing the long and s hort leader sequences showed differences in the
translational rate, suggesting a role for the ENO3 5
0
-UTR in the regulation of
translation [12]. Thus, the 5
0
-untranslated sequences of pig ENO3 transcripts
may regulate expression of both transcripts.
In this study, we have detected a new SNP (g.404delT) and carried out asso-
ciation studies. Allele frequencies are clearly different in Chinese indigenous
breeds and in introduced commercial western breeds. Results of the association
analysis with product traits in two different populations are nearly consistent.
The polymorphism may be associated with variation in several carcass traits
and meat quality traits of interest for pig breeding. Thus, we suggest that
ENO3 might affect not only skeletal muscle growth during m uscle development
but also meat flavour and carcass quality. However, the number of animals ana-
lysed here is limited, which may affect the observed results. Further investiga-
tions in other pig populations are required to confirm the association study. In
summary, our study shows that the porcine ENO3 gene may be an important
candidate gene for meat quality and carcass traits in animal breeding and could
be involved in muscle developmental mechanisms. These considerations are
important for applications in animal breeding and provide a foundation for future
research on the ENO3 gene.
ACKNOWLEDGEMENTS
We thank teachers and graduate students at Key Laboratory of Swine Genet-
ics and Breeding, Ministry of Agriculture for managing and slaughtering
research pig flocks. This study was supported financially by National High
Characterization of porcine ENO3
577
Technology Development project (‘863’ project: 2003AA243030) and the
National Natural Science Foundation of China (Project No: 30700588).
REFERENCES
[1] Barbieri G., De Angelis L., Feo S., Cossu G., Giallongo A., Differential
expression of muscle-specific enolase in embryonic and fetal myogenic cells
during mouse development, Differentiation 45 (1990) 179–184.
[2] Chen S.H., Giblett E.R., Enolase human tissue distribution and evidence for
three different loci, Ann. Hum. Genet. 39 (1976) 277–280.
[3] Cleveland D.W., Gene regulation through messenger RNA stability, Curr. Opin.
Cell Biol. 1 (1989) 1148–1153.
[4] Comi G.P., Fortunato F., Lucchiari S., Bordoni A., Prelle A., Jann S., Keller A.,
Ciscato P., Galbiati S., Chiveri L., Torrente Y., Scarlato G., Bresolin N., Beta-
enolase deficiency, a new metabolic myopa thy of distal glycolysis, Ann. Neurol.
50 (2001) 202–207.
[5] Feo S., Antona V., Barbieri G., Passantino R., Cali L., Giallongo A.,
Transcription of the human beta enolase gene (ENO-3) is regulated by an
intronic muscle-specific enhancer that binds myocyte-specific enhancer factor 2
proteins and ubiquitous G-rich-box binding factors, Mol. Cell. Biol. 15 (1995)
5991–6002.
[6] Fougerousse F., Edom-Vovard F., Merkulova T., Ott M.O., Durand M., Butler-
Browne G., Keller A., The muscle-specific enolase is an early marker of human
myogenesis, J. Muscle Res. Cell Motil. 22 (2001) 535–544.
[7] Giallongo A., Venturella S., Oliva D., Barvieri G., Rubino P., Feo S., Structure
features of the human gene for muscle-specific enolase. Differential splicing in
the 5
0
-untranslated sequence generates two forms of mRNA, Eur. J. Biochem.
214 (1993) 367–374.
[8] Keller A., Ott M.O., Lamande N., Lucas M., Gros F., Buckingham M., Lazar M.,
Activation of the gene encoding the glycolytic enzyme b enolase during early
myogenesis precedes an increased expression during fetal muscle development,
Mech. Dev. 38 (1992) 41–54.
[9] Lamande´ N., Brosset S., Lucas M., Keller A., Rouzeau J.D., Johnson T.R., Gros
F., Ilan J., Lazar M., Transcriptional up-regulation of the mouse gene for the
muscle-specific subunit of enolase during terminal differentiation of myogenic
cells, Mol. Reprod. Dev. 41 (1995) 306–313.
[10] Larkin D.M., Kuznetsov S.B., Astakhova N.M ., Zhdanova N.S., Use of PCR
markers for mapping swine chromosome 12, Genetika 37 (2001) 358–364.
[11] Lucas M., Goblet C., Keller A., Lamande´ N., Gros F., Whalen R.G., Lazar M.,
Modulation of embryonic and muscle-specific enolase gene products in the
developing mouse hindlimb, Differentiation 51 (1992) 1–7.
[12] Oliva D., Venturella S., Passantino R., Feo S., Giallongo A., Conserved
alternative splicing in the 5
0
-untranslated region of the muscle-specific enolase
578 J. Wu et al.
gene. Primary structure of mRNAs, expression and influence of secondary
structure on the translation efficiency, Eur. J. Biochem. 232 (1995) 141–149.
[13] Peshavaria M., Day I., Molecular structure of the human muscle-specific
enolase, Biochem J. 275 (1991) 427–433.
[14] Peterson C.A., Cho M., Rastinejad F., Blau H.M., Beta-enolase is a marker of
human myoblast heterogeneity prior to differentiation, Dev. Biol. 151 (1992)
626–629.
[15] Sakimura K., Kushiya E., Ohshima-Ichimura Y., Mitsui H., Takahashi Y.,
Structure and expression of rat muscle-specific enolase gene, FEBS Lett. 277
(1990) 78–82.
[16] Wu J., Deng C.Y., Xiong Y.Z., Zhou D.H., Lei M.G., Zuo B., Li F.E., Wang J.,
cDNA cloning and polymorphism of the porcine carbonic anhydrase III (CA3)
gene, Asian-Aust. J. Anim. Sci. 19 (2006) 324–328.
[17] Zuo B., Xiong Y.Z., Su Y.H., Deng C.Y., Zheng R., Jiang S.W., Mapping
quantitative trait loci for meat quality on pig chromosome 3, 4 and 7, Asian-
Aust. J. Anim. Sci. 16 (2003) 320–324.
[18] Zuo B., Xiong Y.Z., Deng C.Y., Su Y.H., Wang J., Lei M.G., Li F.E., Jiang S.W.,
Zheng R., cDNA cloning, genomic structure and polymorphism of the porcine
FHL3 gene, Anim. Genet. 35 (2004) 220–233.
Characterization of porcine ENO3
579