Báo cáo sinh học: " Evolution of the polymorphism at molecular markers in QTL and non-QTL regions in selected chicken lines (Open Access publication)" ppsx
Bạn đang xem bản rút gọn của tài liệu. Xem và tải ngay bản đầy đủ của tài liệu tại đây (470.48 KB, 23 trang )
Original article
Evolution of the polymorphism at molecular
markers in QTL and non-QTL regions
in selected chicken lines
(Open Access publication)
Vale´rie LOYWYCK
1
*, Bertrand BED’HOM
1
,
Marie-He´le`ne P
INARD-VAN DER LAAN
1
, Fre´de´rique PITEL
2
,
E
´
tienne V
ERRIER
1
, Piter BIJMA
3
1
Ge´ne´tique et Diversite´ Animales UMR1236, INRA/AgroParisTech,
78352 Jouy-en-Josas, France
2
Ge´ne´tique Cellulaire UR444, INRA, 31326 Castanet-Tolosan, France
3
Animal Breeding and Genomics Group, Wageningen University, 6700 AH Wageningen,
The Netherlands
(Received 22 October 2007; accepted 18 June 2008)
Abstract – We investigated the joint evolution of neutral and selected genomic regions in
three chicken lines selected for immune response and in one control line. We compared the
evolution of polymorphism of 21 supposedly neutral microsatellite markers versus
30 microsatellite markers located in seven quantitative trait loci (QTL) regions. Divergence
of lines was observed by factor analysis. Five supposedly neutral markers and 12 markers in
the QTL regions showed F
st
values greater than 0.15. However, the non-significant difference
(P > 0.05) between matrices of genetic distances based on genotypes at supposedly neutral
markers on the one hand, and at markers in QTL regions, on the other hand, showed that
none of the markers in the QTL regions were influenced by selection. A supposedly neutral
marker and a marker located in the QTL region on chromosome 14 showed temporal
variations in allele frequencies that could not be explained by drift only. Finally, to confirm
that markers located in QTL regions on chromosomes 1, 7 and 14 were under the influence of
selection, simulations were performed using haplotype dropping along the existing pedigree.
In the zone located on chromosome 14, the simulation results confirmed that selection had an
effect on the evolution of polymorphism of markers within the zone.
selection / quantitative trait loci / hitchhiking / chicken / genetic diversity
1. INTRODUCTION
There is c urrently a large interest in characterising variation patterns in order
to identify regions of the genome that are under selection. For that purpose,
*
Corresponding author:
Genet. Sel. Evol. 40 (2008) 639–661
Ó INRA, EDP Sciences, 2008
DOI: 10.1051/gse:2008025
Available online at:
www.gse-journal.org
Article published by EDP Sciences
scans using microsatellites distributed ove r a genome [32,35] or concentrated
around candidate genes under artificial or natural selection [2,28,43]arecom-
monly performed to investigate signatures of selection. These studies highlight
and compare among natural populations, differences in patterns of heterozygos-
ity or linkage disequilibrium, but they only give a picture of variability at a cer-
tain time, with predictions of the evolution of polymorphism estimated mainly
through simulations. Well-known p edigree experimental selected lines can be
used to explore the evolution of polymorphism over several generations, leading
to the introduction of a time component that helps to distinguish the influence of
selection from the influence of drift.
Here, we investigate the joint evolution ofneutral and selected genomic regions,
using observations on microsatellite markers in a number of selected chicken lines.
For this purpose, we compared the evolution of marker allele frequencies observed
in supposedly neutral versus selected regions of the genome. Selected regions were
chosen based on quantitative trait l oci (QTL) detected in previous studies. A n
important aim w as to determine which methods are s uitable for identifying signa-
tures of selection, and to compare those methods using a real dataset.
2. MATERIAL AND METHODS
2.1. Selection design
We used four experimental chicken lines bred since 1994 in the INRA exper-
imental unit ‘‘Unite´ expe´rimentale de Ge´ne´tique factorielle avicole’’ (Nouzilly,
France) and d erived from an unselected base population of White Leghorn
chickens [31] for which 42 founder animals of two lines (9 sires of a commercial
line and 33 dams of an experimental line) were r andomly mated (generation G2).
The F2 population has become the base population, also named generation 0
(G0). Animals from G0 were randomly chosen to create the four lines, thus the
parents of one line cannot be parents of a nother line.
Three of these lines were selected for high values according to three dif ferent
criteria of immune response: antibody response three weeks after vaccination
against t he Newcastle disease virus (line 1, trait ND3), cell-mediated immune
response at nine weeks of age (line 2, trait PHA) and phagocytic activity at
12 weeks of age (line 3, trait CC). The three lines have under gone mass selection
with a restriction on the contribution of the different families (sizes of the differ-
ent half-sib families were approximately balanced). The fourth line was the con-
trol line, in which the parents were chosen at random.
W ithin each line and at each generation (one generation per year), 15 males
and 30 females out of about 100 candidates of each sex were c hosen as parents
640
V. Loywyck et al.
for the next generation. Mating was at random, except that full- and half-sib
mating was avoided. This selection programme was conducted for 11 discrete
generations (G1 to G11). All animals of the four lines were m easured for the
three traits. The pedigree was completely known.
Estimated heritabilities were 0.33, 0.12 and 0.24 for the traits ND3, PHA and
CC, respectively, using pedigree and phenotypic data up to generation 9 [22]. For
other detailed results on this experiment, including genetic gains, various criteria
of genetic variabi lity and evolution of the polymorphism at a single candidate
gene, namely the Major Histocompatibility Complex (MHC) gene, see [21,22].
2.2. Genotyping
In order to compare the evolution of polymorphism of supposedly neutral
areas and selected areas, we decided to compare the evolution of microsatellites
from t he Aviandiv p anel (European project on the analysis of diversity in the
chicken) and the evolution of microsatellites located within QTL r egions,
previously detected in independent studies on other lines.
2.2.1. Sampling of animals to be genotyped
Due to financial constraints, it was not possible to genotype animals in each gen-
eration. From G2, 37 founders out of 42 were genotyped because blood samples
from five founders were either missing or improper for DNA extraction. To recon-
struct the fi ve missing genotypes, and to d etermine the phase of haplotypes in QTL
regions, 55 animals from generation G1 were genotyped. Fifty animals of each line
from G1 1 randomly chosen within half-sib families were genotyped.
2.2.2. Markers
The supposedly neutral markers are a set of di-nucleotide microsatellite mark-
ers used in a project on the b iodiversity o f chickens funded by t he European
Commission, namely known as the Av iandiv project [15]. These a re distributed
as uniformly as possible throughout the c hicken genome. The position of the
markers is given in Appendix 1 (published in electronic form only).
QTL regions affecting the immune response were primo-detected in two other
experimental lines bred on the experimental unit of the Animal breeding
and Genomics Group at the Wageningen University and Research Center
(The Netherlands) [36–38]. The fi rst population w as an F2 originating from a
cross of divergently selected lines for high and low antibody response to sheep
red blood cells [42]. The second population was an F2 originating from a cross
between two commercial lines [3]. Among the different regions detected, we
chose six genome-wide significant QTL regions for different antibody titre traits.
Signature of selection in chicken
641
The presence of these QTL was not checked in our experimental lines due to
financial constraints, which limited the number of genotyped animals. The
MHC region (chromosome 16 – zone 7) was added to the analysis, s ince the
MHC gene is a good candidate gene for immune response [22].
The distance between markers was defined according t o estimations of allele
frequency changes of markers under selection in mouse lines [18] and estimation
of the extent of linkage disequilibrium in domestic sheep [23], since such esti-
mations have not been conducted in chicken. The position of the markers is
given in Table I. Genetic distances of existing markers were those defined b y
the consensus m ap [12] and genetic distances of the new markers were estimated
from the consensus map and their position on the chicken genome sequence.
The genetic position of the three markers within zone 7 (MHC region) was
found to be the same (~ 0 cM) on the consensus map: in order to run simula-
tions, positions were arbitrarily set to 0.00, 0.05 and 0.10 cM in the strict case
of this study.
Fluorescently labelled microsatellite markers were analysed on an ABI 3100
DNA sequencer (Applied Biosystems, Foster City, CA, USA) and genotypes
were determined using GeneScan Analysis 3.7 and Genotyper A nalysis 3.7 soft-
ware (Applied Biosystems, Foster City, CA, USA). The GEMMA database was
used to manage the informativity tests [ 16]. A recent analysis (Bed’Hom –
unpublished results) of the ma rkers located in the MHC region (zone 7) revealed
the presence of a null allele for MCW370 . The null allele was named AAA and
genotypes were rebuilt according to specific associations of marker alleles w ithin
the zone. Appendices 2 and 3 summarise the observed allele frequencies in G2
and G1 1 (Appendices 2 and 3 are available in electronic form only).
2.3. Measures of line divergence
2.3.1. Factor analysis
In order to get an overview of the distinction among generations and a mong
lines, we performed a multiple-dimension principal component analysis (PCA)
on all individuals, from generations G2, G1 a nd G11. First, PCA was based on
genotypes at all markers. Second, in order to assess the influence of the different
types of markers, PCAwas based, on genotypes at the supposedly neutral markers,
on the one hand and on genotypes at markers in QTL regions, on the other hand.
2.3.2. Genetic variability criteria
In order to quantify genetic differences between the lines, we calculated stan-
dard descriptors of the genetic variability for each locus in G2 and in G11 w ithin
642
V. Loywyck et al.
each line: observed heterozygosity H
0
and unbiased expected genetic diversity
H
exp
[29]. Departures from Hardy-Weinberg equilibrium were estimated by
calculating Wright’s F
is
and F
st
according to Weir and Cokerham [45]. The null
hypothesis (F
is
= 0) was tested by bootstrapping over alleles within samples.
Table I. Position of markers in the QTL zones and the trait they are related to.
Zone Marker Chromosome Position Trait of QTL
(Ab titre to )
Genetic
(cM)
Physical
(bp)
1 MCW183 7 86 23 417 076 SRBC
ADL279 92 24 462 410
ADL111 98 25 777 047
MCW236 109 28 822 966
2 ADL118 14 0 2 265 471 KLH
&
M. butyricum
MCW296 5 3 665 129
SEQALL0454 10 4 774 810
SEQALL0455 14 5 695 404
SEQALL0453 18 6 830 872
3 LEI146 1 169 49 939 300 LPS
ADL0359 172 52 275 623
SEQALL0426 191 57 481 907
SEQALL0427 192 57 730 587
SEQALL0428 195 58 353 741
MCW018 203 60 171 549
MCW112 205 61 585 157
4 ADL114 2 319 111 343 871 SRBC
LEI105 320 112 311 513
LEI355 325 112 475 918
SEQALL0433 335 115 448 137
GCT002 349 116 794 963
MCW166 360 124 405 931
MCW314 362 124 918 166
5 MCW306 3 120 33 953 596 KLH
ADL327 158 47 104 936
6 LEI166 3 300 103 360 808 SRBC
MCW037 317 106 712 843
7 LEI258 16 0 147 375 SRBC
MCW370 0 160 229
MCW371 0 158 157
Signature of selection in chicken
643
Population d ifferentiation was tested by permuting genotypes among samples,
assuming absence of Hardy-We inber g equilibrium within samples.
Pairwise linkage disequilibrium was estimated by testing the significance of
association between genotypes at pairs of loci within QTL regions and across sup-
posedly neutral loci; this analysis was performed in G2 and G11 within each line.
P-values were obtained by randomisation of the genotypes at each pair of loci. In
order to take into account the fact that multiple loci were examined, a Bonferroni
correction was applied within each line. Calculations dealing with heterozygosity
and linkage disequilibrium were performed using the F-STAT program [11].
In order t o quantify the genetic diver gence over time of our lines deriving
from the founder population, we estimated the genetic distances. We assumed
that mutations at the microsatellite markers could be neglected. It h as been
reported that divergence occurred o n a short-term period and inbreeding
increased within each line [ 21]. Thus, the Reynolds distance [34] i s preferred
because under t he assumption of pure genetic drift, it is the least biased g enetic
distance for closely related b reeds and exhi bits the smallest standard error [20].
Since our different markers are polymorphic l oci with balanced or unbalanced
allele frequencies in the founder population, we used weighted estimates of
Reynolds distance,
^
D
Ã
R
[20]. The standard error of the weighted Re ynolds
distance, rð
^
D
Ã
R
Þ, is equal to:
r
^
D
Ã
R
ÀÁ
¼
ffiffiffiffiffiffiffiffiffiffiffiffiffiffiffiffiffiffiffiffiffiffiffiffiffiffiffiffiffiffi
2
P
L
j¼1
k
0;j
À 1
ÀÁ
s
"
F þ 1=n
0
þ 1=n
t
ðÞðÞ; ð1Þ
where k
0, j
is the number of alleles at the jth locus in the founder generation, n
0
and n
t
are, respectively, the number of alleles in the founder generation and in
generation G11 and
"
F is the average inbreeding coefficient [20]. Here,
weighted estimates of Reynolds distance and standard errors were computed
between the G2 population and lines in G11, and across lines in G11, using
the POPULATIONS programme [19]. In order to assess the influence of the
different types of markers, genetic distances were estimated using genotypes
at supposedly neutral markers, on the one hand and genotypes at all markers in
QTL regions, on the other hand.
2.4. Evolution of marker polymorphism within lines
2.4.1. Temporal changes in allele frequencies
In order to d etect markers for which the evolution of polymorphism departs
from evolution under pure d rift, we e stimated temporal changes i n a llele fre-
quencies for each locus.
644
V. Loywyck et al.
An estimate o f the standardised temporal variance in allele frequency, f [47],
was computed for each locus within each line over the 13 generations; the f
c
esti-
mator of f,proposedbyNeiandTajima[30] was used:
^
f
c
¼
1
k
X
k
i¼1
x
0;i
À x
t;i
½
2
x
0;i
þ x
t;i
2
À x
0;i
Á x
t;i
; ð2Þ
where k is the number of segregating alleles, x
0,i
is the frequency of allele i in
G2 and x
t,i
is the frequency of this allele in G11. The observed value of f
c
was
compared to the distribution of f
c
obtained from simulations of populations
under drift, with the same initial allele frequencies and the same inbreeding
effective size [10]. P-values were computed for each locus. Because multiple
loci were examined, expected false discovery rates, also known as Q-values,
were calculated within each line using the QVALUE package [39]. The false
discovery rate is the expected proportion of false positives among the tests
found significant. A false positive is the term used to describe rejection of
the null hypothesis (i.e., calling the test significant) when it is really true.
We fixed the false discovery rate at a pre-determined level of a = 5% before-
hand, in order to guarantee that the number of false positives would represent
5% or less of the number of significant tests.
The estimate of the variance effective s ize (Ne
V
) o f each selected line was
directly deduced from the value of
"
f
c
, using the equation of Waples [44]:
^
Ne
V
¼
t
2
"
f
c
À 1= 2S
0
ðÞÀ1=ð2S
t
Þ
ÂÃ
; ð3Þ
where S
0
and S
t
are, respectively, the sample sizes in the founder generation
(G2) and in generation G11, t is the number of generations and
"
f
c
, is the mean
of f
c
across the different loci, weighted by the number of alleles [40]. This
value was compared to the value of effective size calculated from the pedi-
gree, Ne
I
¼ 1=2ÁF.
2.4.2. Simulations
In order to detect markers undergoing selection, we simulated the evolution of
polymorphism of the dif ferent markers along the existing pedigree. Simulations
(1000 iterations) using haplotype dropping along the pedigree were performed.
From the simulation iterations, a 95% confidence interval (CI) was drawn for the
allele frequencies of each marker.
Signature of selection in chicken
645
Initialisation: A haplotype consisted in the different markers located within a
defined zone. Haplotypes in the selected zones and genotypes at the supposedly
neutral markers were known for the 43 individuals of generation G2. We drew
different assumptions about QTL location in one of the selected zones and in
that case, the fa vourable allele Q in generation G2 was either defined as linked
to a marker allele within the z one or settled according t o a given i nitial
frequency.
Transmission: The approximate mutation rate in our dataset was calculated
based on t he number of new alleles in G1 1 (and confirmed wi th simulations),
which y ielded a mutation rate of 1 0
À7
. Th ere fore, a stepwise mutation model
was used with a 10
À7
mutation rate. Recombination withi n the h aplotype fol-
lowed t he Haldane m odel. Haplotypes a nd genotypes were dropped a long the
existing pedigree conditional on the observed phenotypes.
First, we tested the assumption of pure d rift: transmission of haplotypes a nd
genotypes followed Mendelian transmission rules. Second, we assumed the
presence of QTL related to one of the three traits in one of the QTL regions
and tested the assumption of both selection and drift: transmission of genotypes
and haplotypes in z ones w ithout QTL followed Mendelian transmission rules
whereas transmission of the haplotype in the zone with the Q TL was c onditional
to the transmission of the QTL. Transmission of the Q TL was conditional on the
phenotype of the offspring and on the QTL genotypes of the parents. In that
case, we used the Bayes theorem:
pG
i
=zðÞ¼
pG
i
ðÞÁpz=G
i
ðÞ
P
j
pG
j
ÀÁ
Á pz=G
j
ÀÁ
; ð4Þ
where p(G
i
/z) is the probability that offspring inherit QTL genotype G
i
given its
phenotypic value z. The so-called prior probabilities of the three QTL geno-
types, p(G
1
)=p(QQ), p(G
2
) =p(Qq) and p(G
3
)=p(qq), were calculated
according to the genotypes of the parents. Probabilities of the phenotype given
the QTL genotype, also called penetrance, were given by p(z/G
i
)=u(z, l
i
, r
2
),
where l
i
is the phenotypic mean for the genotype i at the QTL and r is the phe-
notypic standard deviation (estimated in the base population, i.e., in generation
G0). The distribution of the phenotype was assumed to follow a normal distri-
bution. We set the QTL values for the trait to +a,(k*a) and Àa for genotypes
QQ, Qq and qq, respectively, k being the degree of dominance, using the same
scale as Falconer and Mackay [8].
646
V. Loywyck et al.
3. RESULTS
3.1. Line divergence
3.1.1. Factor analysis
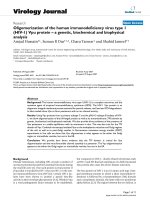
A two-dimensional analysis of a ll individuals based o n genotypes of all mark-
ers discriminated individuals from G11 (Fig. 1a). The t hree selected lines were
distinct and well d istributed, although the control line overlapped with individ-
uals from generations G2 and G1 in the middle of Figure 1a. The first two prin-
cipal components explained in total 10% of the variance.
We obtained the same picture when using only the genotypes of markers
in the QTL zones but not when using the genotypes of supposedly neutral
markers (Figs. 1band1c): for supposedly neutral markers, individuals from
G1 1 gathered at the centre and individuals from line 3 and from the control
line overlapped.
A three-dimensional analysis o f all individuals based on genotypes o f all
markers showed that individuals from generations G2 and G1 were in a different
plane than individuals from G11 (results not shown): the third axis seems to rep-
resent time divergence between generations G2 and G11.
3.1.2. Genetic variability and genetic distances
F
is
values of six markers (one supposed to be neutral and five in QTL
zones) in G2 were significantly different from zero, all markers showing an
excess of heterozygosity. Excess of heterozygosity at the markers was
observed f or female founders originating from an experimental line with very
few reproducers: in that case, allele frequencies are different for sires and for
dams [ 33]; the m ore heterozygosity is in excess, the smaller is the number o f
reproducers. This excess was not observed anymore in G11. However , two
markers showed a s ignificant heterozygote deficiency: SEQALL427 (zone 3)
in line 1 and ADL327 (zone 5) in lines 1 and 2. Th e supposedly neutral mar -
ker ADL278 showed a significantly negative F
is
value in G1 1 in line 2,
whereas this marker did not show any departure from Hardy-Weinberg equi-
librium in G2. The results of deviations from Hardy-We inberg equilibrium
as estimated by F
is
values are presented in Table II.
F
st
values ranged from 0.035 to 0.409. According to the Wright criterion, the
important diversification (F
st
> 0.15) among lines in G11 was due to five sup-
posedly neutral markers and 12 markers located in QTL zones. Estimated F
st
values (and standard deviation) of those markers are presented in Table III.
Signature of selection in chicken
647
Figure 1. Two-dimensional PCA on all individuals from generations G2, G1 and
G11 using genotypes at all markers (a), at markers in QTL regions (b) and at the
supposedly neutral markers (c). Black circles refer to G2, black squares to G1 and
white items refer to G11: circles refer to line 1, squares to line 2, triangles to line 3 and
diamonds to the control line.
648 V. Loywyck et al.
Table II. Deviations from Hardy-Weinberg equilibrium as estimated by F
is
values.
Generation Line LEI146 SEQALL427 MCW112 MCW306 ADL327 LEI258 MCW216 ADL278
[Zone 3] [Zone 5] [Zone 7] [Aviandiv]
G2 À0.380
(1)
À0.405
(1)
À0.376
(1)
À0.268
(2)
À0.504
(2)
À0.252
(3)
À0.735
(4)
À0.163
G11 Line 1 À0.156 0.408
(1)
À0.117 0.070 0.358
(2)
À0.063 À0.324 À0.143
Line 2 À0.085 À0.146 À0.071 0.121 0.277
(2)
0.054 À0.108 À0.326
(4)
Line 3 À0.235 0.202 0.055 0.018 À0.083 0.087 0.239 0.125
Control À0.001 0.142 À0.067 0.023 0.063 À0.024 0.104 À0.028
P-values: P = 0.0071 (1), P = 0.025 (2), P = 0.017 (3) and P = 0.0023 (4).
Signature of selection in chicken
649
No linkage disequilibrium between pairs of neutral loci was found, neither in
generation G2 nor in G11. On the c ontrary, significant l inkage disequilibrium
occurred between pairs of loci within each QTL zone. Linkage disequilibrium
was also tested between the selected markers across the zones: linkage was only
observed between markers within a given zone (detailed results not shown). Fur -
thermore, in our simulations, these results will allow us to consider the suppos-
edly neutral markers as independent whereas markers located in a QTL zone will
consist in a haplotype.
Table IV gives the matrices of weighted Reynolds distances between the G2
population and the four lines in G11, estimated either with genotypes of the sup-
posedly neutral markers (upper m atrix) or with genotypes of m arkers located in
all QTL zones (lower matrix). Genetic distances between G2 and any of the four
lines in G11 tend to be larger using genotypes of markers located in all QTL
zones than using genotypes of supposedly neutral m arkers. However, the Mantel
test did not show a significant difference between the two matrices, whether
individuals from the control line were taken into account or not (P > 0 .05).
Table III. Estimated F
st
values (and standard deviation) of markers involved in line
differentiation.
Marker F
st
(± SD)
MCW183 [Zone 1] 0.196 (± 0.133)
ADL111 0.158 (± 0.056)
ADL118 [Zone 2] 0.188 (± 0.053)
MCW296 0.163 (± 0.091)
SEQALL454 0.409 (± 0.108)
SEQALL455 0.336 (± 0.205)
SEQALL453 0.373 (± 0.170)
SEQALL426 [Zone 3] 0.236 (± 0.208)
MCW166 [Zone 4] 0.172 (± 0.122)
ADL327 [Zone 5] 0.217 (± 0.083)
LEI166 [Zone 6] 0.168 (± 0.146)
MCW370 [Zone 7] 0.223 (± 0.162)
ADL278 [Aviandiv] 0.206 (± 0.091)
LEI234 0.178 (± 0.071)
MCW067 0.189 (± 0.088)
MCW081 0.344 (± 0.178)
MCW222 0.158 (± 0.063)
650 V. Loywyck et al.
Table IV. Genetic distances (± standard error) between the founder generation (G2) and the four lines in generation G11. The upper
matrix gives weighted Reynolds distances estimated by using genotypes of the supposedly neutral markers, whereas the lower matrix
gives weighted Reynolds distances estimated by using genotypes of markers located in all QTL zones.
G2 G11
Control Line 1 Line 2 Line 3
G2 0 0.070 (± 0.035) 0.095 (± 0.031) 0.068 (± 0.030) 0.069 (± 0.027)
G11 Control 0.078 (± 0.035) 0 0.106 (± 0.030) 0.118 (± 0.029) 0.070 (± 0.028)
Line 1 0.072 (± 0.031) 0.153 (± 0.030) 0 0.143 (± 0.027) 0.147 (± 0.025)
Line 2 0.067 (± 0.029) 0.127 (± 0.029) 0.129 (± 0.027) 0 0.121 (± 0.025)
Line 3 0.104 (± 0.027) 0.148 (± 0.028) 0.199 (± 0.025) 0.176 (± 0.025) 0
Signature of selection in chicken
651
3.2. Evolution of marker polymorphism within lines
3.2.1. Temporal variations in allele frequencies
Tw o markers show variations in allele frequencies that could not be explained
only by d rift: f
c
of the supposedly neutral marker ADL278 was 0.559 (Q-value =
0.01) in line 3 and 0.324 (Q-value = 0.00) in line 4; f
c
of SEQALL454 in zone 2
was 0.485 (Q-value = 0.00) in line 4. For loci for which variations could be
explained by drift, the average f
c
value was 0.135 (± 0.101).
3.2.2. Simulations
The 95% CI were very large under the assumption of pure drift. The observed
allele frequencies of six markers (in zones 1, 2 and 3) fell outside the 95% CI. The
observed allele frequencies and 95% CI of those markers are given in Ta ble V.
There is no multiple testing in the results of simulations, but considering the
total number of alleles per zone, we may approximate the expected number of
false positives. The expected number of false positives is four for zones 1 and 2
and three for zone 3. The number of observed allele frequencies that fall outside
the 95% CI is larger than the expected false positives for zone 2. Consequently,
and according to previous results about genetic variability, we shall focus on
zone 2 in greater detail.
QTL in z one 2 was primo-detected for antibody titre to Keyhole Li mpet
Hemocyanin (KLH) and Mycobacterium butyricum, which are complex anti-
gens. S uch complex antigens bind to Th1 or Th2 cytokines and lead to a com-
bination of cellular - and humoral-mediated pathways [9,17]. Trait PHA
corresponds to the cell-mediated immune response. To understand the evolution
of markers located in this zone, different assumptions were drawn about t he
presence of a Q TL affecting t rait PHA (i.e., the selected trait in line 2). First,
we compared the observed allele frequencies in G11 in the four lines. Second,
we confronted the g enotypes of individuals at each marker with the lowest and
the highest PHA phenotypes. This gave us indications on any particular associ-
ation between the marker alleles and the QTL alleles. Then, we tes ted different
localisations of the QTL within zone 2, different degrees of dominance between
the QTL alleles a nd different e f fects o f the QTL on t rait PHA . However, the
observed allele frequencies of SEQALL455 never fitted the 95% CI drawn under
the different assumptions about a bi-allelic QTL simulated within zone 2.
Further investigation of genotyping results led us to question not only the real
polymorphism of two markers, namely SEQALL453 in zone 2 and ADL327
in zone 5: for both of them, a pseudo-null allele seems to exist (with a size
of 209 bases for SEQALL453 and 107 bases for ADL327) a nd was not detectable
652
V. Loywyck et al.
Table V. Observed allele frequencies of markers outside the 95% CI under the assumption of drift.
Zone Marker Allele Line 1 Line 2 Line 3 Control line
Obs. 95% CI Obs. 95% CI Obs. 95% CI Obs. 95% CI
1 MCW183 292 0.170 [0.085; 0.841] 0.433 [0.065; 0.768] 0.540 [0.120; 0.846] 0.489 [0.040; 0.799]
300 0.702 [0; 0.584] 0.4111 [0; 0.445] 0.070 [0; 0.485] 0.233 [0; 0.651]
304 0.011 [0; 0.607] 0.156 [0; 0.612] 0.390 [0; 0.538] 0.244 [0; 0.582]
308 0.117 [0; 0.521] 0 [0; 0.611] 0 [0; 0.549] 0.033 [0; 0.564]
2 ADL118 156 0.650 [0.222; 0.993] 0.260 [0.309; 0.978] 0.688 [0.319; 0.969] 0.622 [0.283; 0.995]
157 0.350 [0; 0.579] 0.320 [0; 0.509] 0 [0; 0.523] 0.378 [0; 0.578]
160 0 [0; 0.495] 0.420 [0; 0.503] 0.312 [0; 0.481] 0 [0; 0.460]
SEQALL454 220 0.551 [0; 0.576] 0.398 [0; 0.582] 0 [0; 0.501] 0.100 [0; 0.582]
225 0.071 [0; 0.708] 0.561 [0.003; 0.654] 0.110 [0.011; 0.640] 0.900 [0.003; 0.737]
227 0.3673 [0; 0.674] 0.041 [0; 0.621] 0.460 [0.013; 0.664] 0 [0.009; 0.712]
229 0 [0; 0.386] 0 [0; 0.365] 0 [0; 0.424] 0 [0; 0.408]
231 0.010 [0; 0.473] 0 [0; 0.417] 0.430 [0; 0.434] 0 [0; 0.369]
SEQALL455 211 0.960 [0.723; 1] 0.704 [0.748; 1] 1 [0.721; 1] 1 [0.7205; 1]
213 0.040 [0; 0.277] 0.296 [0; 0.252] 0 [0; 0.215] 0 [0; 0.2795]
SEQALL453 203 0 [0; 0.474] 0.210 [0; 0.403] 0.051 [0; 0.350] 0 [0; 0.354]
205 0.133 [0; 0.429] 0.120 [0; 0.355] 0 [0; 0.429] 0.042 [0; 0.485]
209 0.041 [0; 0.553] 0.050 [0.001; 0.663] 0.296 [0; 0.540] 0.750 [0; 0.589]
226 0.827 [0.180; 0.939] 0.620 [0.163; 0.864] 0.653 [0.231; 0.933] 0.208 [0.164; 0.956]
3 SEQALL426 153 0.867 [0.091; 0.836] 0.760 [0.114; 0.821] 0.920 [0.093; 0.830] 0.730 [0.047; 0.838]
164 0.133 [0.164; 0.909] 0.240 [0.179; 0.886] 0.08 [0.171; 0.907] 0.270 [0.162; 0.953]
Signature of selection in chicken
653
according to the other allele in the genotype. These assumptions may offset the
effects of selection on these markers.
3.3. Effective population size
Table VI shows the estimations of the effective size for each line, based on
the r ate of i nbreeding using pedigree information (Ne
I
) or based on variations
of allele frequencies ( Ne
V
) either from s upposedly neutral markers or from
markers in all QTL zones.
The values obtained via the temporal variation approach (Ne
V
) wer e alway s
higher than the values derived from the rate of inbreeding (Ne
I
). Moreover, Ne
V
values estimated either from supposedly neutral markers or from markers in
QTL zones w ere s ignificantly different e verywhere except in the control l ine.
The value from neutral markers was significantly lower than the one from mark-
ers in QTL zones in lines 1 and 2, and the opposite was observed in line 3. It has
to be noted that, in the three selected lines, estimations of the effective size based
on tempo r al allele frequencies at the MHC locus [22] w ere equivalent t o Ne
V
using genotype information from m arkers in all QTL zones, but estimated values
were larger in the control line i.e., 76 for the control line and 51, 65 and 41 for
lines 1, 2 and 3, respectively.
4. DISCUSSION
4.1. Combining different methods for the detection of signatures
of selection
Factor analysis gives a good overview of the divergence of lines and consti-
tutes an interesting starting point in detecting signatures of selection. The non-
significant difference between matrices of genetic distances, according to the
type of markers considered, let us suppose that not all markers in the QTL zones
Table VI. Estimation of the effective population size for each line, using pedigree
information (Ne
I
) or genotype information (Ne
V
) either from supposedly neutral
markers or from markers in all QTL zones.
Line 1 Line 2 Line 3 Control
line
Ne
I
34 36 38 40
Ne
V
[95% CI]
Neutral markers 43 [26; 66] 46 [28; 70] 48 [29; 74] 56 [34; 87]
Markers in all
QTL zones
52 [37; 81] 58 [39; 85] 40 [27; 57] 56 [37; 81]
654 V. Loywyck et al.
are i nfluenced by selection. The evolution o f polymorphism of loci over time
( f
c
) and fixation indices allowed us to f ocus on a smaller set o f markers that
may be influenced by selection.
Finally, to confirm which marker w as actually under the influence of selec-
tion, simulations were performed since they could take the selection scheme into
account (the pedigree was completely known).
4.2. Improving the detection of signature of selection
The extent of selective s weep and the distortion in allele frequency spectrum
depend on the strength o f s election and time since selection occurred e.g. [1,4]
but also on original marker variability and marker density. In our experiment, the
strength of selection was attenuated since we tried to balance the representation
of the half-sib families. The low marker density in our dataset was partly due to
the limited number of microsatellites known in the chicken genome and the lim-
ited number of polymorphic markers in our experimental lines. In chicken, drop-
ping simulations along the pedigree would probably be more efficient using
high-density genotypes. For instance, simulation r esults on bovine chromosomes
[13] suggest that the signature of selection can be detected up to 1 Mb ( assum-
ing 1 Mb ~ 1 cM) from a QTL. However , this effect may extend further since
Pollinger et al. [32] showed a 40 Mb-selective sweep around a gene w ith a lar ge
phenotypic ef fect in dog (i.e.,theTYRP1 gene known to be responsible for black
coat colour).
To improve detection o f the signature of selection in our experimental line s
still using our microsatellite markers, an earlier generation should be genotyped.
Indeed, the number of crossing-overs increases with time and any particular
association between a marker and a potential QTL could b e broken along the
successive generations. T his association could p robably still be det ected in
earlier generations. This approach was confirmed b y Wiener et al. [46]when
comparing the effect of selection on GDF-8 (myostatin gene associated with
double-muscling) in double-muscled breeds, using microsatellite loci at various
distances from GDF-8. Their study showed that selection on GDF-8 had left a
stronger mark in the breed in which the double-muscling mutation had been
present for the shortest time.
4.3. Difficulties in detecting signature of selection on immune
response traits
The results dealing with zone 2 (located on chromosome 14) agreed that
selection had an effect on the evolution of polymorphism of markers within
the zone. However, modelling selective sweep was not easy and the underlying
Signature of selection in chicken
655
model seems to be complex. A QTL m ay be involved in the evolution of poly-
morphism within this zone but not only, since the observed allele frequencies
never exactly fitted the simulated CI. A polygenic background could be a dded
or the presence of several QTL with low effects could be assumed with epistatic
interactions within a zone, for instance. Crossbreeding (F1, F2 and backcrosses)
created from generation G1 1 has b een analysed for the three immune traits and
the analysis s howed a significant recombination loss for ND3, which highlights
the important epistatic interactions for this trait [24]. Pleiotropic effects of QTL
on the three traits could also be considered, since the pairwise genetic correla-
tions w ere shown t o be non-significant [26,31] but were still not null and the
three traits represent different aspects of the complex mechanism of immune
response.
Recent improvements in chicken genome mapping [27,41] have shown a cer-
tain number of discordances that led us to question the genetic position but also
the order of microsatellites located within zone 2. Such discordances do not dis-
turb findings from statistical analyses but could disturb results from simulations.
QTL were p rimo-detected for primary antibody response to specific antigens
such as Sheep Red Blood Cells (SRBC), M. butyricum and KLH, and for Lipo-
polysaccharide ( LPS) natural antibodies. H owever, as in mammals, immune
responses in avian species are specialised in the elimination of antigens:
responses to antigens are Th1- or Th2-mediated [ 7]. Th1 r esponses require
the i nterference of t ype 1 T helper cells that directs immune response toward
a cell-mediated response (cellular pathway). Th2 responses require type 2 T
helper cells that favour the development of humoral response (humoral path-
way). KLH and S RBC antigens represent Th2 r esponses whereas M. butyricum
represents Th1 response.
In our experimental dataset, line 1 was selected for antigens a gainst ND3,
inducing a Th1 response [6] whereas traits selected in lines 2 and 3 deal with
innate immune respons e. Markers from zone 2, primo-detected for antigens t o
KLH and M. butyricum and falling outside the 95% CI under assumption of pure
drift in l ine 2, show that responses are rarely exclusively Th1-or Th2-mediated
and even if immune responses to antigens follow the same pathway, there is
additional complexity in the control of different antigens. The detected QTL
were linked to immune response to specific antigens and could not match with
our selected traits. This was confirmed by a recent experiment where antibody
response to KLH, M. butyricum and LPS was tested i n our experimental lines
in generation G12 [25]: no dif ference was observed among lines for KLH
and LPS antibodies, but line 1 selected for ND3 showed a significantly higher
specific response to M. butyricum. Finally, this led us to retain the hypothesis
that QTL may have not segregated in our experimental lines.
656
V. Loywyck et al.
4.4. Effective population size
The effective size e stimated from the rate of inbreeding (Ne
I
) was slightly
smaller than the ef fective size estimated from the variance of allele frequencies
over time (Ne
V
) of supposedly neutral m arkers. This agrees with Crow and
Kimura [5] who pointed out that Ne
I
is usually smaller than Ne
V
when a small
number of parents generate a large number of offspring, with both estimations
assuming neutrality of the markers. However, a surprising result was that estima-
tion of effective size based on allele frequency variation from G2 to G1 1 of
markers located in QTL zones was larger than estimation from supposedly
neutral markers for lines 1 and 2. This may be explained by selection acting like
a backmoving force that draws allele frequencies i n the same direction, whatever
the selected line; in that case, fluctuations for allele frequencies are lower than
for n eutral loci e.g.,[14]. Another explanation may be that samples are taken
from extreme generations and a calculation based on temporal variation in allele
frequencies does not take into account fluctuations that occur over generations:
samples from intermediate generations would have given more information.
It seems that allele frequency variations at the supposedly selected markers
are weaker than those of the whole genome, as for the MHC locus, which is
involved in different stages of the i mmune response [22]. Could this indicate that
variations of markers that influence ND3 or PHA traits are maintained by bal-
ancing selection, like variations at the MHC locus, and that detec tion o f signa-
tures of selection when i t deals with immunity traits is rather di fficult? In
addition, since e xperimental animals are vaccinated against other diseases, do
these vaccinations have an impact on our trait measures? This may explain
why the observed allele frequencies of SEQALL454 in zone 2 f all out of the
CI even in the control line.
ONLINE MATERIAL
The supplementary file (Appendices 1–3) supplied by the authors is available
at: .
Appendix 1. Position of the supposedly neutral markers from the Aviandiv
panel.
Appendix 2. Observed allele frequencies for the markers located in the QTL
zones.
Appendix 3. Observed allele frequencies for the supposedly neutral markers
(excluding those located in a QTL zone).
Signature of selection in chicken
657
ACKNOWLEDGEMENTS
This study w as supported jointly by the F rench G enetic Resources Bureau
(BRG) and the Scientific Committee of AgroParisTech.
REFERENCES
[1] Barton N.H., Genetic hitchhiking, Philos. Trans. R. Soc. Lond. B. Biol. Sci. 355
(2000) 1553–1562.
[2] Bauer DuMont V., Aquadro C.F., Multiple signatures of positive selection
downstream of Notch on the X chromosome in Drosophila melanogaster,
Genetics 171 (2005) 639–653.
[3] Buitenhuis A.J., Rodenburg T.B., van Hierden Y., Siwek M., Cornelissen S.J.B.,
Nieuwland M.G.B., Crooijmans R.P.M.A., Groenen M.A.M., Koene P., Korte
S.M., Bovenhuis H., van der Poel J.J., Mapping quantitative trait loci affecting
feather pecking behaviour and stress response in laying hens, Poult. Sci. 82
(2003) 1215–1222.
[4] Charlesworth B., Nordborg M., Charlesworth D., The effects of local selection,
balanced polymorphism and background selection on equilibrium patterns of
genetic diversity in subdivided populations, Genet. Res. 70 (1997) 155–174.
[5] Crow J.F., Kimura M., An introduction to population genetics theory, Harper &
Row, New York, USA, 1970.
[6] Degen W.G.J, van Daal N., Rothwell L., Kaiser P., Schijns V.E.J.C., Th1/Th2
polarization by viral and helminth infection in birds, Vet. Microbiol. 105 (2005)
163–167.
[7] Erf G.F., Cell-mediated immunity in poultry, Poult. Sci. 83 (2004) 580–590.
[8] Falconer D.S., Mackay T.F.C., Introduction to quantitative genetics, Longman
Scientific & Technical, Essex, UK, 1996.
[9] Gause W.C., Urban J.F. Jr., Stadecker M.J., The immune response to parasitic
helminths: insights from murine models, Trends Immunol. 24 (2003) 269–277.
[10] Goldringer I., Bataillon T., On the distribution of temporal variation in allele
frequency: consequences for the estimation of effective population size and the
detection of loci undergoing selection, Genetics 168 (2004) 563–568.
[11] Goudet J. (2001), FSTAT, a program to estimate and test gene diversities and
fixation indices (version 2.9.3), />[12] Groenen M.A.M., Cheng H.H., Bumstead N., Benkel B.F., Briles W.E.,
Burke T., Burt D.W., Crittenden L.B., Dodgson J., Hillel J., Lamont S., Ponce de
Leon A., Soller M., Takahashi H., Vignal A., A consensus linkage map of the
chicken genome, Genome Res. 10 (2000) 137–147.
[13] Hayes B.J., Lien S., Nilsen H., Olsen H.G., Berg P., Maceachern S., Potter S.,
Meuwissen T.H.E., The origin of selection signatures on bovine chromosome 6,
Anim. Genet. 39 (2008) 105–111.
[14] Hill W.G., Fixation probabilities of mutant genes with artificial selection, Genet.
Sel. Evol. 17 (1985) 351–358.
658 V. Loywyck et al.
[15] Hillel J., Groenen M.A.M., Tixier-Boichard M., Korol A.B., David L.,
Kirzhner V., Burke T., Barre-Dirie A., Crooijmans R.P.M.A., Elo K., Feldman
M.W., Freidlin P.J., Ma¨ki-Tanila A., Oosrtwijn M., Thompson P., Vignal A.,
Wimmers K., Weigend S., Biodiversity of 52 chicken populations assessed by
microsatellite typing of DNA pools, Genet. Sel. Evol. 35 (2003) 533–557.
[16] Iannucelli E., Woloszyn N., Arhainx J., Gellin J., Milan D., GEMMA: a
database to automate microsatellite genotyping, in: Pr oceedings of the XXVth
International Con ference on Animal Genetics, 21–25 July 1996, Tours, France,
Anim. Genet., Suppl., pp. 2–55.
[17] Jankovic D., Liu Z., Gause W.C., Th1- and Th2-cell commitment during
infectious disease: asymmetry in divergent pathways, Trends Immunol. 22
(2001) 481–482.
[18] Keightley P.D., Bulfield G., Detection of quantitative trait loci from frequency
changes of marker alleles under selection, Genet. Res. 62 (1993) 195–203.
[19] Langella O., Populations 1.2.28, logiciel de ge´ne´tique des populations,
Laboratoire Populations, Ge´ne´tique et E
´
volution, CNRS UPR9304, Gif-sur-
Yvette, France, 2002.
[20] Laval G., San Cristobal M., Chevalet C., Measuring genetic distances between
breeds: use of some distances in various short term evolution models, Genet. Sel.
Evol. 34 (2002) 481–507.
[21] Loywyck V., Bijma P., Pinard-van der Laan M H., van Arendonk J., Verrier E.,
A comparison of two methods for prediction of response and rates of inbreeding
in selected populations with the results obtained in two selection experiments,
Genet. Sel. Evol. 37 (2005) 273–289.
[22] Loywyck V., Pinard-van der Laan M-H., Goldringer I., Verrier E., On the need
of combining complementary analyses to assess the effect of a candidate gene
and the evolution of its polymorphism: the example of the Major Histocom-
patibility Complex in chicken, Genet. Res. 87 (2006) 125–131. Erratum in:
Genet. Res. 87 (2006) 223.
[23] Mc Rae A.F., McEwan J.C., Dodds K.G., Wilson T., Crawford A.M., Slate J.,
Linkage disequilibrium in domestic sheep, Genetics 160 (2002) 1113–1122.
[24] Minozzi G., Antibody responses to KLH, LPS and Newcastle disease virus
vaccine in F2 and backcrosses of White Leghorn lines selected for two different
immune traits, SABRE – EADGENE Conference on Genomics for Animal
Health, Utrecht, The Netherlands, 2007.
[25] Minozzi G., Parmentier H.K., Nieuwland M.G.B., Bed’Hom B., Minvielle F.,
Gourichon D., Pinard-van der Laan M H., Antibody responses to keyhole
limpet hemocyanin, lipopolysaccharide and Newcastle disease virus in F2 and
backcrosses of White Leghorn lines selected for two different immune response
traits, Poult. Sci. 86 (2007) 1316–1322.
[26] Minozzi G., Parmentier H.K., Mignon-Gastreau S., Nieuwland M.G.B.,
Bed’Hom B., Gourichon D., Minvielle F., Pinard-van der Laan M H.,
Correlated effects of selection for immunity in White Leghorn chicken lines
Signature of selection in chicken
659
on natural antibodies and specific antibody responses to KLH and M. butyricum,
BMC Genet. 9 (2008) 5.
[27] Morisson M., Leroux S., Jiguet-Jiglaire C., Assaf S., Pitel F., Lagarrigue S.,
Bardes S., Feve K., Faraut T., Milan D., Vignal A., A gene-based radiation
hybrid map of chicken chromosome 14: comparison to human and alignment to
the assembled chicken sequence, Genet. Sel. Evol. 37 (2005) 229–251.
[28] Nair S., Williams J.T., Brockman A., Paiphun L., Mayxay M., Newton P.N.,
Guthman J P., Smithuis F.M., Hien T.T., White N.J., Nosten F., Anderson
T.J.C., A selective sweep driven by pyrimethamine treatment in southeast
malaria parasites, Mol. Biol. Evol. 20 (2003) 1526–1536.
[29] Nei M., Molecular evolutionary genetics, Columbia University Press, New York,
USA, 1987.
[30] Nei M., Tajima F., Genetic drift and estimation of effective population size,
Genetics 98 (1981) 625–640.
[31] Pinard-van der Laan M H., Immune modulation: the genetic approach, Vet.
Immunol. Immunopathol. 87 (2002) 199–205.
[32] Pollinger J.P., Bustanante C.D., Fledel-Alon A., Schmutz S., Gray M.M., Wayne
R.K., Selective sweep mapping of genes with large phenotypic effects, Genome
Res. 15 (2006) 1809–1819.
[33] Pudovkin A.I., Zaykin D.V., Hedgecock D., On the potential for estimating the
effective number of breeders from heterozygote-excess in progeny, Genetics 144
(1996) 383–387.
[34] Reynolds J., Weir B.S., Cockerham C.C., Estimation of the coancestry coefficient
basis for short-term genetic distance, Genetics 105 (1983) 767–779.
[35] Schlo¨tterer C., A microsatellite-based multilocus screen for the identification of
local selective sweeps, Genetics 160 (2002) 753–763.
[36] Siwek M., Cornelissen S.J.B., Nieuw land M.G.B., Buitenhuis A.J., Crooijmans
R.P.M.A., Groenen M.A.M., de Vries-Reilingh G., Parmentier H.K., van der
Poel J.J., Detection of QTL for immune response to Sheep Red Blood Cells in
laying hens, Anim. Genet. 34 (2003) 422–428.
[37] Siwek M., Buitenhuis A.J., Cornelissen S.J.B., Nieuwland M.G.B., Bovenhuis
H., Crooijmans R.P.M.A., Groenen M.A.M., de Vries-Reilingh G., Parmentier
H.K., van der Poel J.J., Detection of different QTL for antibody response to
keyhole lympet hemocyanin and Mycoba cterium butyricum in two unrelated
populations of laying hens, Poult. Sci. 82 (2003) 1845–1852. Erratum in: Poult.
Sci. 85 (2006) 1118–1119.
[38] Siwek M., Buitenhuis A.J ., Cornelissen S.J.B., Nieuwland M.G.B., Knol E.F.,
Bovenhuis H., Crooijmans R.P.M.A., Groenen M.A.M., de Vries-Reilingh G.,
Parmentier H.K., van der Poel J.J., Detection of QTL for innate: non-specific
antibody level s binding LPS and LTA in two independent populations of laying
hens, Dev. Comp. Immunol. 30 (2006) 659–666.
[39] Storey J.D., A direct approach to false discovery rates, J. R. Stat. Soc., Series B
64 (2002) 479–498.
660 V. Loywyck et al.
[40] Tajima F., Nei M., Note on genetic drift and estimation of effective population
size, Genetics 106 (1984) 569–574.
[41] Takahashi H., Tsudzuki M., Sasaki O., Niikura J., Inoue-Murayama M.,
Minezawa M., A chicken linkage map based on microsatellite markers
genotyped on a Japanese Large Game and White Leg horn cross, Anim. Genet.
36 (2005) 463–467.
[42] van der Zijp A.J., Nieuwland M.G.B., Immunological characterization of lines
selected for high and low antibody production, 7th European Poultry Confer-
ence, 1986, Paris, France, vol. 1, pp. 211–215.
[43] Vigouroux Y., McMullen M., Hittinger C.T., Houchins K., Schulz L., Kresovich
S., Matsuoka Y., Doebley J., Identifying genes of agronomic importance in maize
by screening microsatellites for evidence of selection during domestication, in:
Proceeding of the National Academy of Sciences, 2002, vol. 9, pp. 9650–9655.
[44] Waples R.S., A generalized approach for estimating effective population size
from temporal changes in allele frequency, Genetics 121 (1989) 379–391.
[45] Weir B.S., Cockerham C.C., Estimating F-statistics for the analysis of
population structure, Evolution 38 (1984) 1358–1370.
[46] Wiener P., Burton D., Ajmone-Marsan P., Dunner S., Mommens G., Nijman I.J.,
Rodellar C., Valentini A., Williams J.L., Signatures of selection? Patterns of
microsatellite diversity on a chromosome containing a selected locus, Heredity
90 (2003) 350–358.
[47] Wright S., On the roles of directed and random changes in gene frequency in the
genetics of populations, Evolution 2 (1948) 279–294.
Signature of selection in chicken
661