Báo cáo sinh học: " Impact of strong selection for the PrP major gene on genetic variability of four French sheep breeds (Open Access publication)" pptx
Bạn đang xem bản rút gọn của tài liệu. Xem và tải ngay bản đầy đủ của tài liệu tại đây (494.2 KB, 18 trang )
Original article
Impact of strong selection for the PrP major
gene on genetic variability of four French
sheep breeds
(Open Access publication)
Isabelle PALHIERE
1
*
, Mickae¨l BROCHARD
2
,
Katayoun M
OAZAMI-GOUDARZI
3
, Denis LALOE
¨
4
, Yves AMIGUES
5
,
Bertrand B
ED’HOM
6,7
,E
´
tienne NEUTS
1
, Cyril LEYMARIE
1
,
Thais P
ANTANO
5
, Edmond Paul CRIBIU
3
,
Bernard B
IBE
´
1
,E
´
tienne VERRIER
6,7
1
INRA, UR631 Station d’Ame´lioration ge´ne´tique des animaux,
31326 Castanet-Tolosan, France
2
Institut de l’E
´
levage, De´partement de Ge´ne´tique, 78352 Jouy-en-Josas, France
3
INRA, UR339 Laboratoire de ge´ne´tique biochimique et cytoge´ne´tique,
78352 Jouy-en-Josas, France
4
INRA, UR337 Station de ge´ne´tique quantitative applique´e, 78352 Jouy-en-Josas, France
5
LABOGENA, 78352 Jouy-en-Josas, France
6
INRA, UMR1236 Ge´ne´tique et diversite´ animales, 78352 Jouy-en-Josas, France
7
AgroParisTech, UMR1236 Ge´ne´tique et diversite´ animales, 75231 Paris 05, France
(Received 7 February 2008; accepted 22 August 2008)
Abstract – Effective selection on the PrP gene has been implemented since October 2001 in
all French sheep breeds. After four years, the ARR ‘‘resistant’’ allele frequency increased
by about 35% in young males. The aim of this study was to evaluate the impact of this
strong selection on genetic variability. It is focussed on four French sheep breeds and based
on the comparison of two groups of 94 animals within each breed: the first group of animals
was born before the selection began, and the second, 3–4 years later. Genetic variability was
assessed using genealogical and molecular data (29 microsatellite markers). The expected
loss of genetic variability on the PrP gene was confirmed. Moreover, among the five
markers located in the PrP region, only the three closest ones were affected. The evolution
of the number of alleles, heterozygote deficiency within population, expected heterozy-
gosity and the Reynolds distances agreed with the criteria from pedigree and pointed out
that neutral genetic variability was not much affected. This trend depended on breed, i.e. on
their initial states (population size, PrP frequencies) and on the selection strategies for
improving scrapie resistance while carrying out selection for production traits.
genetic variability / scrapie resistance / molecular marker / pedigree / sheep
*
Corresponding author:
Genet. Sel. Evol. 40 (2008) 663–680
Ó INRA, EDP Sciences, 2008
DOI: 10.1051/gse:2008029
Available online at:
www.gse-journal.org
Article published by EDP Sciences
1. INTRODUCTION
Selection on major genes may affect within-population genetic variability.
First, the polymorphism at a major gene itself depends on allele frequencies
and d isappears when an allele is fixed, a situation that can occur w hen the best
genotype is homozygous. Second, it is well known that, in the v icinity of t he
genes under selection, allele frequencies change due to the h itchhiking phenom-
enon. Third, in a finite population, the carriers o f the favourable genotype are
more related to each other than randomly chosen individuals, w hich leads, for
an equal number of reproducers, to a smaller effective population size than
expected in a pure drift situation [ 13]. The risk o f losing genetic variability under
gene or marker assisted selection has been highlighted in many theoretical
studies, e.g. [7,18], but i t has been illustrated in only a few cases of real livestock
populations [14]. However, simulations [ 17] h ave i ndicated that, when introduc-
tion of selection on a major gene leads to less i ntense selection on production
traits, the selected animals tend to be less closely related.
Since October 2001, a s election programme based o n u sing the e xisting
variability of th e PrP gene has been implemented in F rance under c oordination
and funding by the F r ench Ministry of Agriculture, a nd with EU support. A l l
French sheep breeds are concerned in order to progressively increase the
frequency of the ARR ‘‘resistant’’ a llele and to eliminate the VRQ ‘‘very suscep-
tible’’ allele [9]. For cost-effectiveness reasons, it was decided to concentrate
selection e f forts and funds on registered nucleus flocks, in order to select and
provide resistant rams to the wh ole sheep population. For each breed, a specific
programme was defined, taking into account the main breed characteristics:
initial PrP allele frequencies, d isease p revalence, type of br eed (milk, meat
and rare), population size, etc. In addition, to reduce t he risk of decreasing
genetic progress on production traits and to avoid loss of genetic variability,
rules d ealing with the management of sires [22] a nd conservation of semen from
susceptible elite rams in the national cryobank [5] were followed. After four
years of implementation, this large-scale major gene assisted selection
programme has provided impressive results: more than 400 000 genotypes have
been determined, a nd the ARR allele frequency in the young candidate sires has
increased from 51 to 86%, on average, over breeds [4].
The aim of the present study was to evaluate the consequences on the genetic
variability due to sel ection of French s heep breeds on t he PrP gene since 2001.
Four breeds representing various situations were chosen for t hat purpose. The
evolution of genetic variability was a ssessed via both pedigree i nformation
and polymorphisms at microsatellite markers.
664
I. Palhiere et al.
2. MATERIALS AND METHODS
2.1. Breeds and animals sampled
Among the 2 6 main French sheep breeds under going selection, four breeds
were studied i.e. three meat breeds: Berrichon du Cher (BCF), Charollais
(CHL) and Causses du Lot (CDL) and one dairy breed: Manech teˆte rousse
(MTR). This choice resulted from t he diversity of initial PrP allele frequencies
among French breeds [21] and from some specificities of the breeding
programme, including strategies to select for the ARR a llele and preserve
genetic variability (Tab. I). The B CF breed had the highest AR R allele
frequency, i.e. 80%, before the PrP selection programme started. It was also
the breed with one of the w orst situations i n terms of geneti c variability due
to the very limited size of the selection nucleus, the lack of management of
the genetic variability and the i ntensity of the selection processes [8]. The
CDL breed had the lowest initial A RR frequency (15%), and strong efforts to
select for scrapie resistance were made, due to the h igh prevalence of the disease
in its breeding a rea. As a c onsequence, gene tic progress for production traits a nd
management of the genetic variability were considered of secondary importance.
The CHL breed showed the highest evolution o f PrP frequencies a mong the
French sheep breeds considering both the VRQ and the ARR alleles. This breed
was also characterised by a large population s ize, weak selection procedures and
favourable genetic variability criteria as defined by Huby et al. [8], although no
specific rules for managing the population were applied. The MTR breed had a
low initial ARR frequency (16%) a nd the highest prevalence of scrapie. This
dairy breed, which represents the second largest population in France, was
managed with an efficient breeding programme based on selection for dairy
traits and control of t he genetic variability. Thus, these four breeds are not
representative of a hypothetical ‘‘average’’ situation, but exemplify the diversity
of situations encountered in sheep breeding in France.
In each of the four breeds, two groups of 94 young rams were selected,
leading t o eight samples of animals. These rams were randomly chosen among
young candidate sires, which were gathered each year from the different
selection flocks and the different elite ram lines, in order to be performance
tested in the BCF, CHL and CDL breeds, and p rogeny tested in the MTR breed.
Young candidate sires were considered to be representative of the genetic diver-
sity in selection flocks and, partly, of that in com mercial flocks (due to the g ene
flow). T he first group of 94 animals (sample 1) included young rams born before
2000, i.e. before selection for scrapie resistance began. F or these rams, DNA
was collected and stored, giving samples, which retrospectively represented
Impact of PrP selection on genetic variability
665
Table I. General data on the breeds studied and PrP allele frequencies of sampled rams.
Breed Full name Berrichon du Cher Causses du Lot Charollais Manech teˆte rousse
Abbreviated
in this paper
BCF CDL CHL MTR
Type of breed Meat Meat Meat Dairy
Nb of females (whole population) 37 000 107 700 281 700 264 000
Nb of recorded females (nucleus flocks) 4430 16 180 12 040 71 480
% of AI in the nucleus flocks 61% 28% 13% 55%
Average generation length (years) 3.6 3.1 3.0 3.6
Nb of young rams evaluated or tested per year 150 200 230 130
Beginning of PrP selection in nucleus flocks 2002 2001 2002 2000
Genotyping of females Ewe lambs No Ewe lambs Elite dams
ARR frequency
of sampled rams
Before selection for PrP 80% 15% 37% 16%
In 2004 100% 96% 96% 68%
VRQ frequency
of sampled rams
Before selection for PrP 3% 6% 22% 2%
In 2004 0% 0% 0% 0%
666 I. Palhiere et al.
the situation before selection on the PrP gene started. The second group
(sample 2) i ncluded young rams born i n 2004, i.e. after 3–5 years of selection,
depending on the breed.
2.2. Information recorded
2.2.1. Molecular information
The PrP gene and the 29 microsatellite markers were genotyped for all the
animals by L ABOGENA (). For t he PrP gene, f our
alleles were i dentified using t he Taqman method [12]: ARR, AHQ, A RQ and
VRQ (ARH and ARQ alleles are confounded). The 29 markers were genotyped
using a 3100 ABI PRISM
Ò
DNA sequencer (Applied Biosystems, Fos ter City,
CA, USA). Five markers w ere chosen on chromosome 13, at various distances
from PrP: the relative positions of markers McM152, H UJ616 and BMS1669
came from the NCBI map in c onformity with the I nternational Sheep Genomics
Consortium; S11 and S04 are located within the ovine PRNP gene, at about
20 and 45 kb, respectively, from the D NA site coding for the prion p rotein in
exon 3 [6]. The position of PrP is supposed to be at 2 c M from marker
BMS1669, according to [27]. The o ther 24 markers are on other c hromosomes
and we re therefore considered as neutral. Most of them are recommended for
measurement of diversity by the FAO-ISAG [25]. General information about
the PrP gene and a ll the m arkers used in this study are summarised i n Table V.
2.2.2. Pedigree information
Genealogical data came from t he national s heep database. T he file c ontained
all recorded animals born between 1970 and 2004 and their known ancestors, in
the framework of the official performance recording. The numbers of animals in
the pedigree data file were about 140, 427, 827 and 364 thousands in BCF,
CHL, CDL and MTR breeds, respectively.
2.3. Genetic analyses
2.3.1. Comparison of samples and comparison of criteria of variability
The analysis of genetic variability was performed separately for each breed.
Results obtained for the two young ram s amples were compared, allowing quan-
tification of the evolution of g enetic variability b etween two p eriods: be fore
selection for scrapie resistance (sample 1) and a fter 3–5 ye ars of intense selec-
tion o n the PrP gene (sample 2). The genetic variability was a ssessed from the
molecular information a nd from the pedigree data. Parameters associated wi th
Impact of PrP selection on genetic variability
667
the molecular information were computed locus per locus. Results f or the PrP
gene and its flanking markers on chromosome 13 are presented separately.
The r emaining markers, considered as independent, were analysed together to
give an overview of the assumed neutral genetic variability, which could be
compared to that assessed from the pedigree data.
2.3.2. Criteria of variability based on molecular information
Allele frequencies and number of alleles were estimated by direct counting.
At a given locus, the expected heterozygosity, (H) was computed according to
the classical formula:
H ¼ 1 À Rp
2
i
;
where p
i
is the estimated allele i frequency, the sum being over all alleles.
Wright F-statistics F
IS
and F
ST
defined as heterozygote deficiency within
population and between populations, respectively, were computed using
GENEPOP 4.0 [24].
In addition, between-sample diversity was estimated by the Reynolds genetic
distance (D), which w as chosen be cause it has b een shown to b e appropriate for
livestock populations with short-term divergence [10,23]. Considering t he first
sample as the founder population, this distance wa s computed as:
D ¼ R p
1;i
À p
2;i
ÀÁ
2
= 1 À Rp
2
1;i
;
where p
1,i
is the frequency of allele i in the first sample and p
2,i
is the
frequency of this allele in the second sample [11].
Distance D was a lso calculated between breeds from a llele f requencies of the
first samples, in order to compare within-breed to between-breed genetic
diversity.
We tested for congruence or c orrelations among the dif ferent D distance
matrices based on 30 individual loci, according to the procedure developed by
Moazami-Goudarzi and Laloe¨[20]. The Reynolds distance matrices between
the eight groups w ere generated for each locus and correlations between these
matrices were estimated using a Mantel procedure [ 19]. Next, a principal
component analysis (PCA) o n the matrix of correlations was a pplied. The
correlation circle realised by this PCA provided a visual assessment of marke r
congruity.
2.3.3. Criteria of variability based on pedigree data
The PEDIG software [2] was used to ana lyse the genealogical data. For each
ram sample, the pedigree completeness level was assessed by computing
668
I. Palhiere et al.
the a verage number of equivalent complete generations known (Eq.G) over each
ram. The Eq.G was computed as the sum, over all known ancestors, o f the terms
1/2
n
,wheren is the a ncestor’s generation number [15]. For each sample, the
major ancestors were detected using an iterative method [ 3] and their marginal
expected genetic contributions to the gene pool of the sample analysed were
computed. Then, the major ancestors were ranked by decreasing marginal
contributions, in order to determine the number of ancestors explaining 50%
of the gene pool of the sample. The average coefficient of kinship [16] b etween
animals of each sample was computed. Finally, individual coefficients of
inbreeding were computed by the method of VanRaden [26]. The evolution of
the average coefficient of inbreeding was assessed for the young candidate elite
rams (performance tested in BCF, CHL and CDL breeds; progeny tested in the
MTR b reed) per birth year from 1992 to 2004, and the a nnual increase of
inbreeding was estimated by linear regression over t ime. This allowed e nlar ging
the view o f g enetic variability evolution, because the period s tudied was larger
and the population analysed involved the whole cohorts of the young candidate
sires evaluated each year (no sampling).
3. RESULTS
3.1. Genetic variability criteria deduced from molecular information
Number of alleles, expected heterozygosity a nd F
IS
between samples, for each
breed, are presented in Table II.ForthePrP gene, the strong change in
heterozygosity illustrates the effectiveness of selection f or scrapie resistance in
elite rams, over a few years. Indeed, all rams in the BCF breed and most
in CDL and CHL had AR R/ARR genotypes i n 2004, despite t he fact that the
ARR allele frequencies were not very large at the beginning of selection, especially
for CDL and CHL (Tab. I). In the MTR breed, selection response for the PrP gene
was impressive as well, with an increase of ARR frequency from 1 6 t o 68%, even if
less dramatic than in the o ther br eeds. Most animals were A RQ/ARQ in the first
sample and ARR/ARQ in the second, due to assortative mating, which explains
the i ncrease of heterozygosity and the h igh and negative value of F
IS
.
The impact on markers at chromosome 13 was strongly dependent on the
relative position of the marker from the PrP coding gene. As expected, the
S04 and S11 markers, which are on the PrP gene (Tab. V) and should r each
a mono-allelic state as s oon as AR R i s fixed o n PrP, were strongly af fected.
The BMS1669 marker also showed a reduction of heterozygosity, similar to that
of the S04 and S11 markers, except in the CHL breed. The loss of diversity was
small for the HUJ616 marker, and even more so for t he McM152 marker, which
Impact of PrP selection on genetic variability
669
Table II. Number of observed alleles (A), expected heterozygosity (H) and F
IS
values by sample and difference between both (Diff.),
on average for neutral markers and individually for the PrP coding gene and flanking markers. The relative positions from the PrP
coding gene of the flanking markers are: 20 kb for S11, 45 kb for S04, 2 cM for BMS1669, 13 cM for HUJ616 and 27 cM for
McM152.
BCF CDL CHL MTR
1 2 Diff. 1 2 Diff. 1 2 Diff. 1 2 Diff.
Neutral
markers
A 5.46 5.13 À0.33 6.67 6.96 0.29 7.42 7.17 À0.25 7.83 7.42 À0.42
H 0.54 0.52 À0.01 0.64 0.65 0.00 0.67 0.66 0.00 0.69 0.69 0.00
F
IS
0.025 À0.011 0.006 0.029 À0.026 0.004 0.025 0.003
PrP
coding gene
A 41À34 2À23 2À13 2À1
H 0.34 0.00 À0.34 0.56 0.08 À0.48 0.65 0.08 À0.57 0.30 0.43 0.13
F
IS
À0.031 – À0.088 À 0.039 À0.013 À0.040 À0.053 À0.465
Markers on
chromosome 13
S11 A 21À13 1À23 2À12 2 0
H 0.08 0.00 À0.08 0.25 0.00 À0.25 0.51 0.02 À0.49 0.46 0.17 À0.29
F
IS
À0.041 – À0.160 – À0.007 À0.006 0.312 À0.095
S04 A 21À1220220220
H 0.07 0.00 À0.07 0.23 0.07 À0.16 0.50 0.05 À0.45 0.25 0.11 À0.14
F
IS
À0.034 – À0.035 À 0.031 0.031 À0.019 0.069 À0.058
BMS1669 A 43À14 3À1341341
H 0.57 0.49 À0.08 0.66 0.54 À0.12 0.65 0.61 À0.04 0.64 0.52 À0.12
F
IS
À0.131 À0.019 À0.128 À0.013 0.044 À0.190 0.148 0.003
HUJ616 A 330451770891
H 0.35 0.31 À0.04 0.28 0.20 À0.08 0.61 0.55 À0.06 0.73 0.72 À0.01
F
IS
0.005 0.051 À0.050 À0.078 0.065 À0.011 0.080 0.088
McM152 A 54À177057298À1
H 0.62 0.61 À0.01 0.69 0.66 À0.03 0.74 0.72 À0.02 0.71 0.70 À0.01
F
IS
0.233 0.188 À0.053 0.020 0.167 0.191 À0.090 0.047
670 I. Palhiere et al.
are e stimated to be at 13 and 27 cM from PrP, respectively. The impact of selec-
tion on neutral genetic diversity seems to be v ery low, according to the evolution
of expe cted heterozygosity on the 24 microsatellite markers. Average differences
between successive samples w ere close to zero for all b reeds. The evolutions of
the average number of alleles and values of F
IS
agree with this trend.
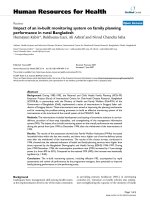
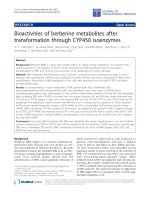
The correlation circle among t he Reynolds distances computed for each
marker (Fig. 1) showed that the PrP gene, S04, S11 and, to a lower extent,
BMS1669, were different from o ther markers. This was c onfirme d by a d etailed
analysis of the Reynolds distances between ram samples within each breed,
computed for the three types of loci (Tab. III). As expected, the highest
Reynolds distance was found for the PrP gene, more markedly in the CDL
(1.852) and the MTR (1.713) breeds. The next highest values were obs erved
for the S04, S11 and BMS1669 markers. The smallest distances were observed
for the HUJ616 and McM152 markers and for ‘‘neutral markers’’, providing
Figure 1. Correlation circle from a PCA on the Reynolds distances computed for the
29 microsatellite markers and the PrP gene. Neutral markers are marked with dots;
the PrP gene and flanking markers are identified by their names.
Impact of PrP selection on genetic variability
671
evidence that genetic d ifferentiation between samples was very small irrespec-
tive of breed. In addition, the Reynolds distances observed between samples
were much smaller than t he distances between breeds, which r anged from
0.101 to 0.186 (data not shown). The values of F
ST
between ram samples within
breed (results not shown) agree with the results from the Reynolds distances. For
the neutral markers, F
ST
values ranged from 0.0004 in CHL to 0 .0086 in BCF
whereas for the PrP gene, they ranged from 0.1348 in BCF to 0.6162 in CHL.
3.2. Genetic variability assessed via pedigree data
Considering t he most recent samples of youn g rams, pedigrees were found
to be rather complete in the BCF, CHL and MTR breeds, with respectively,
7.2, 7.5 a nd 6.0 Eq.G, and less complete in the CDL breed with only
4.3 Eq.G. The average coefficient of relationship between young rams increased
from the fir st sample to the second, in BCF, CHL and MTR (Tab. IV). The
largest increase was found in th e B C F breed while the CDL breed showed a
decrease o f the average coefficient of r elationship. The p edigree completeness
level has to be considered, because of its i mpact on the e volution of the average
coefficient of relationship. The Eq.G was higher in the second sample, for all
breeds: it showed an increase of +0.53 in BCF, +0.79 in CDL, +0.91 in CHL
and +1.97 in MTR (results not shown). This partly explains the increase of
the average coefficient of relationship in the BCF, CHL and MTR breeds.
The number of a ncestors for a cumulative contribution of 50%, wh ich is less
sensitive to the quality of genealogical data [3], suggests an evolution b etween
samples similar to that of the average coefficients of r elationship. The BCF breed,
which already had a reduced genetic variability, showed the highest deteri oration.
The CDL breed had a gain of genetic variability between successive ram samples.
The young rams of the MTR and the CHL breeds w ere little af fected.
Table III. Reynolds distances between both ram samples within each breed, on
average for neutral markers and individually for the PrP coding gene and flanking
markers.
Breed BCF CDL CHL MTR
Neutral markers 0.028 0.021 0.012 0.025
PrP coding gene 0.162 1.852 0.822 1.713
Markers on chromosome 13 S11 0.046 0.166 0.336 0.313
S04 0.041 0.079 0.808 0.062
BMS1669 0.018 0.178 0.120 0.143
HUJ616 0.008 0.018 0.045 0.037
McM152 0.004 0.013 0.030 0.017
672 I. Palhiere et al.
Table IV. Average coefficient of relationship (U) and number of ancestors contributing most for a cumulated expected contribution
of 50% (N
50
) by sample, and difference between both (Diff.).
Breed sample BCF CDL CHL MTR
1 2 Diff. 1 2 Diff. 1 2 Diff. 1 2 Diff.
U (%) 4.1 5.6 1.5
**
2.2 1.5 À0.7
**
1.5 1.9 0.4
**
2.4 2.8 0.4
**
N
50
97À22% 14 16 14% 26 24 À8% 11 11 0%
**
Difference significant (P < 0.001).
Impact of PrP selection on genetic variability
673
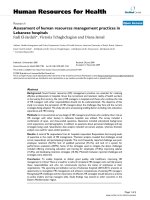
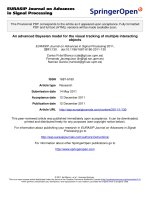
Figure 2 shows the evolut ion of inbreeding between 1992 and 2004. Both the
average coefficient of i nbreeding in a given year and t he rate of inbreeding were
higher i n the BCF breed than in the other breeds. BCF rams born in 2004 had an
unusual increase of inbreeding relative to previous birth years. For young rams
in MTR, the average coefficient of inbreeding grew gradually, wit h no v isi ble
change in the rate a fter implementation o f t he selection p rogramme on the
PrP gene. I n t he CHL and CDL breeds, a slight rise of inbreeding had been
observed since 2000 and 2001, respectively. Taking into account the g eneration
lengths of the breeds, these average annual rates of inbreeding roughly c orre-
spond to realised effective population sizes of 126 in BCF, 676 in CDL, 399
in CHL and 159 in MTR be tween 1992 and 1999. In comparison, between
2000 and 2004, the realised effective population s izes were estimated a t 43 in
BCF, 137 in CDL, 132 in CHL and 206 in MTR.
4. DISCUSSION
4.1. Impact of selection for scrapie resistance on genetic variability
The b etween-sample period length represents about one ge neration. During
this very short time, an impressive loss of genetic variability was observed for
the PrP gene, a s a consequence of the strong selection acting directly on this
gene. In the most recent sample, the ARR allele wa s found to be fixed
Figure 2. Evolution of the average coefficient of inbreeding of the young candidate
elite rams per birth year.
674 I. Palhiere et al.
in the BC F breed, and close to fixation in the C D L and CHL breeds, whereas
in the MTR breed most of the young elite rams carried the ARR /ARQ
genotype.
Simultaneously, even though to a lesser extent, the variability of the five mark-
ers located in the vicinity of the PrP gene changed (Fig. 1). As expected, the S04
and S11 markers were strongly affected by selection f or the ARR allele, evidence
of their high proximity to the coding gene. T herefore, selection for ARR /ARR
animals will r esult in keeping animals that are carriers o f only one of the three loci
(PrP, S11 and S04) haplotype. However, the S04 and S11 markers were less
affected by selection t han PrP, due partly to an incomplete linkage disequilibrium
and, mostly, to their small i nitial polymorphism (e.g. for t he S04 marker , with
alleles 139 and 146, the f requencies moved from 0.87 and 0.13 before selection
to 0.94 and 0.04 a fter selection, in the CDL breed). BMS1669, which is supposed
to be at 2 cM from the PrP gene, showed a smaller but significant evolution of its
polymorphism. HUJ61 6 and McM42 were weakly affected, in agreement with
their distance from the PrP gene: 1 3 and 27 cM, respectively.
With regard to neutral genetic variability, pedigree data and the molecular
information suggested little evolution between both s amples of young rams.
Thus, no consequence of severe bottlenecks was observed in our data. Several
explanations can be proposed: ( 1) Considering the short time during w hich
selection was applied (about on e generation), it may be too early to observe
the consequence of an effective population size reduction, particularly on
heterozygosity, which decreases more slowly than allele diversity. Howe ver,
criteria based on pedigree information (average coefficients of relationship
and numbers of ancestors contributing f or a cumulative contribution of 50%),
usually m ore sensitive to recent s election events, indicated no strong decrease
of genetic variability. The reduction of realised effective population sizes
between 19 92–1999 and 2000–2004 gives a contradictory p icture. However , this
can be explained by reasons beyond selection for the PrP gene. In the CHL and
CDL breeds, selection e f fectiveness for production traits has been enhanced
(more AI, stronger selection of e lite reproducers) since 2000 and 2001, respec-
tively, i.e. when the selection for t he PrP gene began. The BCF breed had an
unusual value of inbreeding i n 2004 (full sibs were selected as candidate sires
by mistake), responsible for an abnormally low effective population size.
(2) Introducing selection for scrapie resistance in breeding programmes often
led the breeding organisations to redefine the relative importance of the different
criteria used for previously elite rams selection. For instance, decrease of selec-
tion load on standard trait s and lower press ure on the genetic value of e lite dams
of young elite rams carrying t he ARR a llele. Consequently, elite rams from n ew
origins, ancestors or farms, were selected. This is illustrated in the CDL breed
Impact of PrP selection on genetic variability
675
where genetic variability in young rams increased after i ntroducing selection for
the PrP gene (Tabs. II and IV),andalsobysimulationresults[17]. (3) Imple-
mentation of practical rules f or managing genetic variability in the breeding pro-
grammes might limit the loss of within-breed variability. Before the PrP
selection began, active sires (resistant and susceptible ones) were grouped
depending on their relationship. Selection for production traits and scrapie resis-
tance was done within-group, in order to keep each ram line, using a ssortative
mating with genotyped sire dams and genotyping a lar ge number of candidate
young sires before their genetic evaluation (high and early selection on PrP
genotypes) [22]. The young rams of the MTR breed, for which this method
had been applied rigorously, illustrate well t he effectiveness of these rules in pre-
serving ge netic variability and ge netic progress [4], despite a low initial fre-
quency of AR R (Tabs. II and IV). The alternative strategy using only ARR/
ARR rams from the beginning of the PrP selection would elicit a rapid increase
in scrapie resistance, but would have strong consequences on genetic p rogress
and genetic variability, as described by Alfonso et al.[1].
4.2. Comparison of results from pedigree data and from neutral
markers polymorphisms
The criteria measuring genetic varia bility from pedigree data represent a p oly -
morphism and its evolution at a neutral locus, anywhere in the genome. In the case
of the b reeds considered here, pedigree data and mo lecular markers assumed to be
neutral (relative to the selection objectives) provided consistent views of neutral
genetic variability, as observed by A lfonso et al.[1] in th e L atxa b reed. However ,
some d ifference s w ere f ound from one breed to another. For in stance, in the CDL
breed, r esult s f rom p e digree d a ta p rovid ed a more optimis tic p ict ure th an results
from the markers, w hereas the opposite was observed in B CF. Among the four
breeds studied, BCF had the highest rate of inb reeding (see Fig. 2 an d [ 8]), but
the mating structu re did not lead to substantial defic iency in heterozy gotes in com-
parison to the expected value from observed a llele frequencies, as revealed by the
small F
IS
value ( Tab. II ). Moreover, the Reynold s d is tance i n the young r ams of
the CHL breed , which was two times lower than in the other breeds, does not reflect
the dif ference i n genetic variabili ty obser ved from p edigrees, w hich is si milar t o
those observed in MTR and CDL (in absolute terms). Despite these little differences,
pedigree data represent a go od source of information for ch aracterising the n eutral
genetic varia bility, especially be cause i t i s easy and inexpensive t o h ave t he av ailable
information. As a c onsequence, these data allow the analysis of larger sam ples both
intermsofnumberofanimalsandyears, w hich strongly reduce problems due to
sampling (Fig. 2).
676
I. Palhiere et al.
4.3. Generalisation of results and recommendations
Can the results based on four breeds be extended to other French sheep breeds
and t o any population applying intensive selection o n a major gene? The choice of
these four breeds among the 26 main French sheep breeds w as made with the idea
of considering a variety of s ituations: small population size (BCF breed), low
initial frequency of A RR allele (CDL and M TR breeds), high evolution of PrP
frequencies (CDL, CHL and MTR breeds), high weight of the PrP gene in the
selection objective (CDL and CHL breeds), lack of effective strategy for
maintaining genetic variability and genetic progress on production traits (BCF,
CDL and CHL breeds). Faced with this panel o f situations, our results can be used
to draw some lessons. Th e initial frequency of the favourable allele (ARR here)
may be, in theory, a determining criterion for evalua ting the ris k of loss of genetic
variability. T he present study partly contradicts this idea. Young rams of breeds
with ini tial unfavourable PrP frequencies (CDL, CHL and MTR) were found
to be little affected whereas youn g rams of the BCF breed had the highest
deterioration o f genetic variabil ity, d espite a suitable ini tial ARR frequency. This
deterioration did not result from the introduction of selection for the PrP gene
(Fig. 2) but was rather a n evidence of the difficulty in m aintaining the within
genetic variability in a breed with both a small ef fective population size and
effective selection procedures such as BCF breed. In addition, it is clear that
for any breed, applying rules for the m anagement o f a ctive s ires within groups
of relatives is sensib le to maintain genet ic variability and also g enetic progress.
ACKNOWLEDGEMENTS
The authors wish to t hank the breed associations and their national federation
for providing animals and useful information; M. San Cristobal and F. Ba rillet
for h el pful comments; W. Brand-Williams, D. Gianola and J.M. Elsen for the
English revision of the manuscript. Financial support for this work was provided
by the French Ministry of Agriculture (Action Innovante ‘‘VAROVI’’).
REFERENCES
[1] Alfonso L., Parada A., Legarra A., Ugarte E., Arana A., The effects of selective
breeding against scrapie susceptibility on the genetic variability of the Latxa
Black-Faced sheep breed, Genet. Sel. Evol. 38 (2006) 495–511.
[2] Boichard D., PEDIG: a fortran package for pedigree analysis suited for large
populations, in: Proceedings of the 7th World Congress on Genetics Applied to
Livestock Production, 2002, CD-Rom n°28-13.
Impact of PrP selection on genetic variability
677
[3] Boichard D., Maignel L., Verrier E., Value of using probabilities of gene origin
to measure genetic variability in a population, Genet. Sel. Evol. 29 (1997) 5–23.
[4] Brochard M., Palhie`re I., Astruc J.M., Barillet F., Bouix J., Bibe´ B., Dion F.,
Elsen J.M., Franc¸ois D., Griffon L., Jullien E., Leymarie C., Orlianges M.,
Pantano T., Perret G., Tiphine L., Tribon P., Use of the PrP major gene to select
for scrapie resistance: example of the 5 years intensive French breeding plan, in:
Proceedings of the 8th World Congress on Genetics Applied to Livestock
Production, 2006, CD-Rom n°22-32.
[5] Danchin-Burge C., Verrier E., Moureaux S., Tixier-Boichard M., Bibe´ B.,
Sampling strategies and overview of the French national cryobank collections,
in: Proceedings of the 8th World Congress on Genetics Applied to Livestock
Production, 2006, CD-Rom n°33-03.
[6] Geldermann H., Preuss S., Eckert J., Han Y., Ollesh K., Analysis of polymorphic
microsatellites within the bovine and ovine prion protein (PRNP) genes, Anim.
Genet. 34 (2003) 283–289.
[7] Gibson J.P., Short term gain at the expense of long term response with selection
on identified loci, in: Proceedings of the 5th World Congress Genetics Applied
Livestock Production, 1994, Vol. 21, pp. 201–204.
[8] Huby M., Griffon L., Moureaux S., de Rochambeau H., Danchin-Burge C.,
Verrier E., Genetic variabili ty of six French meat sheep breeds in relation to their
genetic management, Genet. Sel. Evol. 35 (2003) 637–655.
[9] Hunter N., Foster J.D., Goldman W., Stear N.J., Hope J., Bostock C., Natural
scrapie in a closed flock of Cheviot sheep occurs only in specific PrP genotypes,
Arch. Virol. 141 (1996) 809–824.
[10] Laval G., San Cristobal M., Chevalet C., Measuring genetic dist ances between
breeds: use of some distances in various short term evolution models, Genet. Sel.
Evol. 34 (2002) 481–507.
[11] Laval G., Chevalet C., Pitel F., Amigues Y., Bordas A., Coville J.L., Tixier-
Boichard M., Mode´lisation et e´valuation expe´ rimentale de la diversite´ge´ne´tique
neutre ou adaptative dans le cadre de ligne´es se´lectionne´es chez la poule, Les
Actes du BRG 4 (2003) 35–47.
[12] Lee L.G., Connell C.R., Bloch W., Allelic discrimination by nick-translation
PCR with fluorogenic probes, Nucleic Acids Res. 21 (1993) 3761–3766.
[13] Lush J.L., Chance as a cause of gene frequency within pure breeds of livestock,
Am. Nat. 80 (1946) 318–342.
[14] Maignel L., Labroue F., Analyse de la variabilite´ge´ne´tique des races porcines
collectives et des races locales en conservation a` partir de l’information
ge´ne´alogique, Journ. Rech. Porc. Fr. 33 (2001) 111–117.
[15] Maignel L., Boichard D., Verrier E., Genetic variability of French dairy breeds
estimated from pedigree information, Interbull Bull. 14 (1996) 49–54.
[16] Male´cot G., Les mathe´matiques de l’he´re´dite´, Masson, Paris, 1948.
[17] Man W.Y., Lewis R., Boulton K., Villanueva B., Predicting the consequences of
selecting on PrP genotypes on PrP frequencies, performance and inbreeding in
commercial meat sheep populations, Genet. Sel. Evol. 39 (2007) 711–729.
678 I. Palhiere et al.
[18] Manfredi E., Barbieri M., Fournet F., Elsen J.M., A dynamic deterministic
model to evaluate breeding strategies under mixed inheritance, Genet. Sel. Evol.
30 (1998) 127–148.
[19] Mantel N., The detection of disease clustering and generalized regression
approach, Cancer Res. 27 (1967) 209–220.
[20] Moazami-Goudarzi K., Laloe¨ D., Is a multivariate consensus representation of
genetic relationships among populations always meaningful, Genetics 162
(2002) 473–484.
[21] Palhie`re I., Franc¸ois D., Elsen J.M., Barillet F., Amigues Y., Perret G., Bouix J.,
Allele frequencies of the PrP gene in 29 French sheep breeds. Possible use in
selection for resistance to scrapie, in: Proceedings of the 7th World Congress on
Genetics Applied to Livestock Production, 2002, CD-Rom n°13-13.
[22] Palhie`re I., Brochard M., Verrier E., Moazami-Goudar zi K., Barillet F.,
Bed’Hom B., Bibe´ B., Bouix J., Franc¸ois D., Leymarie C., Pantano T., Did
the selection for scrapie resistance impact the genetic variability? Preli minary
results on four French sheep breeds, in: Proceedings of the 8th World Congress
on Genetics Applied to Livestock Production, 2006, CD-Rom n°30-10.
[23] Reynolds J., Weir B.S., Cockerham C.C., Estimation of the coancestry
coefficient: basis for a short-term genetic dist ance, Genetics 105 (1983) 767–779.
[24] Rousset F., Raymond M., GENEPOP: populations genetics software for exact
test and eucumenicism, J. Hered. 86 (1995) 248–259.
[25] Secondary Guidelines for Development of National Farm Animal Genetic
Resources Management Plans. Measurement of Domestic Animal Diversity
(MoDAD): Recommended Microsatellite Markers. Recommendations of Joint
ISAG/FAO Standing Committee.
[26] VanRaden P.M., Accounting for inbreeding and crossbreeding in genetic
evaluation for large populations, J. Dairy Sci. 75 (1992) 305–313.
[27] Vitezica Z.G., Moreno C.R., Lantier F., Lantier I., Schibler L., Roig A., Franc¸ois
D., Bouix J., Allai n D., Brunel J.C., Barillet F., Elsen J.M., Quantitative trait loci
linked to PRNP gene controlling health and production traits in INRA 401
sheep, Genet. Sel. Evol. 39 (2007) 421–430.
APPENDIX
Table V. Information on the 29 microsatellites and the PrP coding gene.
Marker/gene OAR chromosome Position (cM)
INRA049 1 235
BM1824 1 295
OARFCB20 2 190
OARFCB128 2 125
OARCP34 334
MAF70 461
Impact of PrP selection on genetic variability
679
Table V. Continued.
Marker/gene OAR chromosome Position (cM)
MCM527 5 125
OarAE129 5116
ILSTS005 7 136
MCM42 978
ILSTS011 940
SR-CRSP9 10 –
OARFCB193 11 65
TGLA53 12 39
MCM152 13 52
HUJ616 13 66
BMS1669 13 77
PRNP-S04 13 79
PRNP-S11 13 79
PRNP 13 79
CSRD247 14 26
INRA063 14 65
MAF65 15 47
MAF214 16 45
BM8125 17 87
MAF209 17 48
OARFCB304 19 66
HSC 20 57
OARJMP29 24 4
OARJMP58 26 51
680 I. Palhiere et al.