Báo cáo sinh học: " History and structure of the closed pedigreed population of Icelandic Sheepdogs" pps
Bạn đang xem bản rút gọn của tài liệu. Xem và tải ngay bản đầy đủ của tài liệu tại đây (436.54 KB, 12 trang )
BioMed Central
Page 1 of 12
(page number not for citation purposes)
Genetics Selection Evolution
Open Access
Research
History and structure of the closed pedigreed population of
Icelandic Sheepdogs
Pieter A Oliehoek*
1
, Piter Bijma
1
and Arie van der Meijden
2
Address:
1
Animal Breeding and Genomics Centre, Wageningen University, the Netherlands and
2
Faculty of Geography/Geosciences, Biogeography
Department, Trier University, Germany
Email: Pieter A Oliehoek* - ; Piter Bijma - ; Arie van der Meijden -
* Corresponding author
Abstract
Background: Dog breeds lose genetic diversity because of high selection pressure. Breeding
policies aim to minimize kinship and therefore maintain genetic diversity. However, policies like
mean kinship and optimal contributions, might be impractical. Cluster analysis of kinship can
elucidate the population structure, since this method divides the population in clusters of related
individuals. Kinship-based analyses have been carried out on the entire Icelandic Sheepdog
population, a sheep-herding breed.
Results: Analyses showed that despite increasing population size and deliberately transferring
dogs, considerable genetic diversity has been lost. When cluster analysis was based on kinships
calculated seven generation backwards, as performed in previous studies, results differ markedly
from those based on calculations going back to the founder-population, and thus invalidate
recommendations based on previous research. When calculated back to the founder-population,
kinship-based clustering reveals the distribution of genetic diversity, similarly to strategies using
mean kinship.
Conclusion: Although the base population consisted of 36 Icelandic Sheepdog founders, the
current diversity is equivalent to that of only 2.2 equally contributing founders with no loss of
founder alleles in descendants. The maximum attainable diversity is 4.7, unlikely achievable in a non-
supervised breeding population like the Icelandic Sheepdog. Cluster analysis of kinship coefficients
can provide a supporting tool to assess the distribution of available genetic diversity for captive
population management.
Background
Closed populations with high levels of genetic drift suffer
from reduction of genetic diversity. Genetic diversity is
essential to maintain the adaptive potential of popula-
tions, and confers higher resistance to pathogens. In the
end, reduction of genetic diversity causes higher levels of
inbreeding, which can cause inbreeding depression as
well as high incidences of particular heritable (often reces-
sive) diseases. Managing genetic diversity within popula-
tions is necessary to avoid high incidences of deleterious
alleles and to preserve adaptive potential.
In managed populations, such as domestic animals,
genetic diversity can be maximised by selection according
to optimal contributions, giving each reproductive animal
a specific contribution for the next generations [1,2].
Published: 6 August 2009
Genetics Selection Evolution 2009, 41:39 doi:10.1186/1297-9686-41-39
Received: 29 December 2008
Accepted: 6 August 2009
This article is available from: />© 2009 Oliehoek et al; licensee BioMed Central Ltd.
This is an Open Access article distributed under the terms of the Creative Commons Attribution License ( />),
which permits unrestricted use, distribution, and reproduction in any medium, provided the original work is properly cited.
Genetics Selection Evolution 2009, 41:39 />Page 2 of 12
(page number not for citation purposes)
However, for many populations, this optimal approach
cannot be applied as a breeding strategy, because there is
not one single authority that can decide which animals to
select for breeding. These populations can still increase
their genetic diversity with sub-optimal solutions, which
require an overview of the genetic diversity within these
populations. Hence, individual breeders need insight in
the population structure and in how genetic diversity can
be maintained.
Ubbink et al. [3-5] have used cluster analysis of kinship
coefficients to elucidate the relational structure of pure-
bred dog populations, and to demonstrate correlation
with a genetic disease present in these populations.
Instead of 'looking at a large pile of pedigrees' or a table
with mean kinships [6], they used hierarchical cluster
analysis to visualise the hitherto unknown structure of
pedigreed populations into separate highly related clus-
ters ('family groups') that have a certain level of kinship
(relationship) among each other.
A dog breed is an example of an 'unsupervised' closed
population [7] in which mating is only allowed between
registered dogs of the same breed. Purebred dogs are sub-
ject to strong selection to meet the breed standards. Dog
breed populations can go through a permanent reduction
of genetic diversity due to three factors: (1) only a small
fraction of all pure-bred males and females actually repro-
duce [4]; (2) there is an unequal number of litters among
reproductive males [8]; and (3) dog breeds are often frag-
mented [9]. This permanent reduction of genetic diversity
(bottleneck) has resulted in a high incidence of specific
genetic diseases in different breeds, and in some breeds
most of the animals are affected or carriers [10]. It is now
well recognised that genetic diseases are a major threat for
purebred dog populations [11].
Icelandic Sheepdogs are bred in several European coun-
tries by many individual breeders. It is well known that
the current population of Icelandic Sheepdogs descends
almost entirely from only a few founders that were
selected from remote areas in Iceland between 1955 and
1965.
In the work presented here, we investigate the amount of
genetic diversity lost and the possibilities to maintain or
increase genetic diversity within the Icelandic Sheepdog
population considered as a typical closed dog population.
Furthermore, cluster analysis is evaluated as a tool and for
its potential to identify genetic diversity.
Methods
Data
We received pedigree data via ISIC [12] of the population
of Icelandic Sheepdogs in the following countries: the
Netherlands (725 records), Sweden (1367), Iceland
(1654), Germany (153), Norway (774), Denmark (2241)
and Finland (113). Pedigree data contained unique ID,
father, mother, gender, date of birth, country of birth, and
occasionally date of death. Only Iceland had data since
1955. In other countries, breeding started in 1975 or later
and most of the data went up to 2002 and some only up
to 1998. Except for a few dogs in France, these countries
cover the entire Icelandic Sheepdog population. Animals
without recorded parents were classified as either (1)
'original founders': animals without any relationship with
other founders, documented as such by the kennel clubs,
or (2) 'related animals with unknown parents': animals
that descend from the 'original founders' or their progeny,
but having unknown parentage. Furthermore, some indi-
viduals were registered in more than one country. The
pedigree data were assembled into a single database table,
and animals that were recorded twice were removed based
on information on the country of birth. The problem of
'related animals with unknown parents' was solved by
assembling all datasets with additional information on
parentage from ISIC. After this process, only the original
founders had unknown parents. The equivalent complete
generations traced for each animal was computed as the
sum of the proportion of ancestors known per generation
[13]. Until 1998, pedigrees were complete for all coun-
tries. A general life expectancy was estimated separately
for males and for females from the interval between date
of birth of parents and progeny. If date of death was not
recorded, it was estimated by life expectancy. All animals
born between 1991 and 1998 were considered as the 'cur-
rent-population'.
Population diversity measures
Unless otherwise stated, inbreeding and kinship coeffi-
cients were calculated using the tabular method. Except
for optimal contributions, which were calculated using
Fortran, all measures were calculated using Visual Basic.
Mean kinship was proposed by Ballou and Lacy [6] and is
the mean of the kinship coefficients between that individ-
ual and all candidates, including the individual itself.
Candidates are defined as reproductive individuals of the
current population. The mean kinship (mk
i
) for individ-
ual i is calculated by Ballou and Lacy [6] as:
where N is the number of candidates and f
ij
is the kinship
between individual i and individual j. The mean kinship
of an animal is a measure of the relationship of that indi-
vidual with a population; animals with a low mean kin-
ship are more valuable for genetic diversity. Mean kinship
depends on the population which means that the mean
mk
N
f
iij
j
N
=
=
∑
1
1
,
(1)
Genetics Selection Evolution 2009, 41:39 />Page 3 of 12
(page number not for citation purposes)
kinship of an animal might change over time when a pop-
ulation changes. In conservation genetics, mean kinship is
an important tool to maintain genetic diversity [14].
The following population diversity measures were used:
Average inbreeding ( ) is the average of the inbreeding
coefficient of all candidates. indicates the current risk
of inbreeding depression in the current population.
Average mean kinship ( ) is the average of mean kin-
ships of all candidates within the population under study
[6], and was calculated as:
Average mean kinship, which is predominantly used in
conservation [2,6], differs from average pairwise kinship
because includes kinship of animals with themselves.
In this work, genetic diversity (N
mk
) is defined as the
number of equally contributing founders with no random
loss of founder alleles in descendants that would be
expected to produce the same average mean kinship (and
therefore genetic variation) as in the population under
study. N
mk
is expressed on the scale of founder
genome equivalents [15,16] and is calculated by N
mk
= 1/
2 . A lower average mean kinship means a higher
genetic diversity and thus a higher capacity to adapt as a
population.
In this work, allelic diversity (N
AD
) is defined as half the
number of distinct alleles that are still present in the pop-
ulation under study if all founder alleles were unique. The
number of unique founder alleles that survive each year
was determined by genedrop [17], which was repeated
10.000 times. N
AD
is also expressed in founder genome
equivalents and can therefore be compared with N
mk
and
N
OC
(see below). For example, if the frequencies of all alle-
les were equal, N
AD
would be equal to N
mk
. N
AD
monitors
the loss of genetic diversity due to extinction of unique
(founder-) alleles.
In this work, potential diversity (N
OC
) is defined as the
maximum genetic diversity the population under study
can achieve (expressed in founder genome equivalents).
N
OC
is the genetic diversity obtained when average mean
kinship is minimised using Optimal Contribution Selec-
tion. N
OC
is calculated as described in Oliehoek et al. [18]:
where F is a matrix of kinships between all individuals,
including kinship of individuals with themselves, and c
OC
is a column vector of proportional contributions of indi-
viduals to the next generation, so that the sum of elements
of c
OC
equals one and minimises c
OC
'Fc
OC
[19]. c
OC
is
given by Eding et al. [20]:
where 1 is a column vector of ones. c
OC
contains contribu-
tions of parents to next generations that would minimise
in next generations. However, c
OC
calculated from
Equation 4 can contain negative contributions, which is
impossible in practice. When negative contributions were
obtained, the most negative contribution was set to zero
and vector c
OC
was recalculated until all contributions
were non-negative. N
OC
is the highest possible N
mk
and
measures the diversity that could be obtained in next gen-
erations. N
OC
will always be equal or higher than N
mk
and
equal or lower than N
AD
. N
OC
is relevant in the case of
closed populations, since the population can never reach
a diversity higher than N
OC
. Therefore, it monitors the
unrestorable loss of genetic diversity.
Diversity and Population History
For each year a 'current population' was defined as all the
animals expected to be alive and the following popula-
tion-parameters were determined: the current population
size; the number of progeny born during that year; the
number of founder introductions; and the following
diversity measures: , , N
mk
, N
OC
, N
AD
(as described
above).
Cluster-analysis
Cluster-analysis was performed twice on the current pop-
ulation. (1) The first analysis was based on kinship calcu-
lated using the tabular method starting with the founders
and then UPGMA was applied for clustering all animals
[21]. To determine the most appropriate number of clus-
ters, R
2
, the cubic clustering criteria and pseudo-F statistic
were all examined (SAS Institute, release 9.1, Cary, NC,
USA). These clusters are displayed in a dendrogram,
which is referred to as the all-gen-tree. (2) The second
cluster-analysis was performed as described by Ubbink et
al. [4]. Kinships between all animals were calculated by
the path method [22] until seven generations backwards
F
F
mk
mk
N
mk
N
f
i
i
N
ij
j
N
i
N
==
===
∑∑∑
11
2
111
,
(2)
mk
mk
mk
N
mk
OC OC
OC
==
1
2
1
2
min
*
,
c’Fc
(3)
c
F
1
1
1’F
1
1
OC
=
−
−
,
(4)
mk
F
mk
Genetics Selection Evolution 2009, 41:39 />Page 4 of 12
(page number not for citation purposes)
(instead of the tabular method that includes all genera-
tions). Note that if the path method included all the gen-
erations, results would be equal to the tabular method.
Then, all the animals were clustered using UPGMA. Sub-
sequently all the clusters having an average mean kinship
greater or equal to 0.0625 were defined as the final clus-
ters and displayed in a dendrogram. This kinship value of
0.0625 that delimits clusters corresponds with kinship
between second degree cousins and was used by Ubbink
et al. [4]. This dendrogram is referred to as the 7-gen-tree.
Results and discussion
Data and current population
Of the 4680 dogs in the data, 36 did not have any parents
registered and were recognised as founders by the breed-
ing organisations. All other dogs in the pedigree file
descended from these 36 founders. Most founders lived in
Iceland and were registered there, except for four animals
that lived in Germany.
The current population contained 2554 dogs and repre-
sented 512 unique parent combinations. For dogs in the
current population, the most 'distant' founders appeared
in their pedigree 10 to 20 generations back (nine to 19
ancestors between the current animal and the founder).
The equivalent complete generations [13] traced was 9.1.
All the animals of the current population can only carry
alleles from the 36 founders. In the Icelandic Sheepdog,
just three of the 36 founders contributed more than 80%
of the alleles of the current population (results not
shown). In other words, in about 80% of cases, the pedi-
gree of every animal in the current population will end
with one of these three over-represented founders.
Population history
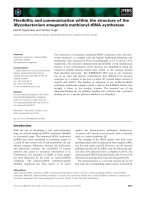
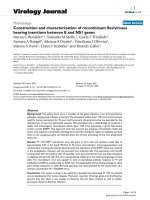
Figure 1 shows the population size and the number of ani-
mals born. The population size hardly grew until 1967,
and then reached 250 animals. Until 1980, most Icelandic
Sheepdogs lived in Iceland but after, their number
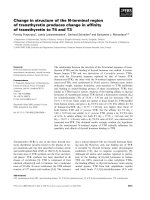
increased in other countries as well. Figure 2 shows the
number of founder introductions, together with genetic
diversity (N
mk
), potential diversity (N
OC
), and the allelic
diversity (N
AD
). In 1955, the first 20 founders were
selected for breeding. These animals were chosen from
remote areas in Iceland.
Figure 2 has eight points of interest. (1) When 20 founders
were selected this resulted in equal, N
mk
, N
OC
and N
AD
(all
equal to 20). (2) N
mk
has decreased since 1955, despite 10
founder introductions up till 1973 and six more after
1979. Each newly introduced founder can potentially
increase genetic diversity but clearly in this case, founder
History of population-sizeFigure 1
History of population-size. Population Size is the number of animals that were (likely to become) reproductive; # Animals
Born indicates the number of puppies that were born during that specific year
0
500
1000
1500
2000
2500
3000
1955
1957
1959
1961
1963
1965
1967
1969
1971
1973
1975
1977
1979
1981
1983
1985
1987
1989
1991
1993
1995
1997
Years
Number of animals
Population Size
# Animals Born
Genetics Selection Evolution 2009, 41:39 />Page 5 of 12
(page number not for citation purposes)
introductions have not increased N
mk
. (3) However, each
founder introduction increases N
OC
and N
AD
by one. (4)
Between 1960 and 1964, N
OC
and N
AD
have decreased
from 24 to less than 10. This remarkable drop is explained
by the fact that most of the 20 founders that were intro-
duced in 1955 only produced one offspring and then died
during this period. (5) N
mk
has strongly decreased from
6.9 in 1967 to 3.2 in 1970. This is contemporaneous with
the start of the first population size growth. N
OC
and N
AD
did not decrease as much during that period. Therefore,
the decrease of N
mk
is caused by unequal allele frequencies
and not by extinction or mixing of unique alleles with
over-represented alleles. The strong decrease of N
mk
is due
to a disproportional contribution of a small number of
individuals to the future generation. (6) Unequal repre-
sentation of founder animals in offspring is also responsi-
ble for the decrease of N
mk
during the first years. (7) The
distance between N
OC
and N
AD
has increased ever since
1963 and reached 5.2 in 1997, which means that it
became increasingly difficult to equalise allele frequen-
cies. In other words, 5.2 founder genome equivalents were
lost because of unique alleles mixing with over-repre-
sented alleles within individuals. Optimal Contribution
Selection cannot restore this loss. (8) The difference
between N
mk
and N
OC
shows that this population has the
potential to increase genetic diversity.
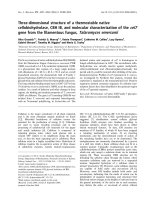
Figure 3 shows , which is the average mean kinship
expressed in probabilities instead of founder genome
equivalents (N
mk
), in order to compare with average
inbreeding ( ). Inbreeding starts at 0 and is initially
lower than kinship, which is expected because kinship
includes kinship of individuals with itself. Later inbreed-
ing increases at a higher rate than kinship, and the average
inbreeding becomes higher than the average mean kin-
ship (in percentage), from 1980 till 1997. This phenome-
non can be attributed to geographic subdivision within
the population. Breeding occurs mainly between dogs
within a given country, and the dogs are more related to
each other.
mk
mk
F
History of diversity in founder genome equivalentsFigure 2
History of diversity in founder genome equivalents. # Founders is the number of founders introduced during that spe-
cific year; after 1991 no new founder was introduced; N
mk
is the average mean kinship in founder genome equivalents; N
OC
is
the minimum possible kinship in founder genome equivalents; N
AD
is half the number of distinct alleles if founders had unique
alleles (scale of founder genome equivalents)
0
5
10
15
20
25
30
1955
1957
1959
1961
1963
1965
1967
1969
1971
1973
1975
1977
1979
1981
1983
1985
1987
1989
1991
1993
1995
1997
Years
Founder Genome Equivalents
# Founders
m
k
N
O
C
N
AD
N
Genetics Selection Evolution 2009, 41:39 />Page 6 of 12
(page number not for citation purposes)
Cluster Analysis Methods Compared
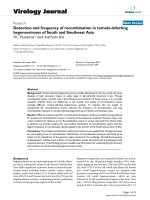
Figure 4 is a histogram of all pairwise kinship values cal-
culated by using all generations among the 2554 dogs of
the current population. This histogram is multi-modal,
which indicates the existence of clusters. Figure 5 gives the
cubic clustering criterion and the R
2
-values for different
numbers of clusters (1 to 25). At cluster numbers of 3, 5
and 8, R
2
shows a jump. Up to eight cluster numbers,
cubic clustering criterion is around zero or less. However,
when the number of clusters equals 8, it increases to 26.2,
which means that the R
2
is larger than can be expected
from a normal distribution. The pseudo-F statistic was
highest at a cluster number of 8 (1066). Eight clusters
were selected based on these three criteria.
Figure 6 shows the all-gen-tree, which is the dendrogram
from the cluster analysis of the current population based
on kinship coefficients calculated by the tabular method
starting with the founders (all generations) having eight
clusters: A to H. Figure 7 shows the 7-gen-tree, which is the
dendrogram from the cluster analysis of the current pop-
ulation based on kinship coefficients calculated by the
path method from the current population back to seven
generations. The all-gen-tree clusters (A to H) are inserted
for each dog to each cluster in the 7-gen-tree. Each cluster
represents a number of animals that are highly related to
each other. Branches indicate the kinship among the clus-
ters. The 7-gen-tree differs substantially from the all-gen-
tree. The all-gen-tree consists of one large cluster A, repre-
senting 2236 animals and a few smaller clusters (repre-
senting altogether 318 animals). However, in the 7-gen-
tree, this cluster A is split at a much lower kinship-level i.e.
0.055. The smaller clusters of the all-gen-tree, redistribute
and sometimes split themselves in the 7-gen-tree.
Ubbink et al. [4] have shown that, in their population, the
inclusion of five, six or seven generations yielded virtually
identical and reproducible results. Hence, Ubbink et al.
[4] have suggested that it is sufficient to calculate kinship
seven generations backwards. Based on the substantial
difference between the 7-gen-tree and the all-gen-tree in
our study, we conclude that this assumption does not
hold for the present population. This difference can be
explained by the presence of common ancestors that are
undetected at five, six or seven generations. An example of
such undetected ancestors is given by the strong influence
of the three predominant founders. At least 80% of the
alleles of the current population descend from these three
founders. While these founders dominate the pedigree
many generations back, they remain undetected at five, six
History of inbreeding and kinship of the current populationFigure 3
History of inbreeding and kinship of the current population.
0
0.1
0.2
0.3
1955
1957
1959
1961
1963
1965
1967
1969
1971
1973
1975
1977
1979
1981
1983
1985
1987
1989
1991
1993
1995
1997
Years
Probabilities
Average Inbreeding
Average mean kinship
Genetics Selection Evolution 2009, 41:39 />Page 7 of 12
(page number not for citation purposes)
or seven generations. These three founders, possibly
together with other frequently used ancestors, cause the
difference between the 7-gen-tree and the all-gen-tree. The
cluster analysis based on all generations is therefore a bet-
ter representation of real kinship.
Diversity per cluster
Table 1 gives the diversity measures: , , N
mk
, N
OC
,
N
AD
for each of the eight clusters treating each cluster as a
separate 'population'. Note that mean kinship depends on
this cluster. In Table 1 mean kinship is calculated within
each cluster; thus mean kinship calculated per cluster dif-
fers from mean kinship calculated for the current popula-
tion as shown in Figure 8 (see below). The of cluster
A is only a little higher than the of the population.
Since cluster A contains 85% of the population, it largely
determines the of the population. Table 1 shows that
while average inbreeding differs per cluster, the average
mean kinship is roughly the same for most clusters; N
mk
is
between 1.7 and 2.0. Only the cluster F, which contains
only two animals, has an N
mk
of 1.2. This is because kin-
ship of an animal with itself has a higher effect on the total
kinship in small populations. No single cluster can con-
tain all the potential diversity. Moreover, within each clus-
ter, the potential diversity N
OC
is hardly higher than N
mk
,
whereas for the population as a whole N
OC
is more than
double N
mk
(4.7 vs. 2.2). This indicates that an increase of
genetic diversity in the current population can be achieved
by optimisation between clusters but not by breeding
within clusters. Each cluster could potentially contribute
to genetic diversity. The small difference of N
mk
and N
OC
within clusters also indicates that all dogs within the clus-
ter are strongly related to each other.
Ideal conservation of the Icelandic Sheepdog
Although genetic diversity (N
mk
) of the current population
of the Icelandic Sheepdog was only 2.2, the potential
diversity (N
OC
) was 4.7. In other words, N
mk
could be
increased from 2.2 to N
mk
= 4.7. However, this value can
be achieved within a few generations only if specific ani-
mals are used for breeding according to their specific opti-
mal contribution (as in vector: c
OC
) as calculated for each
of the 2554 animals. Table 1 shows for each cluster in the
all-gen-tree: a) the relative size of each cluster toward the
current population in percentage and b) the optimal con-
tributions per individual summed per cluster. Table 1
F
mk
mk
mk
mk
Histogram of pairwise kinship values among all dogs of the current populationFigure 4
Histogram of pairwise kinship values among all dogs of the current population. The histogram shows pairwise kin-
ships ranging between 0 and 0.55 with a class interval of 0.001; the area under the curve equals the total number of observed
pairwise kinship among all 2554 dogs of the current population
0
10000
20000
30000
40000
50000
0.00
0.05
0.10
0.15
0.20
0.25
0.30
0.35
0.40
0.45
0.50
Genetics Selection Evolution 2009, 41:39 />Page 8 of 12
(page number not for citation purposes)
shows that animals within the small clusters E to H,
would have to contribute for 12% up to 23% per cluster,
while their cluster sizes are smaller than 1% of the total
population size. The optimal contribution per animal
ranged from zero to 8% (of a total of 100%). In the ideal
situation, 2410 animals of the 2554 would not contrib-
ute, while 50 animals would contribute for 80% in future
generations. This optimal breeding scheme would require
a complete control over the population. This scheme
based on optimal contributions will most probably not be
applied in multi-breeder ('unsupervised') populations
like dog breeds because many breeders would not be
allowed to breed at all.
Cluster analysis combined with country of birth
Figure 9 shows the all-gen-tree (as in Figure 6), including
the country of birth for each dog in each cluster. It illus-
trates the geographic distribution of kinship clusters of the
current population. One large cluster (cluster A) contains
almost every dog of Scandinavia and contains 85% of the
total population size. It includes the entire Norwegian
and Finnish populations and almost every animal born in
Sweden or Denmark, and a large part of the population of
Iceland. Cluster B contains the rest of the Icelandic popu-
lation, except for the distant cluster F that consists of two
full-sibs born in Iceland. The related clusters C and E
mainly contain the Dutch population. Most German Ice-
landic Sheepdogs are found in the most distant clusters G
and H. German and Dutch populations are less related to
Scandinavian populations mainly because the five found-
ers that were introduced between 1970 and 1990 in Ger-
many were unrelated to other founders. However, those
founders were not recognised by the Iceland kennel club
as being true Icelandic Sheepdogs and thus, were not
often used outside Germany.
The reason why a single large Scandinavian cluster exists
is not only due to the founder-effect. Many sheepdog
imports from Iceland were carried out to increase diversity
("new blood") within each country. Breeders often think
that within one country dogs are more related to each
other and belong to the same cluster and they are often
unaware that dogs from other countries might also belong
to the same cluster. Since importing a dog is a large invest-
ment, breeders always selected the 'best dogs' from Ice-
land. Without knowing, Scandinavian mainland-
Cluster criteriaFigure 5
Cluster criteria. The cubic clustering criterion (CCC) and the R-squared per number of clusters (1 to 25).
-100
-80
-60
-40
-20
0
20
40
60
80
100
1 2 3 45678910 11 12 13 14 15 16 17 18 19 20 21 22 23 24 25
Number of Clusters
Cubic Clustering Criterion (CCC)
0
0.1
0.2
0.3
0.4
0.5
0.6
0.7
0.8
0.9
1
R-squared Criterion
CCC
R-squared
Genetics Selection Evolution 2009, 41:39 />Page 9 of 12
(page number not for citation purposes)
countries imported highly related dogs time and again.
This close relationship was not obvious on the standard
pedigree forms given out by studbooks, because they indi-
cate only three or at the most five generations. This lack of
knowledge about true kinship among animals explains
the occurrence of one large highly related cluster. Unde-
tected relatedness is also the cause for the significant dif-
ference between cluster-analysis based on seven or on all
generations (Figure 1 and 2). For several generations,
related animals appear unrelated because pedigrees only
go back three to five generations. Founder and other
ancestors from previous generations might contribute sig-
nificantly to kinship but are not detected at this level.
Mean kinship and cluster analysis
Mean kinship per animal was calculated for the current
population. Figure 8 shows the all-gen-tree dendrogram
(as in Figures 6 and 7) with mean kinships per animal dis-
played in each cluster. Note that mean kinships differ
from those in Table 1 where mean kinship was calculated
within each cluster. The distance of each cluster to cluster
A decreases mean kinship of animals of that cluster. This
means that a conservation strategy based on selecting ani-
mals from distant clusters would give similar results than
that based on selecting animals with a low mean kinship.
While selection by optimal contributions is not possible
within a multi-breeder population, cluster analysis could
help in increasing genetic diversity. Cluster analysis can
provide insight in the population structure for individual
breeders, which helps to persuade them to select dogs
from distant clusters.
In the populations of other breeds studied by Ubbink et
al. [3,4], specific genetic diseases could be linked with
some specific clusters and breeders were advised not to
Cluster analysis of current population (all-gen-tree)Figure 6
Cluster analysis of current population (all-gen-tree).
Results of clustering based on kinship coefficients calculated
using the tabular method (all generations included); the leg-
end with codes per cluster was added in order to compare
this dendrogram to that in Figure 7; the length per cluster
corresponds with the number of (reproductive) individuals,
except for cluster A, which is 10 times the size depicted, rep-
resenting 2236 animals; he line at the 0.0625 kinship level,
corresponds with the 'cut-off level' of the cluster analysis of
Figure 7
Cluster analysis of current population based on 7 generations (7-gen-tree)Figure 7
Cluster analysis of current population based on 7
generations (7-gen-tree). Results of clustering based on
kinship coefficients calculated by the path method for seven
generations backwards; the legend represents the clusters as
demonstrated in Figure 6; the length per cluster corresponds
with the number of individuals, except for the first and the
third cluster from the left: the length of the 'green' A fraction
corresponds to five times the actual size
Genetics Selection Evolution 2009, 41:39 />Page 10 of 12
(page number not for citation purposes)
use any dogs from a cluster associated with the disease.
Table 1 and Figure 8 show that populations might lose
more diversity than breeders would expect when such a
decision is based on a cluster analysis performed only
with seven generations. This emphasizes the importance
of including all generations in kinship calculation, or at
least as many generations as possible.
Genetic diversity compared with other populations
Lacy [16] has recommended to maintain N
mk
= 20 to guar-
anty adequate genetic variability. N
mk
of the Icelandic
Sheepdog was only 2.2. Leroy et al. [23] have found a
higher value (N
mk
= 5.2 to 25) for nine French dog breeds.
However, these results are difficult to compare since the
correction for 'related animals with unknown parents' was
not implemented because they were treated as founders
[24]. Głażewska [25] have reported a founder genome
equivalent of 1.3 in Polish hound, which is comparable
with the N
mk
of 1.3 and concludes that Polish hound has
a dramatic low level of genetic variability. Overall, it is
surprising that, at the time of our study, the Icelandic
Sheepdog did not show any genetic disease considering its
level of inbreeding. Fortunately, the population size is still
increasing, which usually lowers genetic drift.
Conclusion
The overall picture of the Icelandic Sheepdog breed is as
follows. The Icelandic Sheepdog breed was built from
founders, located on remote areas of Iceland between
1955 and 1970. A good part of the diversity was already
lost during the first years of the development of the breed.
Figure 2 shows that about 16 of the original 26 founder
genomes were lost by 1966. In a recent study [26] of a sub-
set of 133 dogs born in Iceland, the average inbreeding
coefficient was 0.21, which is in agreement with the aver-
age inbreeding found in clusters A, B and C (Table 1).
Breeding preferentially a few (and often related) animals,
led to further reduction of genetic diversity. Thus, the
potential diversity of Icelandic Sheepdogs, which was
mainly present in animals from Iceland was not dissemi-
nated and in fact, decreased even within Iceland. In 1998,
the N
OC
was only 4.7 and genetic diversity was less than
half of that and equalled N
mk
= 2.2. Thus, in other words:
the current population had a genetic diversity equal to 2.2
equally contributing founders with no random loss of
founder alleles in descendants. An increase of genetic
diversity to N
mk
= 4.7 is not possible within a few genera-
tions in a multi-breeder population like the Icelandic
Sheepdog.
Breeding with animals having a low mean kinship is an
important conservation method [14]. Cluster analysis is
consonant with mean kinship: distant clusters contain
animals with a low mean kinship and potential diversity
within clusters is hardly higher than genetic diversity
(Table 1), while within the current population as a whole,
potential diversity is almost twice the current diversity.
Cluster analysis of kinship coefficient based on all gener-
ations reveals the population structure and provides better
insight on where to find genetic diversity. The all-gen-tree
of Figure 9 shows that the genetically important animals
are mainly in Iceland, Holland and Germany. Therefore,
cluster analysis is suitable especially for exchanging infor-
mation on genetic diversity in small closed pedigreed
multi-breeder populations.
Although conservation of genetic diversity by means of
optimal contribution selection is unlikely to happen
Table 1: Diversity measures within each cluster of dendrogram 4
Cluster: ABCDEFGHAll*
1
#Animals 2236 47 215 18 12 2 17 7 2554
.27 .16 .21 .12 .11 .02 0 0 .26
.25 .26 .28 .30 .27 .39 .25 .29 .23
N
mk
2.0 1.9 1.8 1.7 1.8 1.3 2.0 1.8 2.2
N
OC
2.4 2.1 2.2 1.7 1.9 1.3 2.0 1.8 4.7
N
AD
5.6 3.4 3.5 2.6 2.6 1.5 2.4 2.0 9.4
Relative size 87.5% 1.8% 8.4% 0.7% 0.5% 0.1% 0.7% 0.3% 100%
Contribution*
2
16% 7% 9% 0% 17% 16% 12% 23% 100%
is average inbreeding (in probabilities); is the average mean kinship within this cluster (expressed in probabilities); N
mk
is the average mean
kinship within this cluster (expressed in founder genome equivalents); N
OC
is the minimum possible kinship within this cluster (expressed in founder
genome equivalents); N
AD
is half the number of distinct alleles if founders had unique alleles within this cluster (expressed in founder genome
equivalents)
*1 show values per diversity measure for the entire population
*2 Contribution is the sum of contributions that specific animals within their cluster would receive after application of optimal contributions over
the entire population
F
mk
F
mk
Genetics Selection Evolution 2009, 41:39 />Page 11 of 12
(page number not for citation purposes)
within a multi-breeder population, preservation of poten-
tial diversity may be the second best option, when few
animals are involved. In the Icelandic Sheepdog, optimal
contributions show that the number of individuals with
the highest potential genetic diversity equals about 50. It
remains to be seen whether it is possible to convince some
breeders to use those animals for breeding or for cryo-con-
servation of semen and oocytes.
This research underlines that dog breeds suffer from
genetic drift continuously. Often dog breeding is only
authorized with animals meeting specific criteria. These
selection criteria, like show-qualifications and health sta-
tus reports, often strongly limit the number of animals
used in breeding. Moreover, certain specific animals are
genetically important (see also Table 1), but in practice,
these animals are often not used at all because they do not
meet the previously mentioned selection criteria. There-
fore, selection criteria might unintentionally accelerate
loss of genetic and/or potential diversity, which is harmful
for populations as a whole.
Competing interests
The authors declare that they have no competing interests.
Authors' contributions
PA conceived the study and carried out the research, PB
participated in its design and AM coordinated and helped
to draft the manuscript. All authors read and approved the
final manuscript.
Acknowledgements
We thank ISIC [12] for facilitating data connection between Icelandic
Sheepdogs among all countries. Furthermore, we would like to thank,
Geert Ubbink for calculating the cluster-analysis for seven generations and
additional advice on this research.
Dendrogram based on all generations showing mean kinshipFigure 8
Dendrogram based on all generations showing mean
kinship. Results of clustering based on kinship coefficients
calculated by the tabular method (all generations included) of
all reproductive Icelandic Sheepdogs; mean kinship per ani-
mals was implemented; grey-scales indicate the mean kinship
for each animal; higher mean kinships show darker and
therefore less important genetically
Dendrogram based on all generations showing country of birthFigure 9
Dendrogram based on all generations showing coun-
try of birth. Results of clustering based on kinship coeffi-
cients calculated by the tabular method (all generations
included) of all reproductive Icelandic Sheepdogs; colours
indicate the fractions of each family group born in a particular
country; the length per cluster and each country per cluster
correspond with the number of individuals, except for clus-
ter A that represented 2236 animals and each country within
cluster A was scaled down by a factor 10
Publish with BioMed Central and every
scientist can read your work free of charge
"BioMed Central will be the most significant development for
disseminating the results of biomedical research in our lifetime."
Sir Paul Nurse, Cancer Research UK
Your research papers will be:
available free of charge to the entire biomedical community
peer reviewed and published immediately upon acceptance
cited in PubMed and archived on PubMed Central
yours — you keep the copyright
Submit your manuscript here:
/>BioMedcentral
Genetics Selection Evolution 2009, 41:39 />Page 12 of 12
(page number not for citation purposes)
References
1. Pong-Wong R, Woolliams JA: Optimisation of contribution of
candidate parents to maximise genetic gain and restricting
inbreeding using semidefinite programming (Open Access
publication). Genet Sel Evol 2007, 39:3-25.
2. Sonesson AK, Meuwissen THE: Minimization of rate of inbreed-
ing for small populations with overlapping generations. Genet
Res 2001, 77:285-292.
3. Ubbink GJ, Hazewinkel HAW, Broek J Van De, Rothuizen J: Familial
clustering and risk analysis for fragmented coronoid process
and elbow joint incongruity in Bernese Mountain Dogs in
The Netherlands. Am J Vet Res 1999, 60:1082-1087.
4. Ubbink GJ, Van de Broek J, Hazewinkel HA, Rothuizen J: Cluster
analysis of the genetic heterogeneity and disease distribu-
tions in purebred dog populations. Vet Rec 1998, 142:209-213.
5. Ubbink GJ, Van den Ingh TS, Yuzbasiyan-Gurkan V, Teske E, Van de
Broek J, Rothuizen J: Population Dynamics of Inherited Copper
Toxicosis in Dutch Bedlington Terriers (1977;1997). J Vet
Intern Med 2000, 14:172-176.
6. Ballou JD, Lacy RC: Identifying genetically important individu-
als for management of genetic variation in pedigreed popu-
lations. In Population management for survival and recovery: analytical
methods and strategies in small population conservation Edited by: Ballou
JD, Gilpin ME, Foose TJ. New York: Columbia University Press;
1995:76-111.
7. Wayne RK, Ostrander EA: Lessons learned from the dog
genome. Trends Genet 2007, 23:557-567.
8. Nielen AL, Van Der Beek S, Ubbink GJ, Knol BW: Population
parameters to compare dog breeds: Differences between
five Dutch purebred populations. Vet Q 2001, 23:43-49.
9. Bjornerfeldt S, Hailer F, Nord M, Vila C: Assortative mating and
fragmentation within dog breeds. BMC Evol Biol 2008, 8:28.
10. Ubbink GJ, Knol BW, Bouw J: The relationship between
homozygosity and the occurrence of specific diseases in Bou-
vier Belge des Flandres dogs in The Netherlands. Vet Q 1992,
14:137-140.
11. Ostrander EA, Wayne RK:
The canine genome. Genome Res 2005,
15:1706-1716.
12. Icelandic Sheepdog International Committee [http://
www.icelanddog.org]
13. Maignel L, Boichard D, Verrier E: Genetic variability of French
dairy breeds estimated from pedigree information. Interbull
Bull 1996, 14:49-54.
14. Frankham R, Ballou JD, Briscoe DA: Introduction to Conservation Genet-
ics Cambridge, UK: Cambridge University Press; 2002.
15. Caballero A, Toro MA: Interrelations between effective popu-
lation size and other pedigree tools for the management of
conserved populations. Genet Res 2000, 75:331-343.
16. Lacy RC: Analysis of founder representation in pedigrees:
Founder equivalents and founder genome equivalents. Zoo
Biol 1989, 8:111.
17. Lacy RC: Clarification of genetic terms and their use in the
management of captive populations. Zoo Biol 1995, 14:565-577.
18. Oliehoek PA, Windig JJ, van Arendonk JAM, Bijma P: Estimating
Relatedness Between Individuals in General Populations
With a Focus on Their Use in Conservation Programs. Genet-
ics 2006, 173:483-496.
19. Meuwissen TH: Maximizing the response of selection with a
predefined rate of inbreeding. J Anim Sci 1997, 75:934-940.
20. Eding H, Crooijmans R, Groenen MAM, Meuwissen THE: Assessing
the contribution of breeds to genetic diversity in conserva-
tion schemes. Genet Sel Evol 2002, 34:613-633.
21. Sneath PHA, Sokal RR: Numerical Taxonomy San Francisco: W. H.
Freeman and Company; 1973.
22. Wright S: Coefficients of Inbreeding and Relationship. Am Nat
1922, 56:330-338.
23. Leroy G, Rognon X, Varlet A, Joffrin C, Verrier E: Genetic variabil-
ity in French dog breeds assessed by pedigree data. J Anim
Breed Genet 2006, 123:1-9.
24. Oliehoek P, Bijma P: Effects of pedigree errors on the efficiency
of conservation decisions. Genet Sel Evol 2009, 41:9.
25. Gł
ażewska I: Genetic diversity in Polish hounds estimated by
pedigree analysis. Livest Sci 2008, 113:296.
26. Ólafsdóttir GA, Kristjánsson T: Correlated pedigree and molec-
ular estimates of inbreeding and their ability to detect
inbreeding depression in the Icelandic sheepdog, a recently
bottlenecked population of domestic dogs. Conserv Genet 2008,
9:1639-1641.