Báo cáo sinh học: "Linear models for joint association and linkage QTL mapping" ppt
Bạn đang xem bản rút gọn của tài liệu. Xem và tải ngay bản đầy đủ của tài liệu tại đây (482.9 KB, 17 trang )
BioMed Central
Page 1 of 17
(page number not for citation purposes)
Genetics Selection Evolution
Open Access
Research
Linear models for joint association and linkage QTL mapping
Andrés Legarra*
1
and Rohan L Fernando
2,3
Address:
1
INRA, UR631, BP 52627, 31326 Castanet Tolosan, France,
2
Department of Animal Science, Iowa State University, Ames, IA, USA and
3
Center for Integrated Animal Genomics, Iowa State University, Ames, IA, USA
Email: Andrés Legarra* - ; Rohan L Fernando -
* Corresponding author
Abstract
Background: Populational linkage disequilibrium and within-family linkage are commonly used for
QTL mapping and marker assisted selection. The combination of both results in more robust and
accurate locations of the QTL, but models proposed so far have been either single marker,
complex in practice or well fit to a particular family structure.
Results: We herein present linear model theory to come up with additive effects of the QTL
alleles in any member of a general pedigree, conditional to observed markers and pedigree,
accounting for possible linkage disequilibrium among QTLs and markers. The model is based on
association analysis in the founders; further, the additive effect of the QTLs transmitted to the
descendants is a weighted (by the probabilities of transmission) average of the substitution effects
of founders' haplotypes. The model allows for non-complete linkage disequilibrium QTL-markers
in the founders. Two submodels are presented: a simple and easy to implement Haley-Knott type
regression for half-sib families, and a general mixed (variance component) model for general
pedigrees. The model can use information from all markers. The performance of the regression
method is compared by simulation with a more complex IBD method by Meuwissen and Goddard.
Numerical examples are provided.
Conclusion: The linear model theory provides a useful framework for QTL mapping with dense
marker maps. Results show similar accuracies but a bias of the IBD method towards the center of
the region. Computations for the linear regression model are extremely simple, in contrast with
IBD methods. Extensions of the model to genomic selection and multi-QTL mapping are
straightforward.
Background
Linkage analysis (LA) is a popular tool for QTL detection
and localization. Its accuracy is limited by the number of
meioses observed in the studied pedigree, which can rep-
resent several centiMorgan. Linkage disequilibrium (LD,
also called gametic phase disequilibrium) is the non-ran-
dom association among different loci, and is increasingly
used in human and agricultural association studies for
gene mapping. The joint use of LD and LA (also called
LDLA) permits to map QTL more accurately than LA while
retaining its robustness to spurious associations, and this
technique has been applied in human [1], plant [2], and
livestock [3] populations. This is achieved by explicitely
modelling relatedness not accounted for in association
analysis [2]. LDLA is also robust to non-additive modes of
inheritance [4]. In addition, the joint use of LD and LA
Published: 29 September 2009
Genetics Selection Evolution 2009, 41:43 doi:10.1186/1297-9686-41-43
Received: 22 January 2009
Accepted: 29 September 2009
This article is available from: />© 2009 Legarra and Fernando; licensee BioMed Central Ltd.
This is an Open Access article distributed under the terms of the Creative Commons Attribution License ( />),
which permits unrestricted use, distribution, and reproduction in any medium, provided the original work is properly cited.
Genetics Selection Evolution 2009, 41:43 />Page 2 of 17
(page number not for citation purposes)
makes it possible to test linkage alone or linkage disequi-
librium separately [1]. A characteristic of plants and live-
stock is that often, close pedigree relationships exist and
are recorded among the individuals genotyped for QTL
detection (e.g., bulls or plant varieties), and including
these relationships in the analyses can be worthwhile.
In livestock, several approaches have been proposed to
take into account LD information within LA [3,5,6]. These
methods model the process generating LD among the
putative QTL and the surrounding markers; this process
can quickly become unmanageable in the general case [7],
and even difficult to approximate [8-10]. Extensions of LD
models to include LA (that is, the cosegregation of mark-
ers and QTL due to physical linkage) are cumbersome for
the general case [6] or restricted to certain pedigree struc-
tures like half-sibs families (C. Cierco, pers. comm.). The
parameters of LD generating processes can be either esti-
mated from the data, which is often difficult, or fixed a
priori which is unsatisfactory. The existence or not of
these events in the past history of a population is
unknown. Therefore the validity of any assumptions is
largely unknown.
An alternative is QTL mapping by simple association
(regression in the case of quantitative traits) of pheno-
types on marker alleles, which has been s.hown to be an
effective method [11,12], while retaining simplicity; this
is widely used in human genetics [13]. On the other hand,
QTL mapping in livestock by LA relies heavily on the use
of half- and full-sibs families and relatively simple ascer-
tainment of phases and transmission probabilities (e.g.
[14]). For this reason, Haley-Knott type regressions for
simple designs [14] and variance component methods for
more complex designs [15] are well adapted, computa-
tionally simpler and almost as good [16,17] as full inte-
grated likelihoods [18,19]. Linear models are appealing
for their ease of use and understanding and good perform-
ance.
In this work, we combine association analysis with prob-
abilities of transmission using conditional expectations.
Ultimately, we come up with linear models for joint asso-
ciation and linkage mapping, which are generalizations of
LA mapping. Two particular cases will be detailed: a half-
sib regression which applies in many livestock practical
settings, and a general mixed model approach valid for
any type of pedigree.
Methods
This section is organised as follows. In the subsection
"Splitting QTL effects", we show how to come up with
expectations for gametic QTL effects integrating associa-
tion and linkage. The following two subsections "LDLA
Haley-Knott type regression" and "Variance components
mapping" explicitly present two linear models (Haley-
Knott type regression for half-sib families and a general
mixed model for a general pedigree) and the statistical
tests that lead to QTL detection, location, and ascertain-
ment of the hypothesis linkage, association, both or lack
of both. Numerical examples and performance of the
methods are illustrated by simulations in subsection
"Illustrations", under two different scenarios.
Splitting QTL effects
In this section we will show how QTL effects can be split
in a part conditional on LD in the founders and cosegre-
gation, and another part which is unconditional on LD in
the founders. This results in a flexible linear model setting.
Throughout the paper, we will assume a polymorphic
QTL with an unknown number of alleles nq: {q
1
ʜ q
nq
},
with effects
α
= (
α
1
ʜ
α
nq
); dominance is not considered.
Let v denote the additive effects of all gametes -carriers of
QTLs- in a population; this will be referred to as "gametic
effects" (e.g. [15]).
In the following we consider haplotypes, which are
phased markers, i.e., a set of 1, 2, or several ordered mark-
ers on the same chromosome. Haplotypes can be classi-
fied in classes. Classes can be formed by simple
classification or by more sophisticated techniques such as
cluster analysis [20,21]. For the sake of discussion we will
assume that haplotypes are composed of two markers
with a putative QTL located at the middle, but our
approach is general and conditional only on the existence
of haplotype classes.
In all the following, we generally consider a single posi-
tion in the genome. This position is situated on a specific
chromosome number of the physical map or karyotype;
for example, BTA14. In a diploid species, each individual
has two copies of each chromosome: one from the pater-
nal side and one from the maternal side. Identification of
the origin of each chromosome copy is not always possi-
ble. In the following, when referring to any given chromo-
some pair containing a specific locus of the genome and
to distinguish the two chromosome copies, we shall note
them 1 and 2.
The haplotype (j-th chromosome in i-th individual, j =
{1, 2}) can be assigned to a haplotype class k through a
function
δ
( ) acting on a haplotype h. In its simplest form,
δ
( ) is a lookup table. So, for the case of two flanking
SNPs, classes are 1 to 4, composed of haplotypes 00, 01,
10 and 11. The number of haplotype classes at the candi-
date position is nh.
We assume that linkage disequilibrium exists between
haplotype classes and QTL alleles. Conditional on each
h
i
j
Genetics Selection Evolution 2009, 41:43 />Page 3 of 17
(page number not for citation purposes)
haplotype class, population frequencies for a QTL state
are denoted by matrix
π
= {
π
1,1
ʜ
π
nq, nh
}. That is, the prob-
ability of QTL state l conditional to haplotype class k is
Pr(Q ≡ q
l
|k) =
π
l, k
. Assuming linkage equilibrium,
π
l, 1
= ʜ
=
π
l, nh
=
π
l
, the marginal population frequency of the l-th
allele of the QTL. In this situation, haplotype classes are
not informative on QTL states. However, given disequib-
rium between the markers loci and the QTL locus,
π
l
,
will vary among the different haplotype classes.
Founders
The haplotype of a founder individual i on chromosome j
is and belongs to a class k (
δ
() = k). The distribution
of additive gametic effect conditional on k is deter-
mined by
π
:
and the expectation of conditional on the haplotype is:
Neither the
α
effects nor the
π
proportions are known in
practice. Thus, we propose to substitute the summation
∑
α
l
π
l, k
by a term
β
k
; that is, to substitute the weighted
effects of QTL alleles for each haplotype class by the over-
all within-class mean. This amounts to considering
β
k
as
the "substitution effect", at the population level, of the
haplotype. This is precisely what is done in association
analysis of quantitative traits. The set of different haplo-
type substitution effects is
β
= {
β
1
,ʜ
β
nh
}. In this new for-
mulation:
Now, can be modelled as the sum of a conditional
expectation plus a deviation: , where
this deviation (assuming the true state of the QTL is q
l
) is
as above. The deviation has a dis-
crete distribution with possible states {(
α
1
-
β
k
),ʜ(
α
nq
-
β
k
)} with probabilities {
π
1, k
,ʜ
π
nq, k
}, which are generally
unknown.
Non-founders
For a non-founder individual i, let be the
probability that the QTL allele at chromosome j of indi-
vidual i is inherited from the QTL allele at chromosome x
of its father; and let probability that allele
at chromosome j is inherited from the chromosome y of
its mother. In the absence of marker information, these
are 0.5. Assume that these probabilities have been com-
puted, conditional on all marker information (m), using
one of several methods [14,22-25]. We will refer to these
probabilities as PDQ's (probability of descent for a QTL
allele) [26]; they can be put together in a row vector w
i, j
(while each PDQ is a conditional probability, we do not
explicitly include m in the notation for simplicity in the
following expressions).
where the subscripts 1 and 2 refer to the two QTL alleles
of the sire and the dam. In the expression above, four
probabilities are needed because maternal and paternal
origin can not always be stablished with certainty [26]
and, for the same reason, labels 1 and 2 are used instead
of "paternal" and "maternal" for each QTL allele in each
individual. Elements in w
i, j
sum to 1.
The conditional distribution of , the gametic effect, is a
discrete set of QTL effects
α
, with probabilities dependent
on, first, the QTL state of its parents; and second, on the
probabilities of transmission of these parental QTLs
towards i. That is:
In particular, if the parents of i are among the founders,
then it follows that:
h
i
j
h
i
j
v
i
j
Pr v h k Pr Q q h k
i
j
l
i
j
i
j
l
i
j
lk
(|())( |())
,
===≡==
αδ δ π
(1)
v
i
j
Ev h Q q h
i
j
i
j
l
i
j
l
i
j
llk
l
nq
l
nq
(|) ( |)
,
=≡=
==
∑∑
ααπ
Pr
11
(2)
Ev h k h
i
j
i
j
k
i
j
(|) , ()==
βδ
where
(3)
v
i
j
vEvh v
i
j
i
j
i
j
i
j
=+
∗
(|)
vEvh
i
j
l
i
j
i
j∗
=−
α
(|)
v
i
j∗
Pr( )QQ
i
j
s
x
←
Pr( )QQ
i
j
d
y
←
wm
ij
i
j
s
i
j
s
i
j
d
i
j
d
QQ QQ QQ QQ
,
| Pr( ),Pr( ),Pr( ),Pr( )=← ← ← ←
⎡
⎣
⎤
⎦
1212
v
i
j
Pr( | , ) Pr( )
Pr( )Pr( ) Pr( )
vQq
Qq Q Q Qq
i
j
l
i
j
l
sl
i
j
ssl
==≡=
≡←+≡
α
m
ππ
112
PPr( )
Pr( )Pr( ) Pr( ) Pr( )
Qq QQ Qq QQ
i
j
s
dl
i
j
ddl
i
j
d
←+
≡←+≡←=
2
1122
w
iij
sl
sl
dl
dl
,
Pr( )
Pr( )
Pr( )
Pr( )
1
2
1
2
≡
≡
≡
≡
⎡
⎣
⎢
⎢
⎢
⎢
⎢
⎢
⎤
⎦
⎥
⎥
⎥
⎥
⎥⎥
⎥
(4)
Pr( | , )
,
,( )
,( )
,( )
,( )
v
i
j
lij
lh
lh
lh
lh
s
s
d
d
==
⎡
⎣
⎢
α
π
π
π
π
δ
δ
δ
δ
mw
ππ
1
2
1
2
⎢⎢
⎢
⎢
⎢
⎢
⎤
⎦
⎥
⎥
⎥
⎥
⎥
⎥
(5)
Genetics Selection Evolution 2009, 41:43 />Page 4 of 17
(page number not for citation purposes)
It follows that the expectation of conditional on
marker information and the rest of parameters is then
simply:
which, if the parents are founders, is:
because of the properties of expectations (i.e., we can fac-
tor out w
i, j
)
.
That is, the expected value of a gametic effect
is equal to the substitution effects of the parents' haplo-
types, weighted by the corresponding transmission prob-
abilities. This is a particular case of a general, recursive
formula that also works if the parents of the individual are
non-founders themselves:
The , the deviation of with respect to its expectation
has states with
associated probabilities
which are conditional on marker information as well.
The two building blocks in the previous section (model-
ling of expectations of gametic effects in founders by LD,
and of non founders by conditioning on founders and
LA) allow us to construct several linear models consider-
ing LD, LA, or both. In the next two sections, we will detail
two linear models including LD and LA for cases com-
monly used in livestock genetics: a regression approach
applied to idealized pedigree structures (half-sib fami-
lies), and a more flexible variance component approach
which can be used for general pedigree structures.
LDLA Haley-Knott type regression
Consider n sires with m marker information. Assume fur-
ther that QTL states at the sires are independent, condi-
tional on their haplotypes and the corresponding
conditional probabilities
π
(i.e. we assume no other rela-
tionship among sires beyond haplotype similarities,
which is usual in this type of regression [14]). Suppose
each of the n sires is mated to several dams with one
daughter per dam - a half-sib design. As before, let
be the probability that the QTL allele at
chromosome j of individual i is inherited from chromo-
some x of the sire; let be the probability
that the QTL allele at chromosome j is inherited from
chromosome y of the dam; these PDQ's, computed based
on m, can be put together in a matrix W
i
.
The expectation of the phenotype y
i
of a given offspring i
from sire s and dam d, conditional on its parents' gametic
effects is:
Gametic effects can be split, as shown above. A part is con-
ditional on linkage disequilibrium in the founders (E(v)),
which in turn can be conditioned on haplotype substitu-
tion effects
β
. Another part is not conditional on linkage
disequilibrium at the founders (v*). Then:
Note that, in the preceding expression, we assume that
haplotypes in the sire and dam are known with certainty.
Assuming paternal (p) and maternal (m) origins can be
established with certainty, it is possible to further simplify
the expression by condensing dams' information. First, it
is possible to condition only on the deviations v* in the
sire, because in this design v*'s for the dams are generally
difficult to estimate and non-estimable in least-squares
regression. Second, we can assume that the proportions
π
v
i
j
Ev Q q
Q
i
j
l
i
j
llij
sl
sl
(|,,) Pr( )
Pr( )
Pr( )
Pr(
,
mw
ππαα
=≡
()
=
≡
≡
αα
1
2
ddl
dl
l
nq
l
nq
q
1
2
11
≡
≡
⎡
⎣
⎢
⎢
⎢
⎢
⎢
⎢
⎤
⎦
⎥
⎥
⎥
⎥
⎥
⎥
==
∑∑
)
Pr( )
(6)
Ev
i
j
ij
h
h
h
h
s
s
d
d
(|,)
,
()
()
()
()
mw
ββ
=
⎡
⎣
⎢
⎢
⎢
⎢
⎢
⎢
⎤
⎦
⎥
⎥
⎥
⎥
⎥
β
β
β
β
δ
δ
δ
δ
1
2
1
2
⎥⎥
(7)
Ev
Ev
Ev
Ev
Ev
i
j
ij
s
s
d
d
(|,)
(|,)
(|,)
(|,)
(|,)
,
mw
m
m
m
m
ββ
ββ
ββ
ββ
ββ
=
⎡
⎣
⎢
1
2
1
2
⎢⎢
⎢
⎢
⎢
⎢
⎤
⎦
⎥
⎥
⎥
⎥
⎥
⎥
(8)
v
i
j∗
v
i
j
{(|,), (|,)}
αα
1
−−Ev Ev
i
j
nq
i
j
mm
ββββ
{Pr( ), Pr( )}Qq Qq
i
j
i
j
nq
≡≡
1
Pr( )QQ
i
j
s
x
←
Pr( )QQ
i
j
d
y
←
Wm
i
is is id id
is
QQ QQ QQ QQ
|
Pr( ) Pr( ) Pr( ) Pr( )
Pr(
=
←←←←
←
11 12 11 12
211222122
) Pr( ) Pr( ) Pr( )QQ QQ QQ
is id id
←←←
⎡
⎣
⎢
⎢
⎤
⎦
⎥
⎥
Ey v v v v
v
v
v
v
issdd i
s
s
d
d
(|,, ,, )[ ]mW
1212
1
2
1
2
11=
⎡
⎣
⎢
⎢
⎢
⎢
⎢
⎢
⎤
⎦
⎥
⎥
⎥
⎥
⎥
⎥
(9)
Ey vvvv
issdd i
h
h
h
s
s
d
(|,, , , , )[ ]
()
()
()
mW
ββ
∗∗∗∗
=
1212
11
1
2
1
β
β
β
β
δ
δ
δ
δδ
()
[]
h
i
s
s
d
d
d
v
v
v
v
2
11
1
2
1
2
⎡
⎣
⎢
⎢
⎢
⎢
⎢
⎢
⎤
⎦
⎥
⎥
⎥
⎥
⎥
⎥
+
⎡
⎣
⎢
⎢
⎢
⎢
⎢
⎢
⎤
⎦
⎥
⎥
∗
∗
∗
∗
W
⎥⎥
⎥
⎥
⎥
(10)
Genetics Selection Evolution 2009, 41:43 />Page 5 of 17
(page number not for citation purposes)
in the founders are still accurate one generation later - that
is, the decay of LD is slow, which holds for short distances
(≈ 1% per generation in intervals of 1 cM). If this holds, it
is possible to change the weighted substitution effect of
the two haplotypes in the dam, and , to the substi-
tution effect of the haplotype found in the maternally
inherited chromosome of descendant i( ). This strategy
was followed by Farnir et al. [5]. Then:
where w
s, i
is a row vector with the two PDQ's from chro-
mosomes 1 and 2 in the sire towards the paternal chromo-
some in i. Extension to n sires is immediate:
where W
p
are the PDQ's from sires to paternal chromo-
some in the offspring; is the set of "residual" gametic
effects in the sires; and Q
s
and Q
m
are incidence matrices
relating, haplotypes in the sires, and maternal haplotypes
in the offspring, to appropriate elements in
β
. Last, Z
p
and
Z
m
are appropriate incidence matrices relating paternal
and maternal gametes in the progeny to records. This con-
ditional expectation immediately translates into a statisti-
cal model:
where e is a vector of residuals. This model can be fitted
by, for example, least-squares. Tests for QTL detection and
location using interval mapping can be done by likeli-
hood ratio or F-tests, assuming homoscedasticity of vari-
ances. Variances are indeed not homogeneous, for
example, if a QTL is fixed within a haplotype class but not
in another. The non consideration of dam effects also
inflates the residual variance. Note, in addition, that the
model is generally not full-rank: effects are non estima-
ble within-sire (but their contrasts are). The
β
coefficients
will be estimable if they are not confounded with any
gametic effect; that is, if no haplotype class is present in
one sire only. However, this does not create any problem
for QTL localization and detection.
An interesting property of the model is that it is a general-
ization of Haley-Knott regression [14,19], which occurs if
we assume linkage equilibrium among founder haplo-
types. Note that spurious signals due to, for example,
stratification, are unlikely in this model because there is a
verification, through linkage (i.e. the PDQ's) that associ-
ated haplotypes are transmitted to the next generation
and still have an effect. This breaks down spurious associ-
ations that would be observed at the founders' level.
A simplified model, which does not include the v* effects
is:
This expression models appropriately the cosegregation of
markers and those QTL in LD with them. We call this
model "LD decay" because it models appropriately the
decay of initial LD existant in the founders by tracing the
effect of the different segments through the pedigree with
the aid of flanking markers, i.e., by linkage. However, it
would not detect a QTL in the case of LE.
Statistical testing
Many tests are possible using the statistical model in equa-
tion (13). Usually (for example in interval mapping), sev-
eral possible QTL locations are tested simultaneously or
sequentially. For a particular putative QTL location, the
null hypothesis is the non-segregation of alleles of the
QTL having different effects. This implies that all haplo-
type substitution effects, as well as the v* deviations, have
the same value. This amounts to a common overall mean
for the data, with
β
= 0, = 0. There are three alternative
hypothesis depending on the existence of complete link-
age disequilibrium, only linkage, or both.
The four hypothesis are:
1. H
0
(null hypothesis): No cosegregation markers-
QTL effects (i.e. no linkage) and no linkage disequilib-
rium among haplotypes-QTL:
β
= 0, = 0.
2. H
1
: Complete linkage disequilibrium at the found-
ers:
β
≠ 0, = 0.
3. H
2
: Linkage equilibrium at the founders but coseg-
regation markers-QTL effects:
β
= 0, ≠ 0.
h
d
1
h
d
2
h
i
m
Ey v v
isssi
h
h
h
s
s
s
i
m
(|,, , )
,
()
()
()
,
mw w
ββ
∗∗
=
⎡
⎣
⎢
⎢
⎤
⎦
⎥
⎥
++
12
1
2
β
β
β
δ
δ
δ
ii
s
s
v
v
∗
∗
⎡
⎣
⎢
⎢
⎤
⎦
⎥
⎥
1
2
(11)
E
spps mm pps
(| ,, )ym v ZWQ ZQ ZWv
ββββββ
∗∗
=++
(12)
v
s
∗
ym v ZWQ ZQ ZWv e|,,
ββββββ
spps mm pps
∗∗
=+++
(13)
v
s
∗
v
s
∗
ym ZWQ ZQ e|,
ββββββ
=++
pps mm
(14)
v
s
∗
v
s
∗
v
s
∗
v
s
∗
Genetics Selection Evolution 2009, 41:43 />Page 6 of 17
(page number not for citation purposes)
4. H
3
: Incomplete linkage disequilibrium at the
founders and residual cosegregation markers-QTL
effects:
β
≠ 0, ≠ 0
In addition, it is possible to test H
3
against H
1
and H
2
.
Variance components mapping
Extension to a variance components or mixed model
mapping framework [15,27,28] is possible [29,30]. As
before, let v be the gametic effects for all the QTL gametes
in the population. We will show how the first and second
moments of the joint distribution of v can be constructed,
conditional on marker information and within haplo-
typic classes means and variances.
Following previous notation, the following recursive
equation for gametic effects holds:
Each gametic effect is modelled as (i) a weighted average
of the gametic effects of its ancestors (for non-founder
individuals) or of haplotypic effects (for founder individ-
uals), plus (ii) independent random variables due to men-
delian sampling [15],
ϕ
. The expression (15) potentially
includes non-founder gametic effects in the progeny of
non-founder animals, allowing for generality and multi-
generational pedigrees.
Note that is partitioned into founders and
non-founders, and all subsequent partitioned matrices. In
particular, W can be partitioned accordingly, so that rows
tracing the origin of founder gametes from other gametes
in the population are formed by 0's. Note that the setting
is very similar to a genetic groups model [31]. Rules for
computing the first and second moments of the distribu-
tion of the gametic effects v follow [29].
Conditional distribution of the gametic effects
Conditional mean for the gametic value
The development is as in previous sections. Let
be the probability that gamete came
from haplotypic class k. In general, for the j-th allele of the
i-th individual,
For founder alleles, conditionally on the haplotype ,
this is simply the mean of the corresponding haplotypic
class, that is , as is 1 for
k =
δ
( ) and 0 for anything else.
For non-founders, a recursive equation holds:
and therefore:
where w
i
is a matrix of PDQ's as before, and s and d indi-
cate the gametes in the father and mother. From expres-
sion (15) [31]. Thus, another
representation in matrix algebra is:
where (I - W)
-1
represents summation over all possible
paths of transmission from ancestors to descendants, and
represents the expected franction of
founder gametes in the descendant gametes [31]. Matrix
Q
f
is an incidence matrix relating founder gametes to
founder haplotypic classes. Matrix Q can be recursively
computed using equation (16). These expressions are sim-
ilar to the QTL crossbred model [32,33], save for groups
for founders, which are based on haplotype classes
instead of breeds.
Conditional variance of the gametic value
Any gamete can in principle be traced to one or sev-
eral founder populations (i.e., haplotypic classes). Had
the gamete come from the haplotype class k, its condi-
tional variance of the gametic effect would be just
v
s
∗
v
v
v
I
0
QWv
I
0
Q
0
W
v
v
=
⎡
⎣
⎢
⎤
⎦
⎥
=
⎡
⎣
⎢
⎤
⎦
⎥
++=
⎡
⎣
⎢
⎤
⎦
⎥
+
⎡
⎣
⎢
⎤
⎦
⎥
f
nf
ff
f
f
nf
ββφφββ
⎡⎡
⎣
⎢
⎤
⎦
⎥
+
⎡
⎣
⎢
⎤
⎦
⎥
φ
φ
f
nf
(15)
vv v=
′′′
[]
fnf
Pr Q k
i
j
()←
Q
i
j
Ev Qk PrQk
i
j
i
j
klk
l
nq
k
i
j
k
k
(|,)Pr()() ()
,
m
ββ
=←
⎡
⎣
⎢
⎢
⎤
⎦
⎥
⎥
=←
=
∑∑∑
απ β
1
h
i
j
Ev
i
j
h
i
j
(|,)
()
m
ββ
=
β
δ
Pr Q k
i
j
()←
h
i
j
Pr Q k
Pr Q k
Pr Q k
Pr Q k
Pr Q k
Pr
i
i
i
s
s
m
()
()
()
()
()
1
2
1
2
1
←
←
⎡
⎣
⎢
⎢
⎤
⎦
⎥
⎥
=
←
←
←
w
(()Qk
m
2
←
⎡
⎣
⎢
⎢
⎢
⎢
⎢
⎢
⎤
⎦
⎥
⎥
⎥
⎥
⎥
⎥
(16)
Ev
Ev
Ev
Ev
Ev
i
i
i
s
s
d
(|,)
(|,)
(|,)
(|,)
(|
1
2
1
2
1
m
m
w
m
m
m
ββ
ββ
ββ
ββ
⎡
⎣
⎢
⎢
⎤
⎦
⎥
⎥
=
,,)
(|,)
ββ
ββ
Ev
d
2
m
⎡
⎣
⎢
⎢
⎢
⎢
⎢
⎢
⎤
⎦
⎥
⎥
⎥
⎥
⎥
⎥
(17)
()IWv
I
0
Q−=
⎡
⎣
⎢
⎤
⎦
⎥
+
f
ββφφ
E
f
(| ,) ( )vm I W
I
0
ββββββ
=−
⎡
⎣
⎢
⎤
⎦
⎥
=
−1
()IW
I
0
1
−
⎡
⎣
⎢
⎤
⎦
⎥
−
Q
i
j
v
i
j
Genetics Selection Evolution 2009, 41:43 />Page 7 of 17
(page number not for citation purposes)
, where
, the average gametic effect in class
k. As the number of QTL alleles and their distribution are
unknown, the different are parameters to be esti-
mated in the model. However, the gamete can come
from several origins, each with probability ;
therefore, the distribution of the gametic effect is a
mixture. Conditioning on all possible origins k = (1,
nh),
which can be expanded [29] to:
where the computations of and
have been previously shown. Note that this expression
reduces to the classical one [15] under linkage equilib-
rium.
Conditional covariances
As modelled here, the conditional covariance of two
gametic effects depends on the event that they are identi-
cal by descent in the observed pedigree. Let and
be two gametes, with indexes arranged so that i can be a
descendant of j but not the opposite. The QTL allele at the
gamete is one of the four gametes of its parents, s and
d. The conditional covariance between the gametic values
and is then:
where the covariances in the right hand side are also con-
ditional on m and
β
. This formula is the same as for the
case of linkage equilibrium in the founders [15,26]. How-
ever, the variances differ due to the different haplotype
origins, and the covariances will not be the same as those
under linkage equilibrium.
Statistical model
A linear model including gametic effects is:
where X and Z are incidence matrices and b is a vector of
fixed effects. Residuals e are normally distributed e| ~
MVN(0, R), where MVN stands for multivariate normal,
and R = I .
Further, assume normality for v (this is an approxima-
tion). Then, , where
Q and G (the covariance matrix of gametic effects) are
computed as above in equations (19, 20). Under this
assumption of normality, the distribution of y is:
where V = ZGZ' + R, and the likelihood is:
Using this likelihood, Bayesian techniques or maximum
likelihood techniques can be used to infer parameters of
the model and location of the QTL. In particular, mixed
model equations are:
Note that G
-1
can be easily constructed using partitioned
matrix rules [26]. These equations might not be conven-
ient because
β
is found on the right hand side. An alterna-
tive formulation uses
that is, using v* = v - Q
β
, which has zero expectation. The
mixed model equations are then [31]:
σαα
ak l k
k
,
,
()
2 2
=−
∑
π
l
l
ααπβ
kllk
l
nq
k
==
∑
,
σ
ak,
2
Q
i
j
Pr Q k
i
j
()←
v
i
j
Var v E Var v Q k Var E v Q k
i
j
k
i
j
i
j
k
i
j
i
j
(|,) (| ) (| )m
ββ
=←
⎡
⎣
⎤
⎦
+←
⎡
⎣
⎤
⎦
(18)
Var v E v Pr Q k
i
j
ak k
i
j
i
j
k
(|,) ( (|,)) ( )
,
mm
ββββ
=+−
⎡
⎣
⎤
⎦
←
∑
σβ
22
(19)
Pr Q k E v
i
j
i
j
()(|,)← m
ββ
Q
i
x
Q
j
y
Q
i
x
v
i
x
v
j
y
Cov v v
Cov v v Pr Q Q Cov v v Pr Q
i
x
j
y
s
j
y
i
x
ss
j
y
i
(, |,)
(, )( ) ( , )(
m
ββ
=
←+
112xx
s
d
j
y
i
x
dd
j
y
i
x
d
Q
Cov v v Pr Q Q Cov v v Pr Q Q
←+
←+ ←
2
1122
)
(,)( ) (,)( )
(20)
yXbZve=++
(21)
σ
e
2
σ
e
2
vm Q G|,, ~ ( ,)
,,
ββββσσ
aanh
1
22
MVN
yb Xb ZQ V| , , , , , ~ ( , )
,,
ββββσσ σ
ea anh
2
1
22
MVN +
f
ea anh
N
( | , , , , , )
( ) | | exp (
,,
//
yb
VyXbZ
ββσ σ σ
π
2
1
22
212
2
1
2
=
−−−
−−
QQVyXbZQ
-1
ββββ
′
−−
⎡
⎣
⎢
⎤
⎦
⎥
)( )
(22)
′′
′′
+
⎡
⎣
⎢
⎢
⎤
⎦
⎥
⎥
⎡
⎣
⎢
⎢
⎤
⎦
⎥
⎥
=
′
′
−−
−−−
−
XR X XR Z
ZR X ZR Z G
b
v
XR y
ZR
11
111
1
ˆ
ˆ
−−−
+
⎡
⎣
⎢
⎢
⎤
⎦
⎥
⎥
11
yGQ
ˆ
ββ
(23)
yXbZQ Zv e=+ + +
∗
ββ
′′′
′′
+
′
′′ ′′
−−−
−−−−
−−
XR X XR Z XR ZQ
ZRX ZRZ G ZRZQ
QZR X QZR Z
111
1111
11
′′ ′
⎡
⎣
⎢
⎢
⎢
⎢
⎤
⎦
⎥
⎥
⎥
⎥
⎡
⎣
⎢
⎢
⎢
⎢
⎤
⎦
⎥
⎥
⎥
⎥
=
′
′
′′
−
∗
−
−
QZR ZQ
b
v
XR y
ZR y
QZ
1
1
1
ˆ
ˆ
ˆ
ββ
RRy
−
⎡
⎣
⎢
⎢
⎢
⎢
⎤
⎦
⎥
⎥
⎥
⎥
1
(24)
Genetics Selection Evolution 2009, 41:43 />Page 8 of 17
(page number not for citation purposes)
Note that enter non-trivially into G.
For the maximum likelihood techniques, derivative-free
techniques might be used with equation (22). For the
Bayesian approach, albeit the "data augmentation" of
gametic effects in (23) or (24) partly simplifies computa-
tions, the full posterior conditionals of
θ
do not have
closed forms; Metropolis-Hastings might be used. Other
possible simplifications are:
• Supress v* from the model in (24), i.e. y = Xb + ZQ
β
+ e. This implicitely assumes: (i) QTL alleles are fixed
within haplotype class; and (ii) transmissions are
known with certainty (i.e. PDQ's are either 0 or 1).
Under these two conditions, Var(v*) = 0. This might
happen for very dense marker maps where markers are
fully informative on QTL state and transmissions. The
result is a least-squares estimator as follows:
• Assume constant variances across classes and, fur-
ther, that PDQ's are known with certainty. If this is the
case, Var(v*) = and standard algorithms and soft-
ware (e.g., REML) can be used.
• If variances are not constant within class but each
gametic effect can be asigned exactly to a class k (i.e.
PDQ's are either 0 or 1), then its variance is . This
is a mixed model with heterogeneity of variances. This
assumption is similar to that by Pérez-Enciso and Var-
ona [33].
Again, the null hypothesis is the non-segregation of QTL
effects, that is, all haplotype substitution effects, as well as
the v* deviations, have a null value; save that v* are now
random effects. The four hypotheses are:
1. H
0
(null hypothesis): No segregation of QTL effects
(i.e. no linkage) and no linkage disequilibrium haplo-
type-QTL: .
2. H
1
: Complete linkage disequilibrium at the found-
ers: .
3. H
2
: Linkage equilibrium: .
4. H
3
: Incomplete linkage disequilibrium at the
founders: .
Illustrations
Numerical examples
We will show how the terms in both linear models are set
up. Consider the pedigree and markers in Table 1. We
assumed a distance of 30 cM between markers and a QTL
placed at the middle. Note that, assuming few recombina-
tions, transmissions in the pedigree are simple to follow.
From this information, it can be inferred that a recombi-
nation has occurred to form the sire gamete in 6.
LDLA regression
Consider sires 2 and 5 (assuming they are unrelated) and
phenotypes of offspring (4 to 6 for sire 2 and 7 and 8 for
sire 5). We need to set up the incidence matrix relating
β
to sires' haplotypes (Q
s
) and maternal-inherited haplo-
types (Q
m
). Let levels 1 to 4 in
β
represent haplotypes 00,
01, 10, 11. Then:
Assuming chromosome origins were established with cer-
tainty, probabilities of transmission are 0.98 for the non-
θθββ
= ( , , , )
,,
σσ
aanh
1
22
′′
′′ ′′
⎡
⎣
⎢
⎢
⎤
⎦
⎥
⎥
⎡
⎣
⎢
⎢
⎤
⎦
⎥
⎥
=
′
′
−−
−−
−
XR X XR ZQ
QZR X QZR ZQ
b
XR y
11
11
1
ˆ
ˆ
ββ
QQZR y
′
⎡
⎣
⎢
⎢
⎤
⎦
⎥
⎥
−1
(25)
σ
a
2
σ
ak,
2
ββ
==00
1
22
,
,,
σσ
aanh
…
ββ
≠=00
1
22
,
,,
σσ
aanh
…
ββ
=≠00
1
22
,
,,
σσ
aanh
…
ββ
≠≠00
1
22
,
,,
σσ
aanh
…
sm
=
⎡
⎣
⎢
⎢
⎢
⎢
⎢
⎤
⎦
⎥
⎥
⎥
⎥
⎥
=
0001
1000
0100
0001
0010
0100
0100
1000
1
and
0000
⎡
⎣
⎢
⎢
⎢
⎢
⎢
⎢
⎤
⎦
⎥
⎥
⎥
⎥
⎥
⎥
Table 1: Pedigree and markers for the numerical example
animal dam sire Maternal haplotype Paternal haplotype
100 10 01
200 11 00
300 01 11
412 10 00
532 01 11
632 01 01
725 00 11
825 00 01
Genetics Selection Evolution 2009, 41:43 />Page 9 of 17
(page number not for citation purposes)
recombinant and 0.02 for the recombinants (actually,
double recombinants) if markers were transmitted
together, or 0.5 if they were not. The matrix of PDQ's W
p
is thus:
There are four (twice the number of sires) gametic sire
effects . Last, Z
p
and Z
m
are 5 × 5 identity matrices for
records of individuals 4 to 8. Note that animal 5 is in the
analysis both as sire and as offspring. The final equations
(13) are thus:
Variance components mapping
In order to construct the mixed model equations we
assume certain values for the class substitution effects
β
' =
[0.9, 0.5, 0.5, 0.1] and for the within-class variances
= (0.09, 0.25, 0.25, 0.09) (in practice these val-
ues have to be estimated).
Expectation of gametic effects
Setting up the matrix Q for the founders implies just set-
ting the element corresponding to the j-th haplotype of
the i-th founder and the
δ
( ) class to 1, and all other to
zero. Gametic effects are ordered within each animal.
Then the first six rows of Q are:
where the first two rows correspond to animal 1, the next
two to animal 2, and so on. Let's take non-founder animal
4. Its rows in Q are the product of the corresponding
PDQ's times the rows in Q corresponding to their parents
2 (sire) and 1 (dam). That is:
The process is repeated for every individual. Individual 7
is descendant of two non-founders (sire is 5 and dam is
4), but the same logic applies.
Matrix Q is then:
Covariance matrix of gametic effects
To compute the variance we apply (19). For founders, var-
iances are for the first gamete in 1, for the sec-
ond, for the first gamete in 2, and so on. For non-
founders, let consider for example gamete 2 in individual
4 and gamete 2 in individual 6. Note that the terms
are contained in matrix Q above. If we apply
the formula and ignore null terms (those =
0):
W
p
=
⎡
⎣
⎢
⎢
⎢
002 098 0 0
098 002 0 0
050 050 0 0
00002098
00098002
⎢⎢
⎢
⎢
⎤
⎦
⎥
⎥
⎥
⎥
⎥
⎥
v
s
∗
y =
098 0 1 002 002 098 0 0
002 1 0 098 098 002 0 0
050 1 0 050 050 0
.
.
. 550 0 0
1 0020098 0 0 002098
1 0980002 0 0 098002
⎡
⎣
⎢
⎢
⎢
⎢
⎢
⎢
⎤
⎦
⎥
⎥
⎥
⎥⎥
⎥
⎥
⎡
⎣
⎢
⎤
⎦
⎥
+
ββ
v
e
s
σσ
aa1
2
4
2
,
h
i
j
Q
(: ,:)16
0010
0100
0001
1000
0100
0001
=
⎡
⎣
⎢
⎢
⎢
⎢
⎢
⎢
⎢
⎢
⎤
⎦
⎥
⎥
⎥
⎥
⎥
⎥
⎥
⎥
Q
(:,:)
78
00098002
002 098 0 0
0001
1000
0010
0100
=
⎡
⎣
⎢
⎤
⎦
⎥
⎡
⎣
⎢
⎢
⎢
⎢
⎢
⎤⎤
⎦
⎥
⎥
⎥
⎥
⎥
=
⎡
⎣
⎢
⎤
⎦
⎥
00020980
0980 0002
Q
(:,:)
1314
00002098
002 098 0 0
00980002
0020 0098
0
=
⎡
⎣
⎢
⎤
⎦
⎥
0002 098 0
0980 0002
096 0 002 002
00200200
⎡
⎣
⎢
⎢
⎢
⎢
⎢
⎤
⎦
⎥
⎥
⎥
⎥
⎥
=
()
96
⎡
⎣
⎢
⎤
⎦
⎥
after rounding
Q =
0010
0100
0001
1000
0100
0001
00020980
098 0 0 002
0 0 98 0 0 02
0
.002 0 0 0 98
0 0 98 0 0 02
050 0 0 050
096 0 002 002
0 02 0 02 0 0 96
09
.
.
.660002002
00960004
⎡
⎣
⎢
⎢
⎢
⎢
⎢
⎢
⎢
⎢
⎢
⎢
⎢
⎢
⎢
⎢
⎢
⎢
⎢
⎢
⎢
⎢
⎢
⎢
⎢
⎢
⎢
⎤
⎦
⎥
⎥
⎥
⎥
⎥
⎥
⎥
⎥
⎥⎥
⎥
⎥
⎥
⎥
⎥
⎥
⎥
⎥
⎥
⎥
⎥
⎥
⎥
⎥
⎥
⎥
σ
a3
2
σ
a2
2
σ
a4
2
Pr Q k
i
j
()←
Pr Q k
i
j
()←
Genetics Selection Evolution 2009, 41:43 />Page 10 of 17
(page number not for citation purposes)
and
We can see that the higher uncertainty in the origin of
results in a higher variance. As for the covariances, these
were computed using the algorithm of Wang et al. [26].
The final covariance matrix G is:
Simulations
Scenarios
First, four simulations were carried out to check the
behaviour of the different methods for fine mapping. We
used the LDSO software for the simulations (F. Ytournel,
pers. comm), a set of programs developed at INRA (T.
Druet, F. Guillaume, pers. comm.) for phase determina-
tion and computation of PDQs, and user-written pro-
grams for setting up and solving the linear models.
The first set of scenarios will be termed as "drift". Two sub-
scenarios differing on the size of the region of interest (5
or 20 cM) were designed. A 5 (alternatively, 20) cM region
with 21 SNP markers (i.e., 20 brackets), with a biallelic
QTL at position 2.125 (alternatively, 8.5) cM (at the mid-
dle of the 9th bracket). The QTL was biallelic with an
effect of 1 for the second allele. No foundational event
was assumed (i.e., marker and QTL alleles were assigned
at random in the ancestral population). SNP alleles were
assigned at random in the founders. This population
evolved during 100 generations with an effective size of
100. Therefore the only source of LD was drift. After these
populational events, a daughter design was simulated,
with 15 sires each with 20 daughters. Phenotypes were
simulated according to the QTL effects and to a residual
variance of 1; no polygenic effects were simulated. This is
a scenario where IBD methods are likely to perform well.
Although the design is fairly small for dairy cattle, it is not
unlikely for swine or sheep, and our purpose was not to
provide a large amount of information.
The second two scenarios ("admixture") are radically dif-
ferent and include strong admixture. Again, 5 and 20 cM
region are considered, with same positions for the QTL.
Initially, two breeds existed differing in their polygenic
average by 1. A QTL is considered with equal frequency in
each breed, with an effect of 1 for the second allele. SNP
alleles were assigned at random in the founders. Both
breeds were crossed and a mixed population of 50 indi-
viduals evolved during 20 generations. A daughter design
as before was simulated. Phenotypes were simulated
according to the QTL, the inherited polygenic part of each
breed, and a residual variance of 1. This scenario might
generate admixture by drift if one SNP locus is indicative
of breed origin.
Methods
We compared the performances of five different methods:
(1) LA: Haley-Knott linkage analysis [14], (2) LDLA: the
regression LDLA method in this work (equation 13), (3)
LD decay: LDLA regression by equation (14), that is,
ignoring the v* terms, (4) two-marker: regression on two-
marker haplotypes (i.e., association analysis), and (5) an
IBD method [3,34], which computes IBD among found-
ers based on all markers (Lee, pers. comm.).
The simplest approach is to perform single marker associ-
ation analysis, which has been shown to be as good as
more complex methods in quite a variety of scenarios
[35]. We nevertheless discarded this option because the
Var v Pr Q Pr Q Pr Q
Pr
a
()()((()()))
(
4
2
4
2
1
2
14
2
14
2
4
2
114=←+−←−←+
σβ β β
QQPrQPrQ
a4
2
4
2
44
2
14
2
4
2
414
002009 09
← +−←−← =
+
)( ( ( ) ( ) ) )
.(. (.
σβ β β
−−×−× +
+− ×− ×
002 09 098 01
098009 01 002 09 098 01
2
2
))
.(. (. . . . .))== 0 1025.
Var v Pr Q Pr Q Pr Q
Pr
a
()()((()()))
(
6
2
6
2
1
2
16
2
16
2
4
2
114=←+−←−←+
σβ β β
QQPrQPrQ
a6
2
4
2
46
2
16
2
4
2
414
05009 09
← +−←−← =
+−
)( ( ( ) ( ) ) )
.(. (.
σβ β β
005 09 05 01
05009 01 05 09 05 01 025
2
2
))
.(. (. . . . .)) .
×−× +
+−×−× =
Q
6
2
G
(:, : )
18
02500000002450
00250000000050
00009000000002
0
=
00 0 0 090 0 0 0 0 088
00000250000
00000009000
024500050000025
.
.
.000
0 0 0 002 0 088 0 0 0 0 103
00000245000200
0 0 0 088 0 002 0 0 0 0 00
.
.44
00000245000200
0 0 0 045 0 045 0 0 0 0 045
0 005 0 0 002 0 086 0 0 0
.
.0005 0 100
0 0 0 086 0 002 0 005 0 0 0 003
0 005 0 0 002 0 086 0 0 0 005 0
.
.
1100
0 0 0 002 0 0 240 0 002 0 0
⎡
⎣
⎢
⎢
⎢
⎢
⎢
⎢
⎢
⎢
⎢
⎢
⎢
⎢
⎢
⎢
⎢
⎢
⎢
⎢
⎢
⎢
⎢
⎢
⎢
⎢
⎢
⎤
⎦
⎥
⎥
⎥
⎥
⎥
⎥⎥
⎥
⎥
⎥
⎥
⎥
⎥
⎥
⎥
⎥
⎥
⎥
⎥
⎥
⎥
⎥
⎥
⎥
⎥
⎥
=G
(:, : )
.
916
0 0 0 0 0 005 0 0 005 0
00000000
000088 0 0 045 0 002 0 086 0 002 0 002
0 0 002 0 0 045 0 086 0 002 0 086 0
.
00 245 0 0 245 0 0 0 005 0 0 240
00020000200000002
0 0 0 00005000
.
005 0
0 0 004 0 0 045 0 100 0 003 0 100 0
0 250 0 0 240 0 0 0 005 0 0 245
00
.
103 0 0 045 0 003 0 100 0 003 0 002
0 240 0 0 250 0 0 0 005 0 0 235
000045 0 0 250 0 044 0 044 0 044 0 001
0 0 003 0 0 044 0 108 0 003 0 099 0
00 005 0 100 0 005 0 044 0 003 0 108 0 003 0 007
0 0 003 0 0 044 0 099
00 003 0 108 0
0 245 0 002 0 235 0 001 0 0 007 0 0 250
. .
⎡
⎣
⎢
⎢
⎢
⎢
⎢
⎢
⎢
⎢
⎢
⎢
⎢
⎢
⎢⎢
⎢
⎢
⎢
⎢
⎢
⎢
⎢
⎢
⎢
⎢
⎢
⎢
⎤
⎦
⎥
⎥
⎥
⎥
⎥
⎥
⎥
⎥
⎥
⎥
⎥
⎥
⎥
⎥
⎥
⎥
⎥
⎥
⎥
⎥
⎥
⎥
⎥
⎥
⎥
Genetics Selection Evolution 2009, 41:43 />Page 11 of 17
(page number not for citation purposes)
simulation method places the QTL in the middle of a
bracket. This automatically penalizes the single-marker
analysis. Further, by using always two markers we can
compare all methods in the same grounds (except IBD).
For the two-marker and IBD method, phases were
assumed to be known with certainty; this might have
resulted in slightly optimistic results. Performance of the
different methods was based on the average error (i.e., the
bias, in cM) and the mean square error (MSE, in cM
2
). All
simulated populations had a minor allele frequency of 0.1
at least for the QTL. One hundred replicates were run.
Results
Tables 2 and 3 show the results of the simulations for the
"drift" scenario and Tables 4 and 5 for the "admixture"
scenario.
In the "drift" scenario, LA and IBD methods are biased for
the 5 cM scenario, and the IBD method is biased for the
20 cM scenario. The ranking of the methods changes with
the scenario, with LA being always the worst in accuracy,
as expected. The reason of the inability of LA to map the
QTL is simple: in small intervals, recombinations - which
are needed for LA to map a QTL-seldom occur. Thus, in
the 5 cM scenario, the performance of LA is roughly equiv-
alent to random mapping of the QTL. For the remaining
methods, differences are indeed largely non-significant
except for the bias.
Figure 1 shows a plot of estimated locations in the 100
simulations vs the QTL position in the "drift 5 cM" sce-
nario. From the graph, it is clear that the IBD method
tends towards the center of the haplotype, whereas the
other methods are the less biased. The LDLA method is
somewhere in the middle.
Figure 2 shows the interval mapping profile of the p-value
along the chromosome for four replicates of the "drift 5
cM" scenario. It can be seen that the signal of association
(i.e. two-marker) is considerably smoothed by the LDLA
and IBD methods; this might compromise detection
power (not addressed here). It is also apparent that the
IBD methods look like a weighted average of signals of
close markers; this results in smoothing but also in uncer-
tainty.
Most of these results are due to the multimarker nature, in
this order, of LA, IBD and LDLA, which might tend to
point central regions since, in these, haplotypes are more
informative and PDQ's are better calculated. This is allevi-
ated in the LDLA method and LD decay method by the
implicit two-marker association analysis.
As for the admixture scenario, Table 4 shows basically that
QTL location cannot be accurately estimated. The reason
is that the scenario is not informative enough due to the
low number of historical recombinations and the noise
added by admixture. Differences in performances (MSE)
of the different methods are not statistically significant;
however, LA, LDLA and LD decay do show some bias.
The 20 cM admixture scenario (Table 5) shows much
worse performance of the mapping methods than in the
drift scenario; and this, for the same reasons as above: few
historical recombinations and noise added by admixture.
LA is the worst method in terms of MSE, whereas the LD
decay method is the best. However, differences are not sig-
Table 2: Performance of five fine-mapping methods in drift and a
5 cM segment.
Method Bias MSE
LA 0.29 (0.15) 2.22 (0.22)
LDLA 0.06 (0.08) 0.67 (0.09)
LD decay 0.11 (0.08) 0.69 (0.10)
Two-marker 0.13 (0.08) 0.66 (0.10)
IBD 0.34 (0.08) 0.78 (0.15)
Bias and mean square error (in cM and cM
2
) (with standard errors) of
five fine-mapping methods: linkage analysis, joint association and
linkage analysis, linkage disequilibrium decay, two-marker association,
and an IBD method. The scenario is drift and a 5 cM segment spanned
with 21 SNP markers.
Table 3: Performance of five fine-mapping methods in drift and a
20 cM segment.
Method Bias MSE
LA 0.51 (0.44) 19.61 (2.89)
LDLA -0.18 (0.26) 7.06 (1.65)
LD decay -0.12 (0.24) 5.68 (1.52)
Two-marker -0.05 (0.24) 5.89 (1.41)
IBD 1.20 (0.19) 5.14 (1.51)
Bias and mean square error (in cM and cM
2
) (with standard errors) of
five fine-mapping methods: linkage analysis, joint association and
linkage analysis, linkage disequilibrium decay, two-marker association,
and an IBD method. The scenario is drift and a 20 cM segment
spanned with 21 SNP markers.
Table 4: Performance of five fine-mapping methods in admixture
and a 5 cM segment.
Method Bias MSE
LA 0.42 (0.14) 2.06 (0.21)
LDLA 0.31 (0.14) 2.15 (0.23)
LD decay 0.31 (0.14) 2.02 (0.21)
Two-marker 0.16 (0.13) 1.82 (0.18)
IBD 0.23 (0.13) 1.69 (0.20)
Bias and mean square error (in cM and cM
2
) (with standard errors) of
five fine-mapping methods: linkage analysis, joint association and
linkage analysis, linkage disequilibrium decay, two-marker association,
and an IBD method. The scenario is admixture and a 5 cM segment
spanned with 21 SNP markers.
Genetics Selection Evolution 2009, 41:43 />Page 12 of 17
(page number not for citation purposes)
nificant, and no clear conclusions can be drawn. The pro-
files in Figure 3 are indeed very chaotic, and they would
be difficult to interpret in real-life experiments.
Discussion
Comparison to other models for LDLA
We have presented a method for joint association and
linkage, which belongs to a more general class of joint
linkage disequilibrium and linkage analysis. In fact, exist-
ing methods belong to one of two exclusive classes: those
that model somehow the LD phenomena and those that
do not.
Some models [5,6] assumed a mutation followed by
expansion of the mutant haplotype. The pertinency of this
scenario in general agricultural populations (and indeed
in complex diseases in humans) is arguable. The likeli-
hood in Farnir et al. [5] was an approximation, based on
the assumption of independence among contiguous
markers; and the form of the likelihood was only appro-
priate for family designs. The more complex model in
Pérez-Enciso [6] holds for any pedigree structure below
the founders, but computations were difficult.
Models for association and linkage in human populations
exist [1,36]. These, although very similar to our approach,
are difficult to apply to livestock since they are rigidly fam-
ily-structured; in addition, the QTDT [1] uses unilocus
information only for transmission events, whereas in our
model it is possible and recommended to use multi-
locus information to compute the PDQ's, and it is possi-
ble (but perhaps not useful) to define haplotype classes
spanning several loci. Conversely, the QTDT has no need
of PDQ calculation or - possibly - map ordering of SNPs.
The most popular model for LDLA QTL detection in live-
stock has been reported by Meuwissen et al. [3] and has
been fairly used [20,37]. The method relies on the con-
struction of a matrix of covariances among founders (the
so-called IBD probabilities), say H, based on identity of
state among markers; these IBD probabilities are derived
following approximate coalescent models [8,9,38,39].
IBD methods use the same parameter (the variance
assigned to the QTL) for both covariance due to associa-
tion and covariance due to linkage. Modelling linkage and
association using different parameters (
β
and v) allows for
a greater flexibility in our model. This can be explained as
follows.
Relationship of the IBD method for LDLA to our approach
Suppose we have two marker loci flanking a QTL. Assume
that LD is generated by some random process such as drift
or mutation. Then, given this LD generation (LG) event,
the expected value of the effect of gamete j for a founder
individual i is denoted by
For SNP markers, there will be four possible values for the
haplotypes. Let
β
denote the vector of the four
β
k
varia-
bles. In our approach,
β
is treated as a fixed effect. How-
ever, over LG events,
β
can be thought of as random.
Suppose the LG process is such that the expected value of
β
over LG events is
and the covariance matrix of
β
over LG events is
The matrix Σ will depend of the LG process, and in the
IBD method of Meuwissen and Goddard [8,9], it is the
matrix of IBD probabilities at the QTL conditional on the
observed marker data. Thus, when marginalized over the
LG events, the mean and variance of
β
k
do not depend on
the marker haplotype. Similarly, the marginal (or uncon-
ditional) variance of does not depend on the marker
haplotype, and it is denoted by It follows that the
unconditional variance of
is
Now, using notation in our paper, the covariance matrix
of gametic effects of the founders can be written as
The covariance matrix for the entire vector of gametic
effects can be computed, recursively, using equation (20)
βδ
k
i
j
i
j
vhkLG==E( | ( ) , ).
(26)
E( ) ,
ββ
= 1
γ
(27)
Var( ) .
ββ
= ΣΣ
σ
LD
2
(28)
v
i
j
σ
v
2
vv
i
j
i
j
k
∗
=−
β
Var( ) .v
i
j
vLD
∗
=−
σσ
22
Var( ) ( ).vQQ I
fffLDvLD
=
′
+−ΣΣ
σσσ
222
(29)
Table 5: Performance of five fine-mapping methods in admixture
and a 20 cM segment.
Method Bias MSE
LA 0.58 (0.60) 36.60 (3.42)
LDLA 0.97 (0.53) 28.43 (3.06)
LD decay 0.04 (0.49) 23.76 (2.56)
Two-marker 0.17 (0.51) 25.89 (2.50)
IBD 1.94 (0.50) 28.78 (3.43)
Bias and mean square error (in cM and cM
2
) (with standard errors) of
five fine-mapping methods: linkage analysis, joint association and
linkage analysis, linkage disequilibrium decay, two-marker association,
and an IBD method. The scenario is admixture and a 20 cM segment
spanned with 21 SNP markers.
Genetics Selection Evolution 2009, 41:43 />Page 13 of 17
(page number not for citation purposes)
in our paper, starting with the covariance matrix in equa-
tion (29). If there is no LD, will be zero and (29) will
reduce to the , which is the covariance matrix under
LE. Also, (29) depends on two variance components that
relate to the gametic variance due to LD and the remain-
der. In the IBD method [8,9], Var(v
f
) is written as ,
where H is an IBD matrix with diagonals equal to 1 and
off-diagonals given by . Thus, in the IBD method
[8,9] the partitioning of the gametic variance due to LD
and the remainder is entirely dependent of the assump-
tions underlying the computation of Σ.
A practical problem using IBD methods (our experience is
with the IBD methods [3]), is that often matrix H turns
out to be negative definite; hence the likelihood of the
phenotypes is undefined. The reason is that construction
of H is not based on a joint distribution for all founder
chromosomes, but it is computed for two haplotypes (or
chromosomes) at a time, marginalizing over the rest. This
leads to approximate marginal probabilities in H instead
of a joint distribution. Thus, the estimated H matrix is at
best an approximation. A way to deal with non-positive
definiteness is bending [40], or clustering (a data reduc-
tion technique) [20]. Both approaches might result in a
loss of information, have unknown statistical properties
and are subject to arbitrary tuning parameters.
At any rate, both modelling the LD phenomena and IBD
based models rely in assumed population events. The
robustness of these methods to, for example, admixtured
breeds, is largely unknown and difficult to verify. Our
model and those by Fernando et al. and Gilbert et al.
[30,41] do not model the process generating LD among
QTL and markers, and therefore are more general. The
only strong assumption that they made was that of a bial-
lelic QTL, which is overcome in ours, at the price of a
greater number of unknowns.
Originality
The originality of our approach is that (i) it is feasible and
well-taylored for some agricultural populations, in partic-
ular livestock (because it relies on phase and transmission
σ
LD
2
I
σ
v
2
H
σ
Q
2
ff
ΣΣ
′
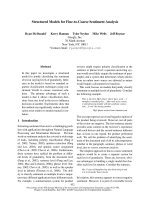
Errors of five fine-mapping methods in drift and a 5 cM segmentFigure 1
Errors of five fine-mapping methods in drift and a 5 cM segment. Errors (in cM) in location of the QTL by the differ-
ent methods - drift and 5 cM scenario. The small triangle is the center of the segment; the small diamond is the QTL location.
012345
LA LDLA LD decay two−marker IBD
Genetics Selection Evolution 2009, 41:43 />Page 14 of 17
(page number not for citation purposes)
information easily ascertainable, and holds for any family
structure) and corn (where indeed a similar idea nested
association has been developed [42]), (ii) it is a linear
model (with all the adequate machinery), while (iii) at
the same time providing, based on expectations and cov-
ariances, a simple and coherent linear-models framework
for association and linkage and (iv) reduces to well-
known models on the hypothesis of LE or complete LD.
Indeed, our models allows us to test the four relevant
hypotheses (disequilibrium, linkage, both or none) and
reduces to association or linkage under the respective
hypothesis, which is not the case for other methods such
as IBD models for example, which assume that LD exists.
Our method is computationally simple to use, provided
that phases and PDQ's can be accurately calculated. If this
is not the case, inference is possible, in principle, by inte-
grating over all the joint distribution of phases and trans-
missions. After phase determination and computation of
PDQs, all the machinery of the linear models can be
applied. This makes it possible to include simultaneously
other effects (environmental effects, polygenic effects)
and the use of other tools such as permutation tests, boot-
strapping and in particular the simultaneous fit of several
QTLs [43]. The latter one is of particular interest for recent
developments in genome-wide genetic evaluation
("genomic selection") using LDLA. For example, the
number of simultaneous effects fitted by Calus et al. [44]
was ~ 600,000 for two-marker haplotypes in a genome
composed of ~ 2300 markers. If a "LD decay model" is
used (such as equation 25) the number of equations is lin-
ear in the number of loci, while retaining the use of LD
and of some of the LA. Even with the full linkage and asso-
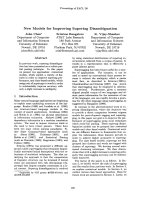
Interval mapping profiles in the drift and 5-cM scenarioFigure 2
Interval mapping profiles in the drift and 5-cM scenario. Interval mapping profiles (minus log of the p-value) in four rep-
licates of the drift and 5-cM scenario. LA: dotted line. LDLA: continuous line. LD decay: red, stars. Two-marker: blue, triangles.
IBD: grey dot-dash line. A diamond indicates the QTL location.
012345
0 1020304050
012345
0 1020304050
012345
0 1020304050
012345
0 1020304050
Genetics Selection Evolution 2009, 41:43 />Page 15 of 17
(page number not for citation purposes)
ciation model (equation 24), sparsity of the mixed model
equations is guaranteed.
A practical problem with the method is how to define
"classes" of haplotypes; for example, how many markers
to include in the definition of the classes. Including more
markers in the definition of the haplotype is straightfor-
ward, but probably at the price of greater complexity. The
optimal number of markers seems scenario dependent
[12,35]. A practical rule of thumb is to define classes that
are manageable - that is, not too many. For example,
Druet et al. [45] considered haplotypes spanning either 3
or 10 markers, with a number of classes of 8 and 700,
respectively. The latter were too many and had to be clus-
tered. They observed that 3-marker haplotypes provided
narrower intervals than 10-marker haplotypes, at the pos-
sible price of more false-positive detections. With multial-
lelic markers the two-loci classes might be impractical.
Two options might be (i) to consider the closest microsat-
ellite, or (ii) to split the effect of a haplotype class in a sum
of individual marker locus effects. In this option a
descendant of haplotype, say, "13" with probability w
would be in expectation w times the effect of allele 1 at the
first locus, plus w times the effect of allele 3 at the second
locus.
Interval mapping profiles in the drift and 20-cM scenarioFigure 3
Interval mapping profiles in the drift and 20-cM scenario. Interval mapping profiles (minus log of the p-value) in four
replicates of the admixture and 20-cM scenario. LA: dotted line. LDLA: continuous line. LD decay: red, stars. Two-marker:
blue, triangles. IBD: grey dot-dash line. A diamond indicates the QTL location.
0 5 10 15 20
0 5 10 15
0 5 10 15 20
0 5 10 15
0 5 10 15 20
0 5 10 15
0 5 10 15 20
0 5 10 15
Genetics Selection Evolution 2009, 41:43 />Page 16 of 17
(page number not for citation purposes)
Performance of the method
Computations for any of the regression methods (LA,
LDLA, LD decay and two-marker) were extremely fast. For
the case of LDLA, computing one position took 0.02 sec-
onds. For the IBD method, each position took about 40
seconds.
Results show no clear ranking of methods. Indeed, the fact
that the IBD method is often biased deserves further atten-
tion for small chromosomal segments, albeit its good per-
formance in the drift 20-cM simulation shows the value of
multi-marker information in relatively sparse maps. The
LD decay method is possibly the best across all scenarios,
but the two-marker regression analysis is almost as good.
Zhao et al. [35] have shown that the even simpler method
of single-marker regression performed slightly better than
two-marker regression. Thus, future work should compare
our methods (LDLA or LD decay) with single-marker asso-
ciation.
The admixture simulation shows basically that the extra
noise generated affected all methods for localization of
QTLs; whether this holds for detection remains to be seen.
Thus, more extensive simulations need to be undertaken
to compare accuracy, power, and robustness to spurious
associations of the different methods.
It seems, nevertheless, that our linear model (LDLA or LD
decay) is at least as good in performance as the IBD
method, while keeping simplicity. In fact, for small chro-
mosomal segments, association between QTL and mark-
ers is very informative [12,39]. As an aside, simulations
should not place the QTL at the center of the segment as
this hides bias of the methods and artificially decreases
MSE.
It is expected that, for narrower and narrower marker
intervals, most information will be captured by the LD
term and less by the LA terms. At the limit, if the QTL is
the marker, the variance for the gametic effect v (v*) will
be null and all information will be contained in
β
. On the
other hand, for very distant markers, variance of v will be
high and
β
will tend to zero. Still, linkage will still be used
in modelling the pedigree transmission of fully associated
marker effects.
Conclusion
We have presented simple linear models for QTL detec-
tion and localization including populational linkage dis-
equilibrium and within-family cosegregation. The
methods uses all available information (i.e., multiple
markers and pedigrees). The performance of these meth-
ods is satisfactory, as shown by simulations. These meth-
ods are computationally much simpler than other
proposals. Extensions to multiple QTL mapping and
genomic selection are straightforward. These methods
should help researchers in QTL mapping and marker
assisted selection, in particular in livestock species, where
the required information is available, just like regression
is more used than full-likelihood methods [14], when
possible.
Competing interests
The authors declare that they have no competing interests.
Authors' contributions
AL and RF derived the theory and wrote the text. AL per-
formed the simulations and the numerical examples.
Acknowledgements
This work benefit from a visit of the first author to Iowa State University,
financed by the International Relations Department, INRA, and by News-
ham Choice Genetics. Support from EU research project SABRE is grate-
fully acknowledged (Legarra). Support from the National Research Initiative
Competitive Grants Program of the U.S. Department of Agriculture,
Award 2007-35205-17862 is gratefully acknowledged (Fernando). This
work has much benefited from discussions with Jean-Michel Elsen, Hélène
Gilbert, Brigitte Mangin and Magali San Cristobal. We are also grateful to
Jean-Michel Elsen for carefully reading the manuscript. Reviewer's sugges-
tions and corrections are gratefully acknowledged.
References
1. Abecasis GR, Cardon LR, Cookson WOC: A general test of asso-
ciation for quantitative traits in nuclear families. Am J Hum
Genet 2000, 66:279-292.
2. Yu J, Pressoir G, Briggs WH, Bi IV, Yamasaki M, Doebley JF, McMullen
MD, Gaut BS, Nielsen DM, Holland JB, Kresovich S, Buckler ES: A
unified mixed-model method for association mapping that
accounts for multiple levels of relatedness. Nat Genet 2006,
38:203-208.
3. Meuwissen THE, Karlsen A, Lien S, Olsaker I, Goddard ME: Fine
mapping of a quantitative trait locus for twinning rate using
combined linkage and linkage disequilibrium mapping. Genet-
ics 2002, 161:373-379.
4. Dupuis J, Siegmund DO, Yakir B: A unified framework for linkage
and association analysis of quantitative traits. Proc Natl Acad Sci
USA 2007, 104:20210-20215.
5. Farnir F, Grisart B, Coppieters W, Riquet J, Berzi P, Cambisano N,
Karim L, Mni M, Moisio S, Simon P, Wagenaar D, Vilkki J, Georges M:
Simultaneous mining of linkage and linkage disequilibrium to
fine map quantitative trait loci in outbred half-sib pedigrees:
revisiting the location of a quantitative trait locus with major
effect on milk production on bovine chromosome 14. Genetics
2002, 161:275-287.
6. Pérez-Enciso M: Fine mapping of complex trait genes combin-
ing pedigree and linkage disequilibrium information: a Baye-
sian unified framework. Genetics 2003, 163:1497-1510.
7. Rannala B, Slatkin M: Methods for multipoint disease mapping
using linkage disequilibrium. Genet Epidemiol 2000, 19(Suppl
1):S71-S77.
8. Meuwissen THE, Goddard ME: Fine mapping of quantitative
trait loci using linkage disequilibria with closely linked
marker loci. Genetics 2000, 155:421-430.
9. Meuwissen THE, Goddard ME: Prediction of identity by descent
probabilities from marker-haplotypes. Genet Sel Evol 2001,
33:605-634.
10. Boitard S, Abdallah J, de Rochambeau H, Cierco-Ayrolles C, Mangin
B: Linkage disequilibrium interval mapping of quantitative
trait loci. BMC Genomics 2006, 7:54.
11. Abdallah JM, Mangin B, Goffinet B, Cierco-Ayrolles C, Perez-Enciso
M: A comparison between methods for linkage disequilib-
rium fine mapping of quantitative trait loci. Genet Res 2004,
83:41-47.
Publish with BioMed Central and every
scientist can read your work free of charge
"BioMed Central will be the most significant development for
disseminating the results of biomedical research in our lifetime."
Sir Paul Nurse, Cancer Research UK
Your research papers will be:
available free of charge to the entire biomedical community
peer reviewed and published immediately upon acceptance
cited in PubMed and archived on PubMed Central
yours — you keep the copyright
Submit your manuscript here:
/>BioMedcentral
Genetics Selection Evolution 2009, 41:43 />Page 17 of 17
(page number not for citation purposes)
12. Grapes L, Dekkers JCM, Rothschild MF, Fernando RL: Comparing
linkage disequilibrium-based methods for fine mapping
quantitative trait loci. Genetics 2004, 166:1561-1570.
13. Kruglyak L: The road to genome-wide association studies. Nat
Rev Genet 2008, 9:314-318.
14. Knott SA, Elsen JM, Haley CS: Methods for multiple-marker
mapping of quantitative trait loci in half-sib populations.
Theor Appl Genet 1996, 93:71-80.
15. Fernando RL, Grossman M: Marker assisted prediction using
best linear unbiased prediction. Genet Sel Evol 1989, 21:467-477.
16. Baret PV, Knott SA, Visscher PM: On the use of linear regression
and maximum likelihood for QTL mapping in half-sib
designs. Genet Res 1998, 72:149-158.
17. Mangin B, Goffinet B, Le Roy P, Boichard D, Elsen JM: Alternative
models for QTL detection in livestock. II. Likelihood approx-
imations and sire marker genotype estimations. Genet Sel Evol
1999, 31:225-237.
18. Heath S: Markov chain Monte Carlo segregation and linkage
analysis for oligogenic models. Am J Hum Genet 1997,
61:748-760.
19. Elsen JM, Mangin B, Goffinet B, Boichard D, Le Roy P: Alternative
models for QTL detection in livestock. I. General introduc-
tion. Genet Sel Evol 1999, 31:213-224.
20. Blott S, Kim JJ, Moisio S, Schmidt-Küntzel A, Cornet A, Berzi P, Cam-
bisano N, Ford C, Grisart B, Johnson D, Karim L, Simon P, Snell R,
Spelman R, Wong J, Vilkki J, Georges M, Farnir F, Coppieters W:
Molecular dissection of a quantitative trait locus: a phenyla-
lanine-to-tyrosine substitution in the transmembrane
domain of the bovine growth hormone receptor is associ-
ated with a major effect on milk yield and composition.
Genetics 2003, 163:253-266.
21. Li J, Zhou Y, Elston RC: Haplotype-based quantitative trait
mapping using a clustering algorithm. BMC Bioinformatics 2006,
7:258.
22. Thompson EA, Heath S:
Estimation of conditional multilocus
gene identity among relatives. In Statistics in Molecular Biology and
Genetics: Selected Proceedings of a 1997 Joint AMS-IMS-SIAM Summer
Conference on Statistics in Molecular Biology, of IMS Lecture Note-Mono-
graph Series Volume 33. Edited by: Seillier-Moiseiwitsch F. Institute of
Mathematical Statistics (Hayward, CA); 1999:95-113.
23. Qian D, Beckmann L: Minimum-recombinant haplotyping in
pedigrees. Am J Hum Genet 2002, 70:1434-1445.
24. Windig JJ, Meuwissen THE: Rapid haplotype reconstruction in
pedigrees with dense marker maps. J Anim Breed Genet 2004,
121:26-39.
25. Abraham KJ, Totir LR, Fernando RL: Improved techniques for
sampling complex pedigrees with the Gibbs sampler. Genet
Sel Evol 2007, 39:27-38.
26. Wang T, Fernando RL, Vanderbeek S, Grossman M, Vanarendonk
JAM: Covariance between relatives for a marked quantitative
trait locus. Genet Sel Evol 1995, 27:251-274.
27. Grignola FE, Hoeschele I, Tier B: Mapping quantitative trait loci
in outcross populations via residual maximum likelihood .1.
Methodology. Genet Sel Evol 1996, 28:479-490.
28. Almasy L, Blangero J: Multipoint quantitative-trait linkage anal-
ysis in general pedigrees. Am J Hum Genet 1998, 62:1198-1211.
29. Fernando R, Totir L: Incorporating molecular information in
breeding programmes: methodology. In Poultry genetics, breed-
ing and biotechnology Edited by: Muir W, Aggrey S. Wallingford: CAB
International; 2003:537-548.
30. Fernando RL: Incorporating molecular markers into genetic
evaluation. Book of abstracts of the 55th Annual Meeting of the Euro-
pean Association for Animal Production, Bled, Slovenia 2004, 10:86.
31. Quaas RL: Additive genetic model with groups and relation-
ships. J Dairy Sci 1988, 71:1338-1345.
32. Goddard ME: A mixed model for analyses of data on multiple
genetic-markers. Theor Appl Genet
1992, 83:878-886.
33. Pérez-Enciso M, Varona L: Quantitative trait loci mapping in F2.
crosses between outbred lines. Genetics 2000, 155:391-405.
34. Lee SH, Werf JHJ van der: An efficient variance component
approach implementing an average information REML suit-
able for combined LD and linkage mapping with a general
complex pedigree. Genet Sel Evol 2006, 38:25-43.
35. Zhao HH, Fernando RL, Dekkers JCM: Power and precision of
alternate methods for linkage disequilibrium mapping of
quantitative trait loci. Genetics 2007, 175:1975-1986.
36. Almasy L, Williams JT, Dyer TD, Blangero J: Quantitative trait
locus detection using combined linkage/disequilibrium anal-
ysis. Genet Epidemiol 1999, 17(Suppl 1):S31-S36.
37. Gautier M, Barcelona RR, Fritz S, Grohs C, Druet T, Boichard D,
Eggen A, Meuwissen THE: Fine mapping and physical character-
ization of two linked quantitative trait loci affecting milk fat
yield in dairy cattle on BTA26. Genetics 2006, 172:425-436.
38. Hill WG, Hernández-Sánchez J: Prediction of multilocus identity-
by-descent. Genetics 2007, 176:2307-2315.
39. Meuwissen THE, Goddard ME: Multipoint identity-by-descent
prediction using dense markers to map quantitative trait loci
and estimate effective population size. Genetics 2007,
176:2551-2560.
40. Hayes JF, Hill WG: Modification of estimates of parameters in
the construction of genetic selection indices ('bending'). Bio-
metrics 1981, 37:483-493.
41. Gilbert H, Firat MZ, Totir LR, Dekkers JCM, Fernando RL: A new
method to fine mappinf quantitative trait locus using linkage
disequilibrium. Book of abstracts of the 55th Annual Meeting of the
European Association for Animal Production, Bled, Slovenia 2004, 10:87.
42. Yu J, Holland JB, McMullen MD, Buckler ES: Genetic design and
statistical power of nested association mapping in maize.
Genetics 2008, 178:539-551.
43. Verbyla AP, Cullis BR, Thompson R: The analysis of QTL by
simultaneous use of the full linkage map. Theor Appl Genet 2007,
116:95-111.
44. Calus MPL, Meuwissen THE, de Roos APW, Veerkamp RF: Accu-
racy of genomic selection using different methods to define
haplotypes. Genetics 2008, 178:553-561.
45. Druet T, Fritz S, Boussaha M, Ben-Jemaa S, Guillaume F, Derbala D,
Zelenika D, Lechner D, Charon C, Boichard D, Gut IG, Eggen A, Gau-
tier M: Fine mapping of quantitative trait loci affecting female
fertility in dairy cattle on BTA03 using a dense single-nucle-
otide polymorphism map. Genetics 2008, 178:2227-2235.