Báo cáo sinh học: "Mapping quantitative trait loci (QTL) in sheep. II. Meta-assembly and identification of novel QTL for milk production traits in sheep" docx
Bạn đang xem bản rút gọn của tài liệu. Xem và tải ngay bản đầy đủ của tài liệu tại đây (1.18 MB, 15 trang )
BioMed Central
Page 1 of 15
(page number not for citation purposes)
Genetics Selection Evolution
Open Access
Research
Mapping quantitative trait loci (QTL) in sheep. II. Meta-assembly
and identification of novel QTL for milk production traits in sheep
Herman W Raadsma*, Elisabeth Jonas, David McGill, Matthew Hobbs,
Mary K Lam and Peter C Thomson
Address: ReproGen - Animal Bioscience Group, Faculty of Veterinary Science, University of Sydney, 425 Werombi Road, Camden NSW 2570,
Australia
Email: Herman W Raadsma* - ; Elisabeth Jonas - ;
David McGill - ; Matthew Hobbs - ; Mary K Lam - ;
Peter C Thomson -
* Corresponding author
Abstract
An (Awassi × Merino) × Merino backcross family of 172 ewes was used to map quantitative trait
loci (QTL) for different milk production traits on a framework map of 200 loci across all
autosomes. From five previously proposed mathematical models describing lactation curves, the
Wood model was considered the most appropriate due to its simplicity and its ability to determine
ovine lactation curve characteristics. Derived milk traits for milk, fat, protein and lactose yield, as
well as percentage composition and somatic cell score were used for single and two-QTL
approaches using maximum likelihood estimation and regression analysis. A total of 15 significant
(P < 0.01) and additional 25 suggestive (P < 0.05) QTL were detected across both single QTL
methods and all traits. In preparation of a meta-analysis, all QTL results were compared with a
meta-assembly of QTL for milk production traits in dairy ewes from various public domain sources
and can be found on the ReproGen ovine gbrowser />gbrowse/oaries_genome/. Many of the QTL for milk production traits have been reported on
chromosomes 1, 3, 6, 16 and 20. Those on chromosomes 3 and 20 are in strong agreement with
the results reported here. In addition, novel QTL were found on chromosomes 7, 8, 9, 14, 22 and
24. In a cross-species comparison, we extended the meta-assembly by comparing QTL regions of
sheep and cattle, which provided strong evidence for synteny conservation of QTL regions for milk,
fat, protein and somatic cell score data between cattle and sheep.
Background
Sheep represent an economically important agricultural
resource in the global meat, fibre, and milk production
systems of both the developed and developing world. The
multi-purpose nature of many sheep breeds and the
highly specialised single purpose breeds, demonstrate the
versatility and suitability of sheep production in a diverse
set of production systems [1]. Sheep milk production rep-
resents a specialised commodity which has been devel-
oped across many breeding systems in either dual
purpose, synthetic composite lines, or specialised dairy
breeds such as the Awassi, Chios, Comisana, Lacaune,
Laxta and Sarda Breeds [2]. Genetic variation has been
reported for most of the major milk traits, and has been
Published: 22 October 2009
Genetics Selection Evolution 2009, 41:45 doi:10.1186/1297-9686-41-45
Received: 2 July 2009
Accepted: 22 October 2009
This article is available from: />© 2009 Raadsma et al; licensee BioMed Central Ltd.
This is an Open Access article distributed under the terms of the Creative Commons Attribution License ( />),
which permits unrestricted use, distribution, and reproduction in any medium, provided the original work is properly cited.
Genetics Selection Evolution 2009, 41:45 />Page 2 of 15
(page number not for citation purposes)
successfully exploited in genetic improvement pro-
grammes for sheep dairy production [2-6].
Over the past few decades, numerous quantitative trait
loci (QTL) studies have been conducted on many breeds
of livestock to enrich our knowledge on the underlying
biology and genetic architecture of complex traits. A gen-
eral review of QTL mapping can be found in Weller [7].
However for milk production and udder health, fewer
QTL studies have been conducted [3,8-12] in dairy sheep
in comparison with cattle, as reviewed by Khatkar et al.
[13] and summarised on the animal genome website [14].
Analysis of QTL information from diverse sources within
a species provides important information on the consist-
ency and utility of QTL across breeds, and is amenable to
meta-analysis to reach a consensus on QTL location and
effect [13]. Furthermore, cross-species comparative analy-
ses with a species for which many QTL for the same traits
have been reported such as milk traits in cattle may pro-
vide additional insight to QTL in a closely related species.
This may give insight into ancestral genes for economi-
cally important traits and adds information to accelerate
fine-mapping in the QTL information-sparse species.
QTL mapping requires robust phenotypes. In the case of
lactation measurements, the nature of these data is heter-
ogeneous with respect to frequency, length and regularity
of recording. One approach is to use model-based predic-
tion to standardise lactation characteristics. The advan-
tages are that the heterogeneity mentioned above as well
as age, parity and other effects are taken into account by
producing a standardised curve, further facilitating mean-
ingful comparisons. Using model-based predictions
rather than empirical data has also the advantage of min-
imising random variation while simultaneously summa-
rising the lactation profile into biologically interpretable
parameters [15]. Therefore these derived parameters are
then useful for linkage studies since they describe lacta-
tion-wide or lifetime milk production. One of the first lac-
tation models used in dairy cattle was developed by Brody
et al. [16] and is based on an exponential decay function.
Further models were also proposed by Sikka [17], Wood
[18], Cobby and Le Du [19], and Cappio-Borlino et al.
[20]. By contrast, modelling lactation curves in dairy
sheep is far less common [21-25], but it is expected that
dairy cattle models can be applied to sheep lactations
[26].
This study reports an appropriate model to describe the
characteristics of the sheep lactation curve, provides addi-
tional information on QTL for milk traits in sheep, and
provides a within and cross-species QTL analysis from
publicly available information in sheep and cattle.
Methods
Resource population
As described by Raadsma et al. [27] a resource population
from crosses between the improved dairy type Awassi (A)
and the apparel wool Merino (M) sheep was established
to exploit the extreme differences between these two
sheep types in a range of production characteristics. The
improved Awassi sheep was developed in Israel and has
been identified as an ideal breed for milk production [28]
and possesses fleece characteristics suitable for carpet
wool, whilst the Merino sheep was originally developed
for the production of high quality apparel wool and
recently used for meat production [1] but is a poor milk
producer. The Merino breed [29,30] with its low milk
yield, and the Awassi breed with its medullated carpet-
wool quality represent two extremes for these production
traits. Further details on the development of the resource
population can be found in Raadsma et al. [27]. For mod-
elling the lactation curves, lactation data from different
generations, AMM backcross (AMM), AM_AMM double
backcross (DBC) and intercross (INT) progeny (n = 622),
were used. In the QTL study reported here, only genotypic
information from the 172 ewe G
2
AMM progeny of the
first F
1
sire were available where a genome-wide scan was
performed. The additional families will be used in future
work to confirm QTL effects and to fine-map confirmed
QTL in combination with high density SNP marker anal-
ysis.
Marker analysis
A genome-scan using 200 polymorphic microsatellite
markers covering all 26 autosomes was conducted in 172
backcross ewes. The markers comprised 112 cattle (Bos
taurus) markers, 73 sheep (Ovis aries) markers, and 15
other Bovinae markers. The procedures for DNA extrac-
tion, genotyping and allele calling, are described in detail
in the first paper of this series [27]. All markers used for
this study were the same as those used in the first paper of
the series, and were mapped to the previously described
population specific framework map [27].
Milk recording
Milk yields were recorded from morning and afternoon
milking from 1999 to 2007 (except from 2004 to 2006
when only one daily milking was conducted). These
yields were recorded using a Tru-Flow meter (Tru Flow
Industrial Pumps, Bathurst NSW Australia) in the first
phase until 2001 and subsequently with SRC-Tru Test
electronic meter (Tru-Test Pty Limited, Mentone VIC Aus-
tralia). Recordings were made daily in the first phase of
the study and subsequently three times per week in the
latter phase of the experiment. Milk from morning and
afternoon milking was sampled for composition analyses
to determine protein (PP), fat (FP), and lactose (LP) per-
centage and somatic cell count (SCC) in cells/mL. The
Genetics Selection Evolution 2009, 41:45 />Page 3 of 15
(page number not for citation purposes)
somatic cell score (SCS) was calculated as the natural log-
arithm of SCC. Samples were analysed by 'Dairy Express'
Australia [31].
Analysis of lactation data
Amongst a selection of lactation curve models that have
been proposed in the literature [16-20], the Wood [18]
model was selected here because of its simplicity and flex-
ibility to derive key parameters that can be used to
describe specific characteristics of the lactation curve.
From a cursory check it was not obvious that other models
provided a better fit to the data. The Wood model is
defined as follows:
where W(t) is the expected milk yield at time t expressed
in litres/day; t represents the time in days after parturition;
a is a scaling parameter related to total yield of lactation
with k = ln(a); parameter b is related to the rate of increase
prior to the lactation peak; and c is a parameter related to
the rate of increase after the lactation peak. From this
model, the cumulative milk yield up to day T (e.g. 100
days) can be calculated numerically as
where γ(·) is the lower incomplete gamma function,
, and can be evaluated by its rela-
tion to the cumulative distribution function of a gamma
distribution.
To fit lactation curve models to multiple sheep simultane-
ously, the Wood model was fitted using a nonlinear
mixed model by the nlme() function in R using the
methods documented in Pinheiro et al [32]. In this case
the model fitted is:
where y
it
is the milk yield at time t for sheep i, k
i
b
i
and c
i
are the Wood model "parameters" for sheep i; and ε
it
is the
random error of sheep i at time t. These sheep-specific
"parameters" can each be written as k
i
= κ
i
+ K
i
, b
i
= β
i
+ B
i
and c
i
= χ
i
+ C, where κ
i
,
β
i
and χ
i
are the fixed effects and
K
i
, B
i
and C
i
are random deviations from these fixed effect
means, assumed to have a multivariate normal distribu-
tion,
The non-zero covariance terms (σ
KB
, σ
KC
, σ
BC
) have been
included to allow for correlations amongst the "parame-
ters", as observed in initial exploratory analyses. Note that
the choice of the parameterisation of the Wood model as
(k, b, c) rather than as (a, b, c) was made based on the
closer approximation of the resultant deviations to a mul-
tivariate normal distribution. Also, the choice to analyse
the yield (y
it
) as a nonlinear mixed model, rather than
ln(y
it
) as a linear mixed model was made on the basis of
residual diagnostics. The output from this analysis was to
produce model-based 100-day cumulative milk yields for
each ewe-lactation, adjusted to a common set of fixed
effects. Preliminary studies using information of these
animals have shown that the 100-day lactation perform-
ance is highly correlated with the extended lactation (200
to 400 days), whereas 50 and 80 day lactation perform-
ances were unreliable in predicting extended lactation
performance (additional file 1). Therefore, due to the dif-
ferences in recording durations across individual ewe-lac-
tations, we chose to use model-based 100 day cumulative
yields to describe and standardise the lactation perform-
ance of all ewes.
Values for PP, FP, LP, SCC and SCS were analysed by fit-
ting a linear mixed model using the lme() function in R.
As suggested by Barillet [2], the useful yield describes the
ability to process milk into cheese, and was calculated
using the predicted protein and fat percentages from the
mixed model where UP = FP + 1.85 PP [2]. The cumulative
milk yield at day 100 (YCUM) for each animal was multi-
plied with the milk content (protein, fat, lactose) and
somatic cell scores/counts, to calculate the cumulative
milk content until day 100 (PYCUM, FYCUM, LYCUM,
YSCC, and YSCS for protein, fat, lactose, somatic cell
scores and somatic cell counts, respectively).
QTL mapping procedure
QTL analyses were performed for all traits using two
methods. Solutions were first obtained using the QTL-
MLE procedure in R as described previously [27,33]. To
account for multiple testing and to minimise the number
of false positive QTL, the method developed by Benjamini
and Hochberg [34] was used to calculate genome-wise
ranked P-values for each trait. For QTL-MLE, a LOD 1.75-
2.0 was deemed suggestive, LOD 2-3 significant, and LOD
greater than 3 highly significant. The second method used
the regression analysis for half-sib design in the web-
based program QTL Express [35]. For this method, QTL
with chromosome-wide significance threshold (P < 0.05)
Wt ate k b t ct
bct
() exp( ln )==+−
−
Wt ac b cT
T
b
() ,dt
0
1
1
∫
=+
()
−+
()
γ
γα
α
,dzxex
x
z
()
=
−−
∫
1
0
ykbtct
it i i i it
=+−+exp( log )
ε
K
B
C
N
i
i
i
KKBKC
KB B BC
KC BC C
⎛
⎝
⎜
⎜
⎜
⎞
⎠
⎟
⎟
⎟
⎛
⎝
⎜
⎜
⎜
⎞
⎠
⎟
⎟
⎟
~,
0
0
0
2
2
σσ σ
σσσ
σσ σ
22
⎛
⎝
⎜
⎜
⎜
⎜
⎞
⎠
⎟
⎟
⎟
⎟
⎛
⎝
⎜
⎜
⎜
⎜
⎞
⎠
⎟
⎟
⎟
⎟
.
Genetics Selection Evolution 2009, 41:45 />Page 4 of 15
(page number not for citation purposes)
were described as suggestive, chromosome-wide levels P <
0.01 as significant and experiment-wide levels (P < 0.05
and P < 0.01) as highly significant QTL. Thresholds for
QTL-MLE and QTL Express were chosen according to the
threshold criteria applied in the first paper of this series. A
two-QTL model was also fitted to the data using the same
program [35]. The QTL heritability was calculated as the
proportion of the phenotypic variance accounted for by
the QTL [1-(mean square of full model/mean square of
reduced model)].
Power analysis
Based on a Type I error of 0.05, the design had a predicted
power of 0.72 to detect QTL with 0.4 SD effect [36]. In
addition, the observed power for QTL detected under the
Haley-Knott regression method was calculated using the
method described by Hu and Xu [37]. The power was cal-
culated at two different significance thresholds namely, P
< 0.05 and P < 0.01.
Meta-assembly
A meta-assembly of QTL identified in this study was con-
ducted by collating all known QTL from public sources for
matched traits. Due to fewer records in sheep, it was not
possible to conduct a meta-analysis as described for cattle
by Khatkar et al. [13] to obtain consensus on the number
and positions of QTL by means of a formal statistical
hypothesis-based testing procedure. In contrast, for a
qualitative assessment, a meta-assembly was undertaken
by standardising all QTL against the V4.7 sheep linkage
map [38,39]. For each QTL, we identified the markers
closest to the likely point location and to the ends of the
95% confidence interval (CI) segment. When no point
location is available we used the midpoint of the chromo-
some. These markers or co-located markers were found on
the reference map. For each QTL we defined a weighting
function which gives a score which is maximal (1.0) at the
point location and follows a quadratic decline to 0.1 at
the boundaries of the CI segment. For each trait we
summed the scores of non-redundant QTL. QTL identi-
fied as being potential duplicates of the same QTL (i.e.
QTL identified in the same study within an identical
marker interval by different methods) were defined as
redundant reported QTL. The individual QTL locations
and their scores, and meta-score profiles were loaded into
the ReproGen gbrowse GFF database [40] which can be
browsed at />gbrowse/oaries_genome/. This browser includes hyper-
links to the detailed QTL information for each locus. In a
similar way we constructed a bovine QTL meta-assembly
using previously published estimates of cattle QTL as
reviewed by Khatkar et al [13]. Bovine QTL were extracted
from the ReproGen QTL database described by Khathar et
al. [13]. For a comparative analysis of ovine and bovine
QTL we first defined blocks of synteny by comparing the
locations of markers in the ovine reference map with their
positions in the bovine btau4.0 genome sequence assem-
bly [41]. The syntenic blocks can be used to compare fea-
tures across genomes. By this means QTL from our bovine
meta-assembly were added to the ReproGen ovine QTL
browser. Finally we combined the ovine and bovine meta-
scores to give a two-species meta-score and this also was
made available as a track in gbrowse.
Results
Analysis of lactation data
In total 1509 lactation records with more than 130,000
observations from 622 ewes were obtained across the
experiment and the Wood lactation model was then fitted
to these data. A range of one to five lactations was availa-
ble for each ewe. In the present study, the ewes were either
milked once or twice a day over the lactation, leading to a
considerable difference of the shape of the lactation
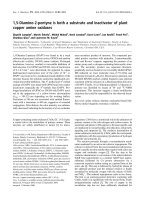
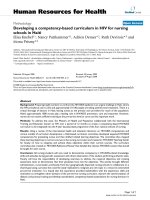
curves and total milk yields (Figure 1). The total milk
yields were standardised against birth type = 1 (singleton),
third parity, twice milking/day. The fixed effect of season
was significant in all models. Days in milk, sire, genetic
group, and parity were non significant effects for all traits
analysed. Age of animal, birth type, year of milking, milk
yield and milking frequency were significant for specific
traits. The number of observations, mean, standard devia-
tion and the range values of all traits recorded for the 172
genotyped backcross females on which the QTL analysis
were performed, are presented in Table 1. The YCUM of
the lactation ranged between 26.1 and 126.3 kg with an
average of 73.3 kg. The PYCUM ranged between 1.46 and
6.81 kg (average 4.05 kg). For the FYCUM a mean of 4.86
kg was found with yields ranging between 1.7 and 8.12 kg
and for LYCUM ranged between 0.93 and 4.49 kg (average
2.62 kg). The mean PP and FP was 5.54%, and 7.09%
Table 1: Summary of the phenotypic lactation traits in 172 ewes
used for QTL mapping
NMeansdMinMax
Fat content [%] 156 7.1 0.57 5.3 8.2
Lactose content [%] 156 3.6 0.00 3.6 3.6
Protein content [%] 146 5.5 0.20 4.9 6.1
YCUM [kg] 156 73 19 26 126
PYCUM [kg] 139 4.2 1.1 1.8 6.9
FYCUM [kg] 145 5.2 1.6 1.6 9.0
LYCUM [kg] 145 2.6 0.70 0.93 4.5
YSCS 148 3.6 1.0 1.3 6.5
YSCC 145 287 216 71 1607
SCS 159 5.0 0.46 3.9 7.4
SCC [cells/mL] 156 396 294 192 2408
Useful yield [%] 146 17 0.79 15.3 19
Shown are the number of observations (N), the average (Mean),
standard deviation (sd), minimum (Min) and maximum (Max) value of
the total milk (YCUM), protein (PYCUM), fat (FYCUM), lactose
(LYCUM) yield until day 100, total somatic cell count (YSCC) and
total cell score (YSCS) until day 100
Genetics Selection Evolution 2009, 41:45 />Page 5 of 15
(page number not for citation purposes)
respectively, and mean LP was 3.56% with almost no var-
iance for the latter. The SCS ranged between 3.87 and 7.40
(average 4.97), and the SCC had an average of 396 cells.
The useful yield content was between 15.3 and 19.25
(average 17.33).
Putative QTL identified for lactation performance
A total of 40 suggestive and significant QTL were detected
across the two single QTL analyses methods and 12 traits.
All 13 significant and 11 suggestive QTL detected by QTL-
MLE (Table 2) were also identified using QTL Express
(additional file 2). The genome locations of the signifi-
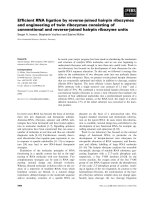
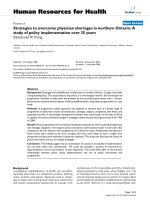
cant QTL for the four yield traits (YCUM, PYCUM,
FYCUM, and LYCUM) are shown in Figure 2, with OAR3
and OAR20 showing a significant QTL for all four traits.
OAR2 showed suggestive QTL for YCUM and LYCUM.
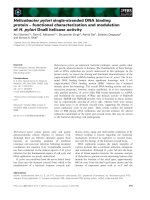
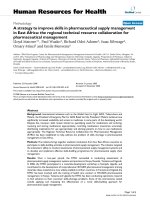
The genome-wide QTL plots for the four composition
traits (PP, FP, LP and UP) are shown in Figure 3. OAR3
and OAR25 showed significant QTL for FP and UP
whereas OAR7 harboured a significant QTL for PP. A
remarkably flat QTL profile was observed for LP with no
significant QTL detected across the genome. No signifi-
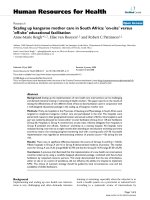
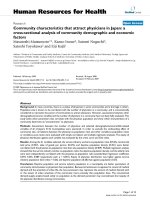
cant and relatively few suggestive QTL were detected for
SCC, SCS, YSCS and YSCC (Figure 4) with the strongest
support for QTL for SCS on OAR17 and for YSCS on
OAR14 and 22. The detailed information of the locations,
effect sizes and confidence intervals for the 24 QTL is
shown in Table 2 for QTL-MLE. Allelic effects for the sig-
nificant QTL ranged from -0.96 SD to 0.77 SD for QTL
recorded by QTL-MLE.
Using the regression analysis two additional significant
QTL (exceeding the 1% chromosome-wide significance
level) were identified, both of them did not reach the sig-
nificance threshold using QTL-MLE. An additional 16 sug-
gestive QTL were identified on OAR1, 2, 5, 6, 11, 13, 14,
17, 20, 22, 23, 24 and 26 (additional file 2) for all 12 traits
using QTL Express. The highest phenotypic variance
explained by QTL using QTL Express was for FYCUM on
OAR3 (10.7%). The other significant QTL explained
between 5.6 and 8% of the phenotypic variance (addi-
tional file 2).
QTL detected under either method, showed large confi-
dence intervals as determined by 1-LOD support intervals
under QTL-MLE (Table 2) or from bootstrap procedures
under QTL Express (additional file 2). Among the results,
QTL within the same marker interval were identified for
the yield traits including milk, protein, fat, lactose, and
somatic cell score yield. The derived traits of protein yield,
fat yield, lactose yield, somatic cell count and somatic cell
score yield are strongly correlated with milk yield. Pheno-
typic correlations in the range of 0.94 to 1 were detected
between the yield traits (Table 3). This suggests that a gen-
eral QTL for milk yield may affect the QTL for protein, fat,
lactose yield and for total somatic cell score.
Results for the two-QTL model conducted under QTL
Express are presented in Table 4. Significant evidence for
an additional QTL under a two-QTL model was found in
three cases on OAR9 for UP, on OAR17 for SSC and on
OAR26 for PP, with a difference of 112, 40, and 56 cM
between the two loci, respectively. The two loci on OAR9
(UP) and OAR17 (SCC) were in coupling phase, whereas
the QTL on OAR26 (PP) were of equal size and in repul-
sion phase. In an additional seven cases, the analyses by
QTL Express suggested a significant second QTL located
within 4 cM of the first QTL, and in six of these cases (the
exception being the QTL for LYCUM on OAR22) the QTL
were in repulsion phase of opposite and almost equal
effect on OAR5 (SCS), OAR16 (YSCC) and OAR22
(FYCUM, LYCUM, PYCUM, YSCS). Furthermore, in none
of these six cases, were QTL identified using the single
QTL model. We suggest that the QTL identified using the
two-QTL model in these cases maybe an artefact as the dis-
tance between the two loci is within one marker interval,
and the QTL are of equal but opposite effect. Only the
region identified using the two-QTL model for YCUM on
OAR22 was in accordance with the locus identified using
the single QTL model. In only three cases where a putative
two-QTL model provided a better fit to the data than a sin-
gle QTL model (UP on OAR9, SSC on OAR17, and PP on
OAR26) were the intervals between QTL greater than the
marker intervals, these chromosomes can therefore be
considered as carrying two different linkage regions for
the same trait (Table 4).
Example milking curves for ewes milked once compared to twice dailyFigure 1
Example milking curves for ewes milked once com-
pared to twice daily. Shown are the total milk yield in
litres (L) at the lactation day (days in milk) for animals milked
twice or once a day
Genetics Selection Evolution 2009, 41:45 />Page 6 of 15
(page number not for citation purposes)
From the interval mapping analyses, the observed QTL
were detected with an average realised power 0.64 for P <
0.05 and. 0.4 for P < 0.01, using the method as described
by Hu and Xu [37]. The greatest power was identified for
the QTL for LYCUM, PYCUM and FYCUM on OAR3 (0.64
- 0.87 for P < 0.01 and 0.83 - 0.96 for P < 0.05). The lowest
power of the detected QTL was found for the traits related
to somatic cell count on OAR5, 11, 17, 22 and 23 (0.17 to
0.28 for P < 0.01 and 0.37 to 0.51 for P < 0.05).
Meta-assembly
In order to compare the QTL detected in this experiment
with QTL findings in the public domain, a meta-assembly
was conducted for each trait as shown in Figure 5. Among
all studies, QTL for milk yield were identified on OAR1, 2,
3, 6, 9, 14, 16, 20, 22, and 24. Eight chromosomes were
identified harbouring QTL for protein yield and six for fat
yield. Eleven chromosomes were identified harbouring
QTL for protein percent, of which five (OAR1, 5, 6, 7, and
Table 2: Summary of QTL for lactation traits using QTL-MLE
OAR Trait QTL position [cM] CI [cM] LOD SD
Peak
1
Marker Lower
1
Upper
1
2 LYCUM 211 CSRD254 162 252 1.9 0.77
2 YCUM 214 CSRD254 182 253 1.8 0.73
3 FP 96 DIK4796 76 121 2.5 -0.67
3 FYCUM 96 DIK4796 88 104 4.4 -0.96
3 LYCUM 96 DIK4796 82 116 2.7 -0.74
3 U 96 DIK4796 77 124 2.0 -0.59
3 YCUM 96 DIK4796 80 123 2.3 -0.65
3 PYCUM 94 DIK4796 82 105 3.0 -0.79
6 UP 134 DIK4796 112 155 1.7 -0.53
7 PP 76 MCM223 56 93 2.7 0.74
8 FP 57 UWCA9 30 84 1.6 -0.49
9 UP 18 ETH225 7.2 49 1.7 -0.63
14 YSCS 114 MCMA19 91 114 2.0 0.57
14 LYCUM 114 MCMA19 82 114 1.6 0.51
17 SCS 102 BM7136 82 127 1.9 -0.55
20 FYCUM 50 DYAB 35 69 2.6 0.61
20 LYCUM 49 DYAB 33 68 2.1 0.55
20 PYCUM 49 DYAB 33 70 1.9 0.53
20 YCUM 52 DYAB 32 74 2.0 0.54
22 YSCS 23 BMS907 10 55 1.9 0.55
24 YCUM 105 DIK5147 84 105 1.9 0.51
24 LYCUM 105 DIK5147 82 105 1.8 0.51
25 FP 21 DIK2451 6 31 2.0 -0.51
25 UP 21 DIK2451 7 35 2.1 -0.54
QTL detected for the milk traits in the AMM BC population for the following traits: protein (PP), fat (FP), lactose (LP) and useful yield (UP) content,
total milk (YCUM), protein (PYCUM), fat (FYCUM), and lactose (LYCUM) yield until day 100, total somatic cell count (YSCC) and total cell score
(YSCS) until day 100; shown are the QTL relative QTL position and the confidence interval (CI) along the
1
male distance map [27], the LOD score
and the effect in standard deviation (SD) of the QTL; QTL effects are expressed with respect to the ancestry of Awassi grandsire contrasted with
the Merino granddam
Genetics Selection Evolution 2009, 41:45 />Page 7 of 15
(page number not for citation purposes)
26) were detected by at least two independent studies.
QTL for fat percent were reported on seven chromosomes
of which six (OAR1, 3, 8, 9, 20, and 25) were supported
by at least two different studies. Limited QTL information
has been reported for SCC and SCS. For lactose percent
and useful yield this experiment represents the only pub-
lished QTL. A detailed description of the QTL including
peak QTL position and confidence interval (where availa-
Results of the QTL analysis using QTL-MLE for the single traits of the yields until day 100Figure 2
Results of the QTL analysis using QTL-MLE for the single traits of the yields until day 100. Drawn are the
genome-wide graphs for the single traits of the cumulative yields until day 100 for milk, protein, fat and lactose; chromosomes
are separated by vertical lines and further the significance thresholds (LOD = 2 and LOD = 3) are shown in each graph
Genetics Selection Evolution 2009, 41:45 />Page 8 of 15
(page number not for citation purposes)
Results of the QTL analysis using QTL-MLE for the single milk content traitsFigure 3
Results of the QTL analysis using QTL-MLE for the single milk content traits. Drawn are the genome-wide graphs
for the single milk contents traits for protein, fat and lactose and the useful yield; chromosomes are separated by vertical lines
and further the significance thresholds (LOD = 2 and LOD = 3) are shown in each graph
Genetics Selection Evolution 2009, 41:45 />Page 9 of 15
(page number not for citation purposes)
Results of the QTL analysis using QTL-MLE for the single traits of the somatic cell count and scoreFigure 4
Results of the QTL analysis using QTL-MLE for the single traits of the somatic cell count and score. Drawn are
the genome-wide graphs for the single traits of the somatic cell count and score and the cumulative somatic cell count and
score; chromosomes are separated by vertical lines and further the significance thresholds (LOD = 2 and LOD = 3) are shown
in each graph
Genetics Selection Evolution 2009, 41:45 />Page 10 of 15
(page number not for citation purposes)
ble) from each study are shown in the public domain
/>oaries_genome/. The information from all public domain
QTL was not sufficiently dense to undertake a formal
meta-analysis as conducted by Khatkar et al [13]. The
meta-assembly provides a starting point for future meta-
analysis as additional QTL studies will become available.
The assembly of all milk QTL from the public domain is
made available through an online browser where specific
traits and all known QTL locations, are user selected. The
browser allows within-trait and across-trait analysis of the
information. An example for the main milk traits,, fat pro-
tein and lactose yield, and milk composition traits, pro-
tein, fat and lactose percentages, is shown in Figure 5. In
order to aggregate the QTL information, the integrated
QTL scores for each trait are shown in Figure 6 by way of
a single QTL score with decreasing likelihood of QTL
information away from peak location, and expressed as a
heat map.
In order to expand the information on significant QTL for
lactation performance, the wealth of information derived
from cattle studies was deemed to be suitable for a com-
parative genomic analysis. The results from all cattle QTL
on lactation performance were compared by Oxford grid
analyses to all known ovine lactation QTL as shown for
the example of milk yield in Figure 7. Each grid permits a
high resolution comparison on QTL identity, literature
source and comparative position on either the bovine or
ovine genome. From the comparative analysis, synteny
was detected for QTL for milk yield across five chromo-
somes (BTA5-OAR3, BTA6-OAR6, BTA20-OAR16, BTA23-
OAR20, and BTA26-OAR22). Similarly for protein and fat
percent, seven syntenic regions were detected (BTA1-
OAR1, BTA3-OAR1, BTA6-OAR6, BTA10-OAR7, BTA18-
OAR14 for PP; and BTA14-OAR9, BTA28-OAR25 for FP).
QTL in five comparative regions were also identified for
somatic cell count/somatic cell score (BTA1-OAR1, BTA7-
OAR5, BTA18-OAR14, BTA23-OAR20 and BTA26-
OAR22).
Discussion
This paper describes the lactation characteristics in a flock
specifically designed for QTL mapping and reports on a
number of important findings. Firstly it presents an
appropriate model to describe lactation curve characteris-
tics in sheep, secondly it confirms previously identified
Table 3: Phenotypic correlation between the lactation traits used for the QTL analysis
SCS FP PP SCC FYCUM LYCUM LP PYCUM UP YCUM YSCS
FP -0.22
PP -0.21 0.42
SCC 0.88 -0.19 -0.12
FYCUM -0.09 0.53 0.33 -0.05
LYCUM -0.04 0.29 0.24 0.01 0.96
LP -0.07 0.00 -0.03 -0.04 0.02 0.02
PYCUM -0.06 0.33 0.37 -0.01 0.97 0.99 0.02
UP -0.26 0.91 0.76 -0.19 0.53 0.32 -0.01 0.41
YCUM -0.04 0.29 0.24 0.01 0.96 1.00 0.02 0.99 0.32
YSCS 0.30 0.20 0.17 0.30 0.88 0.94 0.00 0.92 0.22 0.94
YSCC 0.81 -0.09 -0.03 0.93 0.27 0.34 -0.03 0.32 -0.08 0.34 0.60
Correlations are shown between the following traits: protein (PP), fat (FP), lactose (LP) and useful yield (UP) content, total milk (YCUM), protein
(PYCUM), fat (FYCUM), and lactose (LYCUM) yield until day 100, total somatic cell count (YSCC) and total cell score (YSCS) until day 100
(significance thresholds r > 0.159, P < 0.05; r > 0.208, P < 0.01)
Table 4: Summary of significant QTL for lactation traits using QTL Express under a two QTL model
OAR Trait Position [cM] QTL effect ± SE Var
1
[%] F-value Sign
2
QTL A QTL B QTL A QTL B 2 vs0 2 vs 1 2vs0 2vs1
9 UP 12 124 -0.5 ± 0.2 -0.4 ± 0.1 7.8 7 7 * *
17 SCC 32 72 216 ± 71 346 ± 87 8.4 8 8.4 ** **
26 PP 4 60 -0.1 ± 0.1 0.1 ± 0.1 7.9 7.2 7.8 * *
Shown are the peak position of QTL A and QTL B for useful yield (UP) and protein (PP) content and somatic cell count (SCC); the QTL effect and
the standard error (SE) of both QTL positions QTL A and QTL B (positions of each QTL are described by the average position in cM and further
by the confidence interval from the bootstrapping analysis);
1
variance of the phenotype explained by the QTL,
2
significant threshold of the F-value
(sign threshold) determines if the QTL reached the significance level under 2 vs 0 QTL (2 degrees of freedom), or 2 vs 1 QTL (1 degree of
freedom); with *chromosome-wide P < 0.05; **chromosome-wide P < 0.01
Genetics Selection Evolution 2009, 41:45 />Page 11 of 15
(page number not for citation purposes)
QTL on a population specific framework-map and identi-
fies novel QTL for lactation, and finally it compares the
location of all known QTL for lactation performance
within sheep breeds and across sheep and cattle.
Analysis of lactation data
The Wood model was shown to be appropriate to describe
lactation curves which supports its earlier use in sheep
[20,42-44]. However this is the first study in which the
derived parameters were used in a QTL analysis for sheep.
The use of quadratic lactation curve models provided a
better fit to the lactation curves in dairy sheep when the
evaluation of the lactation data was started after lactation
day 30, but failed to give reasonable predictions of total
milk yield [23]. Many different factors could be included
in the nonlinear mixed model to help predict milk pro-
Meta-assembly of ovine QTLFigure 5
Meta-assembly of ovine QTL. Tracks available in the ReproGen ovine gbrowse website />bin/gbrowse/oaries_genome/ showing the sheep genomic locations of QTL for milk yield, useful yield protein yield and content,
fat yield and content, lactose yield and content, and somatic cell score/count for individual QTL from this study and previous
publications
Meta-assembly of ovine QTLFigure 6
Meta-assembly of ovine QTL. Tracks available in the ReproGen ovine gbrowse website />bin/gbrowse/oaries_genome/ showing the sheep genomic locations of aggregate QTL for the same traits as in Fig. 5; each
aggregate QTL is shown as a heatmap in which meta-score is proportional to colour intensity
Genetics Selection Evolution 2009, 41:45 />Page 12 of 15
(page number not for citation purposes)
duction. Each fixed effect used here was a significant factor
in determining the lactation curve of each sheep. Previous
studies have shown that various factors such as nutrition,
multiple births, parity and lambing season have signifi-
cant effects on milk production and hence affect model
parameters [20,21,44,45]. The parameter estimates (k
i
, b
i
and c
i
) obtained in this study (5.35, 0.13 and 0.0032,
respectively) cannot be directly compared with many
other estimates from previous studies due to differences in
measurement units. However, a study of lactation curves
in dairy cows used the Wood [18] model to determine val-
ues for k
i
, b
i
and c
i
using the same units as those used here
[46]. The estimates of the parameters from their research
were 3.01 (k
i
), 0.091 (b
i
) and 0.0027 (c
i
) suggesting a gen-
eral similarity between the two species in lactation curve
characteristics. The most sizeable difference between both
species is the first part of the lactation curve, which shows
an early almost instantaneous peak of lactation in sheep,
but a delayed peak in dairy cattle. In fact the coefficients b
i
and c
i
were found to be highly correlated (r = 0.79) in
sheep, suggesting that one of the parameters may be
redundant in this study.
The lactation phenotypes (protein, fat and lactose content
and milk yield) derived from the parameters of the Wood
model were similar to lactation data described by Gutier-
rez-Gil et al. and Theodorou et al [12,47]. We found that
the SCS was similar to that reported previously [11]. This
shows that the application of the Wood model is a useful
tool to describe the overall lactation performance.
QTL analysis and meta-assembly
This study is the fifth whole genome-scan which reports
on QTL for lactation performance in sheep. This study is
unique in that the experimental population used two
breeds with extreme lactation characteristics. Previous
studies were conducted across a diverse panel of breeds
including Sarda × Lacaune, Lacaune, Churra and Basco-
Bearnaise, Lacaune and Manech families [8,11,12,48,49].
Furthermore this study has anchored the QTL on a popu-
Oxford Grid of ovine and bovine milk yield QTL meta-scoresFigure 7
Oxford Grid of ovine and bovine milk yield QTL meta-scores. Oxford Grid comparison of ovine and bovine genomes;
syntenic regions are shown as thin diagonal lines; aggregated QTL meta-scores for milk yield are also shown with meta-score
proportional to colour intensity: sheep (red, to right of syntenic diagonals) and cow (blue, to left of diagonals)
Genetics Selection Evolution 2009, 41:45 />Page 13 of 15
(page number not for citation purposes)
lation-specific framework map therefore minimising
ambiguity in the location of QTL, and used two
approaches for QTL analyses, a maximum likelihood
approach [27,33] and the regression method [35]. The
QTL meta-assembly is a useful tool to show the greater
QTL map for lactation traits in sheep among diverse
experiments. The data suggest the existence of some major
regions for milk production (yield, fat, protein, lactose). It
is highly likely that the component traits are all influenced
by QTL effects of milk yield which is further evidenced by
the strong positive correlations between them (Table 3).
For the milk components expressed as percentage traits,
we report for the first time on useful yield % as defined by
Barillet [2]. Since this trait is a weighted index of fat and
protein percentage it describes the overall milk character-
istics for cheese making. The QTL for this trait was also
aligned to QTL for milk yield. No QTL were observed for
lactose percent which may be consistent with the very low
degree of phenotypic variation observed in our study
which was in accordance with some but not all other stud-
ies [29,47,50].
Although exact locations for QTL could not be compared
given the generally very wide confidence intervals for such
locations, the meta-assembly is useful in that a consensus
location can be derived by combining QTL peak location
and confidence intervals in a single score for multiple
studies. This gives an aggregate profile of the most likely
QTL location for traits with similar phenotype and back-
ground as shown in Figure 6. The meta-assembly can sub-
sequently be used for a formal meta-analysis as
undertaken by Khatkar et al. [13], but in the absence of
such an analysis the QTL score seems appropriate. From
our analyses, the statistical method used to identify QTL
showed a high degree of consistency for the major (signif-
icant QTL) so comparisons across independent studies
should not be adversely affected by using different analyt-
ical methods. However, reporting on QTL with a marginal
significance may be affected by analysis methods, and the
use of a least squares regression method perhaps over rep-
resenting putative QTL. Despite the total number of
reports on QTL analyses for lactation traits in sheep, most
are derived from four populations and publications on
fragments of the data (partial genome scans) do not add
new information for meta-analyses over the genome-wide
analyses [8,11,12,49,51]. Despite the breed diversity used
in QTL mapping of lactation traits the consensus locations
of major QTL for milk traits is remarkably consistent
across breeds.
Comparison with the previous published results of a
bovine meta-analysis revealed that almost all the linkage
regions except the QTL for milk yield on OAR2 (BTA2)
and for fat content on OAR8 (BTA9) are present both in
sheep and cattle. We foresee the possibility of future stud-
ies to conduct a meta-analysis using data of both species.
This will also enable the comparison of QTL for other
milking traits such as lactation persistency where less
information is available in either or both species. For
genes relevant to lactation, Lemay et al. [52] examined
gene loss and duplication, phylogeny, sequence conserva-
tion, and evolution using the genomes of a monotreme
(platypus), a marsupial (opossum), and five placental
mammals (bovine, human, dog, mice, rat). Compared
with other genes in the bovine genome, milk and mam-
mary genes are more likely to be present in all mammals;
more likely to be duplicated in therians; more highly con-
served across Mammalia; and evolving more slowly along
the bovine lineage [52]. Their findings support the essen-
tiality of milk to the survival of mammalian neonates and
the establishment of milk secretory mechanisms more
than 160 million years ago. Lactation has been studied
more extensively in Bos taurus than in any other livestock
species, resulting in extensive milk proteome data, identi-
fication of milk production QTL, and over 100,000 mam-
mary-related bovine expressed sequence tags (ESTs). The
availability of the bovine genome sequence provides
unique opportunities to investigate milk and lactation
traits. With a known gene density for regions underlying
the broad confidence intervals of QTL associated with lac-
tation, each individual QTL is expected to contain
between 105 and 127 positional candidate genes [52].
However, cross-species synteny in QTL location and gen-
eral conservation of lactation genes across Mammalia,
suggests that common ancestral genes may be responsible
for variation in lactation performance. Both copy number
and sequence variation are likely to contribute to the
diversity of milk protein composition across species [52].
Therefore, further comparisons of sheep and cattle QTL
through the use of high density SNP analysis in both spe-
cies may identify common ancestral genes and chromo-
somal segments.
Despite high resolution fine-mapping tools, the identifi-
cation of causal genes that underlie QTL remains a chal-
lenging task. The use of functional information on
lactation networks may in part offer additional insight in
selecting positional-functional candidate genes in fine-
mapped regions. The use of improved QTL software sys-
tem such as QTL MatchMaker to integrate and mine QTL
information across human, mouse and rat genomes and
to annotate functional genomic data [53] should acceler-
ate the discovery of causative genes underlying QTL. This
will also in part elucidate the question if genes are physi-
cally clustered with respect to their known functions or
phenotypic effects [54].
Genetics Selection Evolution 2009, 41:45 />Page 14 of 15
(page number not for citation purposes)
Conclusion
In conclusion, we showed that the application of a math-
ematical model describing lactation curves of individual
ewes is a useful tool to describe milk production of sheep
which can then be used for QTL mapping. There is a high
degree of consistency of QTL across breeds particular on
OAR3, 6, 20 among diverse studies. The analysis of such
studies can the streamlined by online meta-assemblies
supported by appropriate browsers. We also present evi-
dence for a number of novel QTL for various milk produc-
tion traits, from which most (except QTL for milk yield on
OAR2 and for fat content on OAR8) were in agreement
with QTL mapped to corresponding bovine genome
regions. We show the possibility of future studies to con-
duct a meta-analysis using data of both species. Our data
supports evidence that there are ancestral alleles across
ruminants which will be eventually confirmed by cross-
species meta-assemblies as reported here.
Competing interests
The authors declare that they have no competing interests.
Authors' contributions
HWR was responsible for the overall design, project man-
agement, and was involved in analysis of the data and
writing the manuscript. EJ ran the final models and QTL
analyses, participated the manuscript preparation. DMcG
carried out the analysis of the lactation curves, developed
the models and helped drafting the manuscript. MH cal-
culated the QTL score and designed the online data source
and prepared data for the oxford grid. MKL ran the early
stage QTL analyses, was responsible for the data assembly,
and the phenotypic analysis. PCT developed the statistical
methodology for the lactation curve analysis and QTL
methodology, implemented the QTL-MLE program, and
contributed to manuscript preparation and the overall
design. All authors read and approved the final manu-
script.
Additional material
Acknowledgements
We would like to thank Stephen Brown for assistance with the develop-
ment of components of the QTL-MLE R coding, and Sally Isberg for con-
ducting testing of the QTL-MLE program and the initial QTL analyses. The
authors are particularly gratefully to Mr Dave Palmer and Mr Joe Davis, Ms
Renee Deever and the many casual staff who have contributed to the rear-
ing of the lambs, the milking and the husbandry of the ewes, and the colla-
tion of data. The contribution by Dr Evelyn Hall on the development and
discussion on the lactation models is grateful acknowledged. Animals were
housed and maintained in accordance with University of Sydney Animal Eth-
ics Committee guidelines. The authors are grateful to the CRC for Innova-
tive Dairy Products, Australia for partial funding of this project. The
resource flock and part of the sheep dairy was established with contribu-
tions from Mr Tom and Phillip Grant from Awassi Australia.
References
1. Maijala K: Genetic aspects of domestication, common breeds
and their origin. In The Genetics of Sheep Edited by: Piper L. CfP-
WQAR, Department of Animal Science, University of New England,
Australia. Armidale: CABI; 1997:13-50.
2. Barillet F: Genetics of milk production. In The Genetics of Sheep
Edited by: Piper L. CfPWQAR, Department of Animal Science, Uni-
versity of New England, Australia. Armidale: CABI; 1997:539-564.
3. Barillet F: Genetic improvement for dairy production in sheep
and goats. Small Rumin Res 2007, 70:60-75.
4. Pollott GE, Gootwine E: A genetic analysis of complete lacta-
tion milk production in improved Awassi sheep. Livest Prod Sci
2001, 71:37-47.
5. Legarra A, Ugarte E: Genetic parameters of udder traits,
somatic cell score, and milk yield in Latxa sheep. J Dairy Sci
2005, 88:2238-2245.
6. Riggio V, Finocchiaro R, van Kaam J, Portolano B, Bovenhuis H:
Genetic parameters for milk somatic cell score and relation-
ships with production traits in primiparous dairy sheep. J
Dairy Sci 2007, 90:1998-2003.
7. Weller JI: Quantitative Trait Loci Analysis in Animals New York: CABI
Publishing; 2001.
8. Barillet F, Arranz JJ, Carta A: Mapping quantitative trait loci for
milk production and genetic polymorphisms of milk proteins
in dairy sheep. Genet Sel Evol 2005, 37:S109-S123.
9. Diez-Tascon C, Bayon Y, Arranz JJ, De La Fuente F, San Primitivo F:
Mapping quantitative trait loci for milk production traits on
ovine chromosome 6. J Dairy Res 2001, 68:389-397.
10. Calvo JH, Martinez-Royo A, Beattie AE, Dodds KG, Marcos-Carcavilla
A, Serrano M: Fine mapping of genes on sheep chromosome 1
and their association with milk traits. Anim Genet 2006,
37:205-210.
Additional file 1
Correlation between results of the Wood model applied to lactations
of different length. The Wood model was fitted to observed lactation
data, truncated at days 50, 80, 100, 150, 200, 250 and 300. The corre-
lation between the cumulative yield using lactations of 100 days length (x-
axis) is plotted against predicted cumulative yield of lactation length
shorter (50 and 80) and longer (150, 200, 250, 300, and 400 days)
than 100 days (y-axis).
Click here for file
[ />9686-41-45-S1.PDF]
Additional file 2
Summary of QTL for lactation traits using QTL Express single QTL
models. Shown are the QTL relative QTL position and the confidence
interval (CI) along the
1
male distance map [27] for the following traits:
protein (PP), fat (FP), lactose (LP) and useful yield (UP) content, total
milk (YCUM), protein (PYCUM), fat (FYCUM), and lactose (LYCUM)
yield until day 100, total somatic cell count (YSCC) and total cell score
(YSCS) until day 100; the F-value and;
2
significant threshold of the F-
value (Sign.) which determines if the QTL reached the significance level
with *chromosome-wide P < 0.05; **chromosome-wide P < 0.01;
***experiment-wide P < 0.05; ****experiment-wide P < 0.01;
3
QTL
heritability: proportion of the phenotypic variance accounted for by the
QTL [1-(MS of full model/MS of reduced model)].
Click here for file
[ />9686-41-45-S2.PDF]
Genetics Selection Evolution 2009, 41:45 />Page 15 of 15
(page number not for citation purposes)
11. Gutierrez-Gil B, El-Zarei MF, Bayon Y, Alvarez L, de la Fuente LF, San
Primitivo F, Arranz JJ: Detection of quantitative trait loci influ-
encing somatic cell score in Spanish Churra sheep. J Dairy Sci
2007, 90:422-426.
12. Gutiérrez-Gil B, El-Zarei MF, Alvarez L, Bayón Y, Fuente LFdl, Primi-
tivo FS, Arranz JJ: Quantitative trait loci underlying milk pro-
duction traits in sheep. Anim Genet 2009, 40:423-434.
13. Khatkar MS, Thomson PC, Tammen I, Raadsma HW: Quantitative
trait loci mapping in dairy cattle: review and meta-analysis.
Genet Sel Evol 2004, 36:163-190.
14. Hu Z-L, Fritz ER, Reecy JM: AnimalQTLdb: a livestock QTL
database tool set for positional QTL information mining and
beyond. Nucl Acids Res 2007, 35(suppl 1):D604-609.
15. Adediran SA, Malau-Aduli AEO, Roche JR, Donaghy DJ: Using lacta-
tion curves as a tool for breeding, nutrition and health man-
agement decisions in pasture-based dairy systems. In
Proceedings of the Dairy Research Foundation Symposium: 2007 The Uni-
versity of Sydney, Australia; 2007:74-78.
16. Brody S, Ragsdale AC, Turner CW: The rate of decline of milk
secretion with the advance of the period of lactation. J Gen
Physiol 1923, 5:441-444.
17. Sikka LC: A study of lactation as affected by heredity and envi-
ronment. J Dairy Res 1950, 17:231-252.
18. Wood PDP: Factors affecting persistency of lactation in cattle.
Nature 1968, 218:894-895.
19. Cobby JM, Ledu YLP: Fitting curves to lactation data. Anim Prod
1978, 26:127-133.
20. Cappio-Borlino A, Pulina G, Rossi G: A non-linear modification of
wood's equation fitted to lactation curves of Sardinian ewes.
Small Rumin Res 1995, 18:75-79.
21. Cappio-Borlino A, Portolano B, Todaro M, Macciotta NPP, Giaccone
P, Pulina G: Lactation curves of Valle del Belice dairy ewes for
yields of milk, fat, and protein estimated with test day mod-
els. J Dairy Sci 1997, 80:3023-3029.
22. Chang YM, Rekaya R, Gianola D, Thomas DL:
Genetic variation of
lactation curves in dairy sheep: a Bayesian analysis of Wood's
function. Livest Prod Sci 2001, 71:241-251.
23. Chang YM, Rekaya R, Gianola D, Thomas DL: Genetic variation of
lactation curves in dairy sheep: quadratic function versus
Wood's model. Livest Prod Sci 2002, 77:147-153.
24. Ruiz R, Oregui LM, Herrero M: Comparison of models for
describing the lactation curve of Latxa sheep and an analysis
of factors affecting milk yield. J Dairy Sci 2000, 83:2709-2719.
25. Fuertes JA, Gonzalo C, Carriedo JA, San Primitivo F: Parameters of
test day milk yield and milk components for dairy ewes. J
Dairy Sci 1998, 81:1300-1307.
26. Cappio-Borlino A, Macciotta N, Pulina G: Dairy sheep nutrition:
Chapter 2 - mathematical modelling of milk production in
dairy sheep. CABI Publishing, UK; 2004.
27. Raadsma HW, Thomson PC, Zenger KR, Lam MK, Jonas E, Cavanagh
C, Jones M, Attard G, Palmer D, Nicholas FW: Mapping quantita-
tive trait loci (QTL) in sheep. I. A new male framework link-
age map and QTL for growth rate and body weight. Genet Sel
Evol 2009, 41(34):.
28. Gootwine E, Goot H: Lamb and milk production of Awassi and
East-Friesian sheep and their crosses under Mediterranean
environment. Small Rumin Res 1996, 20:255-260.
29. Nudda A, Bencini R, Mijatovic S, Pulina G: The yield and composi-
tion of milk in Sarda, Awassi, and Merino sheep milked uni-
laterally at different frequencies. J Dairy Sci 2002, 85:2879-2884.
30. Bencini R, Pulina G: The quality of sheep milk: a review. Wool
Techn Sheep Breed 1997, 45:182-220.
31. Dairy Express [ />]
32. Pinheiro J, Bates D, DebRoy S, Sarkar D, team RC: Package 'nlme'.
2009 [ />].
33. Thomson PC, Brown SC, Raadsma HW: QTL-MLE: A maximum
likelihood QTL mapping program for flexible modelling
using the R computing environment. Proc Assoc Advmt Anim
Breed Genet: 2007; Armidale, Australia 2007:288-290.
34. Benjamini Y, Hochberg Y: Controlling the false discovery rate -
a practical and powerful approach to multiple testing. J Royal
Stat Soc Series B-Methodological 1995, 57:289-300.
35. Seaton G, Haley CS, Knott SA, Kearsey M, Visscher PM: QTL
Express: mapping quantitative trait loci in of simple and
complex pedigrees. Bioinformatics 2002, 18:339-340.
36. Werf J van der: [ />ware.htm].
37. Hu Z, Xu S: A simple method for calculating the statistical
power for detecting a QTL located in a marker interval.
Heredity 2008, 101:48-52.
38. Maddox JF: [ />].
39. Maddox JF, Cockett NE: An update on sheep and goat linkage
maps and other genomic resources. Small Rumin Res 2007,
70:4-20.
40. Stein LD, Mungall C, Shu SQ, Caudy M, Mangone M, Day A, Nicker-
son E, Stajich JE, Harris TW, Arva A, Lewis Sl: The Generic
Genome Browser: A building block for a model organism
system database. Genome Res 2002, 12:1599-1610.
41. Elsik CG, Tellam RL, Worley KC: The genome sequence of tau-
rine cattle: a window to ruminant biology and evolution. Sci-
ence (Washington) 2009, 324:522-528.
42. Groenewald PCN, Ferreira AV, Vandermerwe HJ, Slippers SC: A
mathematical-model for describing and predicting the lacta-
tion curve of Merino ewes. Anim Sci 1995, 61:95-101.
43. Sakul H, Boylan WJ: Lactation curves for several United-States
sheep breeds. Anim Prod 1992, 54:229-233.
44. Portolano B, Spatafora F, Bono G, Margiotta S, Todaro M, Ortoleva
V, Leto G: Application of the Wood model to lactation curves
of Comisana sheep. Small Rumin Res 1997, 24:7-13.
45. Franci O, Pugliese C, Acciaioli A, Parisi G, Lucifero M: Application
of two models to the lactation curve of Massese ewes. Small
Rumin Res 1999, 31:91-96.
46. Hall EJS: Statistical modelling of lactation curves with an appli-
cation to Australian dairy cattle. Sydney: University of Sydney;
2008.
47. Theodorou G, Kominakis A, Rogdakis E, Politis I: Factors affecting
the plasmin-plasminogen system in milk obtained from
three Greek dairy sheep breeds with major differences in
milk production capacity. J Dairy Sci 2007, 90:3263-3269.
48. Barillet F, Bodin L, Chemineau P, Chilliard Y, Cribiu E, Elsen JM,
Gruner L, Leroux C, Malpaux B, Marie-Etancelin C, Martin P, Pollet S,
Rupp R, Schibler L, Jacquiet P, Prevot F, Bishop S, Walling G, Arranz
JJ, Bayon Y, Fuente LF de la, Gonzalo C, Mainar-Jaime R, Meana A, San
Primitivo F, Rojo-Vasquez FA: QTL detection and candidate
gene study for traits related to food quality and safety in
sheep (meat and dairy) production within the framework of
a European research contract called "genesheepsafety".
Options Méditerranéennes Série A, Séminaires Méditerranéens
2008:13-17.
49. Carta A, Barillet F, Casu S, Cribiu EP, Elsen JM, Fraghi A, Mura L, Schi-
bler L: A genome scan to detect QTL affecting dairy traits in
a dairy sheep backcross Sarda * Lacaune population. Ital J
Anim Sci 2003, 2(Suppl 1):31-33.
50. Othmane MH, De La Fuente LF, Carriedo JA, San Primitivo F: Herit-
ability and genetic correlations of test day milk yield and
composition, individual laboratory cheese yield, and somatic
cell count for dairy ewes. J Dairy Sci 2002, 85:2692-2698.
51. Carta A, Barillet F, Allain D, Amigues Y, Bibe B, Bodin L, Casu S,
Cribiu E, Elsen JM, Fraghi A, Gruner L, Jacquiet P, Ligios S, Marie-
Etancelin C, Mura L, Piredda G, Rupp R, Sanna SR, Scala A, Schibler L,
Casu S: QTL detection with genetic markers in a dairy sheep
backcross Sarda × Lacaune resource population. Proceedings
of the 7th World Congress on Genetics Applied to Livestock Production,
Montpellier, France, August, 2002 Session 1 2002:1-4.
52. Lemay DG, Lynn DJ, Martin WF, Neville MC, Casey TM, Rincon G,
Kriventseva EV, Barris WC, Hinrichs AS, Molenaar AJ, Pollard KS,
Maqbool NJ, Singh K, Murney R, Zdobnov EM, Tellam RL, Medrano
JF, German JB, Rijnkels M: The bovine lactation genome: insights
into the evolution of mammalian milk. Genome Biol 2009,
10(4):R43.
53. Star KV, Song QB, Zhu A, Bottinger EP: QTL MatchMaker: a
multi-species quantitative trait loci (QTL) database and
query system for annotation of genes and QTL. Nucl Acids Res
2006, 34:D586-D589.
54. Salih H, Adelson DL: QTL global meta-analysis: are trait deter-
mining genes clustered? BMC Genomics 2009, 10:184.