Báo cáo sinh học: "Impact of two myostatin (MSTN) mutations on weight gain and lamb carcass classification in Norwegian White Sheep (Ovis aries)" pot
Bạn đang xem bản rút gọn của tài liệu. Xem và tải ngay bản đầy đủ của tài liệu tại đây (1.02 MB, 7 trang )
RESEARC H Open Access
Impact of two myostatin (MSTN) mutations on
weight gain and lamb carcass classification in
Norwegian White Sheep (Ovis aries)
Inger A Boman
1,2*
, Gunnar Klemetsdal
1
, Ola Nafstad
3
, Thor Blichfeldt
2
, Dag I Våge
4
Abstract
Background: Our aim was to estimate the effect of two myostatin (MSTN) mutations in Norwegian White Sheep,
one of which is close to fixation in the Texel breed.
Methods: The impact of two known MSTN mutations was examined in a field experiment with Norwegian White
Sheep. The joint effect of the two MSTN mutations on live weight gain and weaning weight was studied on 644
lambs. Carcass weight gain from birth to slaughter, carcass weight, carcass conformation and carcass fat classes
were calculated in a subset of 508 lambs. All analyses were carried out with a univariate linear animal model.
Results: The most significant impact of both mutations was on conformation and fat classes. The largest difference
between the genotype groups was between the wild type for both mutations and the homozygotes for the
c.960delG mutation. Compared to the wild types, these mutants obtained a conformation score 5.1 classes higher
and a fat score 3.0 classes lower, both on a 15-point scale.
Conclusions: Both mutations reduced fatness and increased muscle mass, although the effect of the frameshift
mutation (c.960delG) was more important as compared to the 3’-UTR mutation (c.2360G>A). Lambs homozygous
for the c.960delG mutati on grew more slowly than those with other MSTN genotypes, but had the least fat and
the largest muscle mass. Only c.960delG showed dominance effects.
Background
In Norwegian White Sheep (NWS), two myostatin
(MSTN) mutations affecting conformation and fat
classes are segregating: the 3’-UTR mutation creating an
illegi timate microRNA site (c.2360G>A) that was identi-
fied in Texel sheep [1] and a frameshift mutation
explained by a deletion of one base pair in nucleotide
position 960 (c.960delG), identified in NWS [2]. While
c.2360G>A reduces the level of circulating myostatin to
appr oximately one third, c.960delG generates a comple-
tely non-functional protein.
Initially, the aim of the current study was to investigate
the effect of t he c.960delG mutatio n o n growth and car-
cass traits in NWS under ordinary commercial manage-
ment conditions. NWS is a synthetic crossbreed,
composed of the Dala, Rygja, Steigar and Texel breeds [3].
However, during the course of this experiment, another
MSTN mutation (c.2360G>A) was published [1]. Since the
Texel breed is one of the NWS founder breeds [3,4], the
ongoing study was expanded in order to include this new
mutation. Here we present data on how the two mutations
affect weight gain and lamb carcass classification.
Methods
Genotyping
Genotyping of the t wo MSTN positions, c.960 and
c.2360, was carried out as described by Boman et al. [2].
First, the animals were genotyped only at position c.960,
and then retyped at po sition c.2360, after publication of
the second mutation.
Experimental design
The field experiment comprised two exper imental years
in the Vesterålen area, in the north of Norway.
* Correspondence:
1
Department of Animal and Aquacultural Sciences, Norwegian University of
Life Sciences (UMB), PO Box 5003, N-1432 Ås, Norway
Boman et al. Genetics Selection Evolution 2010, 42:4
/>Genetics
Selection
Evolution
© 2010 Boman et al; licensee BioMed Central Ltd. This is an Open Access article distributed under the terms of the Creative Commons
Attribu tion License (http://creativecomm ons.org/licenses/by/2.0), which permits unrestricted use, distribution, and reproduction in
any medium, provided the original work is properly cited.
Year 1
The first year, all ewes of ten commercial NWS flocks
were genotyped at the c.960 position. In essence, for
each ewe homo- or heterozygous for c.960delG, an
age-matched control ewe without the mutation from
the s ame flock was also included in the study. All ewes
were mated to a ram without the mutation (n = 34).
Two flocks were excluded from the study due to the
low numbers of ewes carrying the mutation (4 and 6,
respectively). The remaining flocks were genetically
well tied, since six belonged to the same ram circle,
one was a former member of the circle and one had a
history of rams purchased from the circle. A total of
200 ewes (100 case/control pairs) were included in the
study, and each flock was represented with 18 to 28
ewes. In six flocks, ultrasound scanning to count the
number of foetuses had been performed, thus only
pregnant ewes were included in the experiment. The
first priority was to include all homozygous ewes,
thereafter the youngest heterozygous ewes within eac h
flock. The numbers of ewes and rams per genotype are
given in Table 1. The selected ewes’ lambs born this
year were genotyped.
Year 2
It was decided to replace two of the flocks from year 1,
by another flock. This flock was in an adjacent ram
circle, having genetic ties to the original experimental
flocks because common AI rams had been used and
local elite rams had been exchanged. Basically, the
same sampling strategy as in year 1 was followed; 100
ewes with the c.960delG mutation and 100 without
were included. In both groups, ewes with a low esti-
mated overall breeding value were sampled, since these
are not relevant for producing replacements. Prediction
of the breeding value, is described by Eikje et al. [5].
Each flock was represented with 20 to 30 ewes. In
addition, we balanced the groups with respect to age
and flock as in year 1. All ewes were artificially insemi-
nated with frozen semen from rams heterozygous for
the c.960delG mutation (n = 7). For the ewes that
returned, a local ram carrying the mutation was used.
The numbers of ewes and rams per genotype are given
in Table 1. The selected ewes’ lam bs were also geno-
typed in year 2.
Management and slaughter
The e xperiment did not interfere with normal manage-
ment; for example, the farmers were allowed to move
lambs to a foster mother or providing supplemental
feeding. In year 1, the farmers decided if and when to
slaughter the lambs, while in year 2 all experimental
lambs were intended to be slaughtered.
At appro ximately four months of age, the lambs were
gathered and transferred from the rough grazing pasture
to the farm. Subsequently, the weaning weight of the
lambs was measured and the farmers select ed the lambs
to be sent directly for slaughter, and those to be kept on
rich pasture, for finishing. Live weight was used as a
guide to decide when to slaughter the lambs according
to common practise. Some farmers shipped lambs only
twice in the season, while others shipped them more
frequently, depending on management choices and flock
size.
The lambs were all slaughtered in the same commer-
cial abattoir, and carcass classification was carried out
according to the EUROP classification system in Norway
[6], which is on a 15-point scale, a value of 15 being the
meatiest or fattiest class, respectively.
Statistical analysis
Data on growth and carcass traits were retrieved from
the national sheep recording system (SRS). The data
were analysed univ ariate ly for weight gain per day from
birth to w eaning, weaning weight, carcass weight gain
per d ay from birth to s laughter, carcass we ight, carcass
conformation class and fat class (Y
ijklmno
), with the fol-
lowing linear model, using DMUAI in the DMU soft-
ware package [7]:
YGGDSRADfyie
ijklmno i j k l m n o ijklmno
where G
i
is the fixed effect of the ith genotype class
(1, , 6; see Table 2), GD
j
is the fixed effect of the jth
genotype class of the dam (1, , 5; as in Tab le 2, except
the class homozygous for c.960delG), S
k
is the fixed
effect of the kth sex class (male or female), R
l
is the
fixed effect of the lth rearing class (1, 2, ≥3 or bottle
lamb), AD
m
is the fixed effect of the mth age of dam
class (1, 2, 3, 4 or ≥5), fy
n
is the random effect of the
nth flock-year class (1, , 15), i
o
is the random additive
genetic effect of the oth animal and e
ijklmno
is the ran-
dom r esidual term. The pedigree file comprised a total
of 3292 animals, a pruned subset retrieved from the SRS
for the experi mental animals, comprising all known
ancestors in six generations.
In the statistical model, the effects of sex, rearing class
and age of dam were factors that we a priori believed to
affect the traits since they are taken into acc ount in the
Table 1 Number of ewes and rams (local/AI) per
genotype and year
Sex Ewes sampled Rams
c.960 GG G(delG) (delG)(delG) GG G(delG) (delG)(delG)
Year 1 100 96 4 29/5
Year 2 101 96 3 10/7 1/0
Guanine (G) is found in the mutated position (c.960) in the wild type; in year
2, a local ram serviced ewes that returned
Boman et al. Genetics Selection Evolution 2010, 42:4
/>Page 2 of 7
national prediction of breeding values for traits recorded
in the autumn.
An equivalent model, analysing the same data with the
same software, was used to estimate the allelic effects
rather than the genotype class effects:
Yaxdxaxdx
intx GD S R AD
ijklmno
jk l m
2360 1 2360 2 960 3 960 4
5
fy i e
no ijklmno
where the regression coefficients for the additive and
dominant allelic effect of c.2360G>A (a
2360
,d
2360
)and
c.960delG (a
960
,d
960
)aregivenaswellas their interac-
tion (int), while the x’es are indicator (dummy) variables;
x
1
is the number of c.2360G>A alleles (0, 1, 2), x
2
is 1 if
heterozygous in c.2360 and 0 otherwise, x
3
is the num-
ber of c.960delG alleles (0, 1, 2), x
4
is 1 if heterozygous
in c.960 and 0 otherwise, x
5
is 1 for compound hetero-
zygotes and 0 otherwise, and the other terms are defined
as in the model above.
To test the impact of the two MSTN-mutations in the
first model, the wild type individuals (GG_GG, for
cDNA position 960 and 2360, respectively) were used as
reference. We also wanted to test the impact of the gen-
otypes carrying the c.960delG-mutation, against the
group GG_AA. Hypothesis testing was d one by the fol-
lowing contrasts, using V3.1 of PEST [8], w ith variance
components from the DMUAI run as input:
1. H
0
: MSTN-genotype - GG_GG (wild type) = 0,
where MSTN-genotype is GG_AG, GG_AA, G(delG)
_GG, G(delG)_AG or (delG)(delG)_GG against H
1
:
MSTN-genotype - GG_GG (wild type) ≠ 0.
2. H
0
: MSTN-genotype - GG_AA = 0,
where MSTN-genotype is G(delG)_GG, G(delG)_AG
or (delG)(delG)_GG, against H
1
:MSTN-genotype-
GG_AA ≠ 0.
Hypothesis testing for the allelic effects in the second
model was done by the following contrasts, using the
same software and variance components:
1. H
0
: regression coefficient = 0,
where regression coe fficient is the additive, dominance
and interaction terms a
2360
,d
2360
,a
960
d
960
and int,
against H
1
: regression coefficient ≠ 0.
2. H
0
:a
960
-a
2360
=0,
against H
1
:a
960
-a
2360
≠ 0.
Note that since the two models are equivalent, some
of the tests are identical.
Estimation of variance components for daily carcass
weight gain did not converge due to little information in
the data. The heritability was therefore set to 15%.
Results
The number of homozygous c.960delG ewes was low
(Table 1), and thus their progeny were omitted from the
analysis. In the autumn, 644 lambs (50.9% females) were
recorded with weaning weight(Table2)and508were
slaughtered. However, due to recruitment, only 41.2% of
the slaughtered lambs were females. The mean age of
the dams was 3.1 years, ranging from 1 to 7 years. The
average number of lambs weaned was 2.3, ranging from
1 to 4. Eleven lambs were bottle fed.
None of the animals homozygous for e ither mutation
carried the other mutation, implying that no crossover
had occurred between the two mutations. The lambs
could therefore be divided into six genotype groups,
depending on which combination of mutations and wild
type allele they carried (Table 2). Homozygous
c.960delG-lambs were o nly produced the second year,
since the rams used the first year did not carry this
mutation.
The group of homozygous individuals for c.960delG
was significantly different from the reference groups,
both the wild type (GG_GG) and GG_AA for three of
the observed traits (Table 3). The homozygo us
c.960delG animals had lower daily weaning weight gain
(312 g per day), lower weaning weight (44.6 kg), but
higher carcass weight (23.3 kg). Daily gain of slaughter
weight was very similar for all groups, ranging from 13 4
to 143 g per day, with no significant differences.
For carcass conformation and carcass fat, both m uta-
tions increased or decreased, respectively, scores in
comparison to t hose of the reference MSTN groups
numerically (Table 3). For both traits, all genotype
groups differed significantly (P < 0.05) from the wild
type group (GG_GG), except GG_AG for carcass con-
formation. For both carcass conformation and carcass
fat, the genotype G(delG)_GG was not significantly
Table 2 Number of lambs per genotype group for various traits
c.960 GG G(delG) (delG)(delG)
c.2360 GG AG AA GG AG GG
Weigth gain/d from birth to weaning (g) 78 216 114 105 106 19
Weaning weight (kg) 78 219 114 107 107 19
Carcass weight gain/d from birth to slaugther (g) 59 165 84 92 89 15
Carcass traits 59 167 84 94 89 15
Guanine is found at the mutated position in wild types, both in the c.960 and the c.2360 position, while (delG) and adenine (A) respectively, are found when the
mutations are present. Carcass traits are carcass weight, carcass conformation class and carcass fat class.
Boman et al. Genetics Selection Evolution 2010, 42:4
/>Page 3 of 7
different from the genotype GG_AA, while the g eno-
types G(delG)_AG and (delG)(delG)_GG resulted in sig-
nificant (P < 0.001) effects, towards more meaty and less
fatty animals. The wild type group had a carcass confor-
mation class and fat class of 7.4 and 6.0, respectively;
homozygotes for the c.2360G>A mutation had 8.1 and
5.1 respectively; and homozygotes for the c.960delG
mutation showed the largest effect with 12.5 and 3.0,
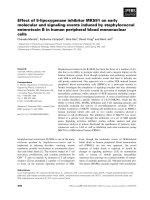
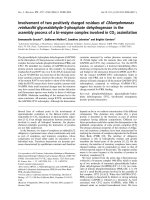
respectively (for illustration; see Figure 1).
Theeffectoftheewe’s MSTN-genotype on her lamb
(s) was close to zero and non-significant for all traits
(results not shown).
The allelic effects are given in Table 4. The mutation
in c.2360 showed a significant additive effect only on
carcass conformation ( 0.3) and fat class ( -0.4), and no
significant effect of dominance. T he mutation in c.960
significantly affected all traits, except for daily carcass
weight gain. For this mutation, there were also signifi-
cant dominance effects for four of these traits. For car-
cass conformation class, a significant interaction
between the mutations was estimated.
Discussion
The results show t hat both the c.2360G>A and
c.960delG mutations affect conformation and fat class in
NWS lambs, yielding a carcass with less fat and
increased muscle mass (Table 3 and 4). The effect of
the c.960delG mutation is larger than that of the
c.2360G>A mutation. This is in line with the results
obtained by Boman et al. [2], who suggest this is most
likely due to the different functional impact of the two
mutations. The effect of the c.2360G>A mutation, as
compared to the wild type, is slightly more pronounced
in this experiment, compared to the material reported
by Boman et al. [2]. However, in the experiment
reported here, we were able to study more than one
flock environment, a larger number of lambs in all
MSTN-groups, and the farmers only partially decided
which lambs to slaughter. In addition, the statistical
model also accounted for the proper number of lambs
following the ewe at weaning, rather than the number of
lambs born.
There were no overlap betwee n rams and years. It is
possible that the genetic contribution from the rams
and the flock-year effects m ay have been confounded,
but this will not affect the relative size of effects of gen-
otype classes. Also, lambs homozygous for the
c.960delG mutation were only produced the second
year. As the five other genotype classes were produced
both years, this lack of comple te cross classification
should not be a problem.
Since the c.2360G>A-mutation is already segregating
in NWS at a medium frequency (Table 2), we hypothe-
sise that in the future this mutation will reach near-fixa-
tion in NWS, as in the Texel breed [1,9]. Therefore w e
tested the other MSTN groups against the group homo-
zygous for c.2360G>A, in addition to testing against the
wild type.
In Norway, live weight is the most important criterion
for deciding when to slaughte r lambs. Thus , the higher
carcass weight for the homozygous c.960delG mutation
group may be explained by enlarged dressing
Table 3 Solutions ± standard errors for various traits and genotype classes, resulting from mutations at c.960 or
c.2360
c.960 GG
c.2360 GG AG AA
Weight gain/d from birth to weaning (g) 357 ± 12 352 ± 11 350 ± 12
Weaning weight (kg) 50.1 ± 1.7 49.4 ± 1.6 49.0 ± 1.8
Carcass weight gain/d from birth to slaughter (g) 136 ± 5 134 ± 5 137 ± 5
Carcass weight (kg) 21.4 ± 0.6 21.3 ± 0.6 21.8 ± 0.7
Carcass conformation class (scale 1-15) 7.4 ± 0.3 7.7 ± 0.3 8.1
0.015
± 0.4
Carcass fat class (scale 1-15) 6.0 ± 0.3 5.4
0.001
± 0.2 5.1
0.000
± 0.3
c.960 G(delG) (delG)(delG)
c.2360 GG AG GG
Weight gain/d from birth to weaning (g) 361 ± 12 349 ± 12
312
0 002
0 001
16
.
.
Weaning weight (kg) 50.2 ± 1.7 48.9 ± 1.8
44 6
0 007
0 001
22.
.
.
.
Carcass weight gain/d from birth to slaughter (g) 143 ± 5 140 ± 5 142 ± 8
Carcass weight (kg) 22.1 ± 0.6 22.3 ± 0.7
23 3
0 038
0 014
09.
.
.
.
Carcass conformation class (scale 1-15) 8.3
0.000
± 0.3
93
0 000
0 000
04.
.
.
.
12 5
0 000
0 000
05.
.
.
.
Carcass fat class (scale 1-15) 5.0
0.000
± 0.3
44
0 000
0 000
03.
.
.
. 30
0 000
0 000
04.
.
.
.
Guanine (G) is found at both mutated positions in wild types, while (delG) and adenine (A) respectively, are found when mutations are present. The P-value of
genotype classes contrasted with the wild type (GG_GG) is presented as superscript, while the P-value for G(delG)_GG, G(delG)_AG and (delG )(delG)_GG
contrasted with GG_AA is given in subscript. The P-values are given only for significant findings (P < 0.05). Solutions are given with the following restrictions;
genotype of dam class GG_GG, male, twin and age of dam = 3.
Boman et al. Genetics Selection Evolution 2010, 42:4
/>Page 4 of 7
Figure 1 A typical NWS lamb carcass, flanked by two carcasses homozygous for the MSTN mutation c.960delG. Carcass weight, EUROP
conformation class and fat class (both on a 15 points scale), from the left; 29.5 kg, 15, 4; 18.9 kg, 8, 5, and 24.8 kg, 15, 3. Photo: Audun Flåtten,
Animalia.
Boman et al. Genetics Selection Evolution 2010, 42:4
/>Page 5 of 7
percentage, indicated by the enhanced carcass confor-
mation class for this group (Table 3). The reduced
weaning weight and weaning weight gain per day (Table
3) also show that the group homozygous for c.960delG
grows slowly. However, it is likely that a possibly
enlarged dressing percentage, together with the fact that
slaughter information was discarded for slow growing
lambs in this group (Table 2), explain why the carcass
weight gain per day is closer to that of other groups
than expected from live weight gain.
The effects of the c.2360G >A mutation have also been
examined in other studies. Before this mutation was
reported, Laville et al. [10] had i nvestigated the effect of
the corresponding QTL in Belgian Texel sheep. They
reported a QTL effect that increased conform ation scor-
ing and carcass weight, and reduced the fat score. Kijas
et al. [ 9] had found that under Australian conditions,
the g.+6723G>A mutation (equals the c.2360G>A muta-
tion) had significant effects on slaughter measurements
of muscling and fatness, but only minor impact on live
weight and growth. These results correspond well with
our findings.
Similarly, Hadjipavlou et al. [11] had studied the effect
of the c.2360G>A mutation o n Charollais lambs, and
did not find any effect on live weight. With an animal
model, AA anima ls were found to have significantly lar-
ger muscle depth than AG and GG animals, while AG
and GG animals were not significantly different. None
of the fat depths were significantly different. They con-
cluded that the effect on phenoty pe depended on the
genetic background, a po int that is clearly demonstrated
in our material for carcass conformation class, showing
that animals heterozygous for the c.2360G>A mutation
are strongly influenced by the genotype at the c.960
position.
Conclusions
In NWS, increased muscle mass and reduced car cass fat
are caused by the c.960delG and the c.2360G>A muta-
tions. The impact of c.960delG is more important com-
pared to c.2360G>A, and displays dominance effects. In
the rough grazing environment of this experiment,
lambs homozygous for t he c.960delG mutation experi-
enced reduced growth rate.
Acknowledgements
We thank the producers that participated in the field experiment and Hans
Vestjord for helping with collecting blood samples. Silje Karoliussen is
acknowledged for excellent technical help. The project has received funding
from the Research Council of Norway (project no 173923/I10) and Marketing
levies (paid by producers).
Author details
1
Department of Animal and Aquacultural Sciences, Norwegian University of
Life Sciences (UMB), PO Box 5003, N-1432 Ås, Norway.
2
The Norwegian
Association of Sheep and Goat Breeders, PO Box 104, N-1431 Ås, Norway.
3
Animalia - Meat and Poultry Research Centre, PO Box 396 Økern, N-0513
Oslo, Norway.
4
Centre for Integrative Genetics (CIGENE), Department of
Animal and Aquacultural Sciences, Norwegian University of Life Sciences
(UMB), PO Box 5003, N-1432 Ås, Norway.
Authors’ contributions
IAB carried out the experiment, performed the statistical analysis and drafted
the manuscript. DIV was responsible for genotyping of the animals, and
improved the manuscript, jointly with GK. All authors participated in
planning the experiment, read and approved the final manuscript.
Competing interests
The authors have been granted a patent in the UK on the diagnostic
method of gene testing for the c.960delG mutation (GB2433320).
Received: 4 March 2009
Accepted: 29 January 2010 Published: 29 January 2010
References
1. Clop A, Marcq F, Takeda H, Pirottin D, Tordoir X, Bibe B, Bouix J, Caiment F,
Elsen JM, Eychenne F, Larzul C, Laville E, Meish F, Milenkovic D, Tobin J,
Charlier C, Georges M: A mutation creating a potential illegitimate
microRNA target site in the myostatin gene affects muscularity in sheep.
Nature Genetics 2006, 38:813-818.
2. Boman IA, Klemetsdal G, Blichfeldt T, Nafstad O, Våge DI: A frameshift
mutation in the coding region of the myostatin gene (MSTN) affects
carcass conformation and fatness in Norwegian White Sheep (Ovis Aries).
Animal Genetics 2009, 40:418-422.
3. Eikje ED: Sauerasar. Forelesingsnotat Institutt for husdyravl, Ås-NLH 1976.
4. Maurtvedt A: Texellamma på NLH. En sprek og livat gjeng. Sau og Geit
1994, 47:164-165.
5. Eikje L, Adnoy T, Klemetsdal G: The Norwegian sheep breeding scheme:
description, genetic and phenotypic change. Animal 2008, 2:167-176.
6. Johansen J, Aastveit AH, Egelandsdal B, Kvaal K, Roe M: Validation of the
EUROP system for lamb classification in Norway; repeatability and
accuracy of visual assessment and prediction of lamb carcass
composition. Meat Science 2006, 74:497-509.
7. Madsen P, Jensen J: An Users’s Guide to DMU 2008.
8. Groeneveld E: PEST user’s manual Germany, Institute of Animal Husbandry
and Animal Behaviour, FAL 1990.
Table 4 Solutions ± standard errors for various traits and allelic effects
Allelic effect a2360 d2360 a960 d960 int.
Weight gain/d from birth to weaning (g) -3 ± 4 -2 ± 5
23
0 002
0 001
7
.
.
27
0.001
±8 -7±9
Weaning weight (kg) -0.6 ± 0.5 -0.2 ± 0.6
28
0 007
0 001
09.
.
.
.
2.8
0.004
± 1.0 -0.5 ± 1.2
Carcass weight gain/d from birth to slaughter (g) 1 ± 2 -2 ± 3 3 ± 3 4 ± 4 -1 ± 5
Carcass weight (kg) 0.2 ± 0.2 -0.3 ± 0.3
09
0 038
0 014
04.
.
.
.
-0.2 ± 0.4 0.3 ± 0.5
Carcass conformation class (scale 1-15) 0.3
0.015
± 0.1 -0.1 ± 0.2
26
0 000
0 000
02.
.
.
.
-1.7
0.000
± 0.3 0.8
0.014
± 0.3
Carcass fat class (scale 1-15) -0.4
0.000
± 0.1 -0.2 ± 0.1
15
0 000
0 000
02.
.
.
.
0.5
0.010
± 0.2 0.0 ± 0.3
Additive (a) and dominance (d) effect for mutations in position c.2360 and c.960 respectively, and the interaction effect (int), when both mutations are present.
The P-value of genotype classes contrasted with the wild type (GG_GG) is presented as superscript, while the P-value for G(delG)_GG, G(de lG)_AG and (delG)
(delG)_GG contrasted with GG_AA is given in subscript. The P-values are given only for significant findings (P < 0.05).
Boman et al. Genetics Selection Evolution 2010, 42:4
/>Page 6 of 7
9. Kijas JW, McCulloch R, Edwards JEH, Oddy VH, Lee SH, Werf van der J:
Evidence for multiple alleles effecting muscling and fatness at the Ovine
GDF8 locus. BMC Genetics 2007, 8:80.
10. Laville E, Bouix J, Sayd T, Bibe B, Elsen JM, Larzul C, Eychenne F, Marcq F,
Georges M: Effects of a quantitative trait locus for muscle hypertrophy
from Belgian Texel sheep on carcass conformation and muscularity. J
Anim Sci 2004, 82:3128-3137.
11. Hadjipavlou G, Matika O, Clop A, Bishop SC: Two single nucleotide
polymorphisms in the myostatin (GDF8) gene have significant
association with muscle depth of commercial Charollais sheep. Animal
Genetics 2008, 39:346-353.
doi:10.1186/1297-9686-42-4
Cite this article as: Boman et al.: Impact of two myostatin (MSTN)
mutations on weight gain and lamb carcass classification in Norwegian
White Sheep (Ovis aries). Genetics Selection Evolution 2010 42:4.
Submit your next manuscript to BioMed Central
and take full advantage of:
• Convenient online submission
• Thorough peer review
• No space constraints or color figure charges
• Immediate publication on acceptance
• Inclusion in PubMed, CAS, Scopus and Google Scholar
• Research which is freely available for redistribution
Submit your manuscript at
www.biomedcentral.com/submit
Boman et al. Genetics Selection Evolution 2010, 42:4
/>Page 7 of 7

![Tài liệu Báo cáo khoa học: Expression of two [Fe]-hydrogenases in Chlamydomonas reinhardtii under anaerobic conditions doc](https://media.store123doc.com/images/document/14/br/hw/medium_hwm1392870031.jpg)