Báo cáo sinh học: "Connectedness among herds of beef cattle bred under natural service" pot
Bạn đang xem bản rút gọn của tài liệu. Xem và tải ngay bản đầy đủ của tài liệu tại đây (300.9 KB, 9 trang )
RESEARC H Open Access
Connectedness among herds of beef cattle bred
under natural service
Joaquim Tarrés
*
, Marta Fina, Jesús Piedrafita
Abstract
Background: A procedure to measure connectedness among herds was applied to a beef cattle population bred
by natural service. It consists of two steps: (a) computing coefficients of determination (CDs) of comparisons
among herds; and (b) building sets of connected herds.
Methods: The CDs of comparisons among herds were calculated using a sampling-based method that estimates
empirical variances of true and predicted breeding values from a simulated n-sample. Once the CD matrix was
estimated, a clustering method that can handle a large number of comparisons was applied to build compact
clusters of connected herds of the Bruna dels Pirineus beef cattle. Since in this breed, natural service is
predominant and there are almost no links with reference sires, to estimate CDs, an animal model was used taking
into consideration all pedigree information and, especially, the connections with dams. A sensitivity analysis was
performed to contrast single-trait sire and animal model evaluations with different heritabilities, multiple-trait
animal model evaluations with different degrees of genetic correlations and models with maternal effects.
Results: Using a sire model, the percentage of connected herds was very low even for highly heritable traits
whereas with an animal model, most of the herds of the breed were well connected and high CD values were
obtained among them, especially for highly heritable traits (the mean of average CD per herd was 0.535 for a
simulated heritability of 0.40). For the lowly heritable traits, the average CD increased from 0.310 in the single-trait
evaluation to 0.319 and 0.354 in the multi-trait evaluation wi th moderate and high genetic correlations,
respectively. In models with maternal effects, the average CD per herd for the direct effects was similar to that
from single-trait evaluations. For the maternal effects, the average CD per herd increased if the maternal effects
had a high genetic correlation with the direct effects, but the percentage of connected herds for maternal effects
was very low, less than 12%.
Conclusions: The degree of connectedness in a bovine population bred by natural service mating, such as Bruna
del Pirineus beef cattle, measured as the CD of comparisons among herds, is high. It is possible to define a pool of
animals for which estimated breeding values can be compared after an across-herds genetic evaluation, especially
for highly heritable traits.
Background
The best linear unbiased prediction (BLUP) of breeding
values allows meaningful comparisons betwee n anim als,
but only when genetic links exist between the different
environments (e.g. [1]). Connectedness, in a statistical
sense, relates to the estimability o f all co ntrasts invol-
ving fixed-model effects [2]. However, c onnectedness is
not required in order to predict random breeding values
[3], and disconnected subsets of records do not lead to
biased predictions of breeding values so long as breeding
values of base animals (i.e. the animals present at the
start of performance recording) are distributed randomly
and identically across the entire population [4]. This
assumption is violated, however, if selection or genetic
drift occurs before pedigree and performance recording
begin and cause genetic means of the herd s to differ [5].
The isolated herds (not highly connected i.e. for which
the accuracy of comparison is low) are likely to have dif-
ferent genetic means. In such a case, the environment
and genetic effects are partially confounded and the
genetic differences between animals in different
* Correspondence:
Grup de Recerca en Remugants, Departament de Ciència Animal i dels
Aliments, Universitat Autònoma de Barcelona, 08193 Bellaterra, Spa in
Tarrés et al. Genetics Selection Evolution 2010, 42:6
/>Genetics
Selection
Evolution
© 2010 Tarrés et al; licensee BioMed Central Ltd. This is an Open Access article distributed under the terms of the Creative Commons
Attribution Lice nse ( which permits unrestricted use, distribution, and reproduction in
any medium, provided the original work is prop erly cited.
environments are underestimated. Laloë and Phocas [6]
have shown that decreases in both accuracy and poten-
tial bias in a genetic evaluation are due to this phenom-
enon of regression towards the mean.
Laloë [7] has defined disconnectedness for random
effects in terms of “ non-predictability” of contrasts: a
contrast is not predictable if its coefficient of determina-
tion (CD) is null. Several other methods developed to
evaluate connectedness have been based on prediction
error (co)variances (e.g., [7-9]). The prediction error var-
iance (PEV) of a contrast of mean differences can be
obtained using matrix absorption [10] and has a strong
relationship with CD; it is thus a potential alternative
measure of connectedness. These statistics have been
used to measure connectedne ss in dairy cattle [11],
swine [9,12,13], and beef cattle [14]. However, CD was
found to combine data structure and amount of infor-
mation better [15]. It also provides a balance between
the decrease of PEV and the loss of genetic variability
due to genetic relationships between animals. Laloë et
al. [15] have concluded that CD was the best method
for judging the precision of a genetic evaluation or opti-
mising corresponding designs, especially when genetic
relationships among animals are to be accounted for
through a relationship matrix. However, CD is difficult
to calculate for routine genetic evaluation due to storage
and the processing time required to calculate the inverse
of the coefficient matrix and the (non-inverted) relation-
ship matrix [5]. Kuehn et al. [5] have advocated measur-
ing connectedness using other criteria, highly correlated
to CD, but easier to compute. Another way to circum-
vent this drawback is to turn to methods of approxi-
mated estimation of variance-covariance matrices.
Garcia-Cortes et al. [16] and Fouilloux and Laloë [17]
have proposed sampling methods that, theoretically,
allow the estimation of entire variance-covariance
matrices, and, as a result, the estimation of the CD of
contrasts among genetic levels of herds. Based on these
methods, Fouilloux et al. [18] have described a new
two-step process to analyze connectedness among herds:
the first step involves computing the CD of comparisons
between groups of animals using a sampl ing method,
while in the second step, clusters of wel l-connected
groups are formed based on a “criterion of admission to
the group of connected herds” (CACO) that reflects the
level of connectedness of each herd. The procedure
accounts for known pedigree and data structure effi-
ciently when measuring connectedness among herds.
This clustering method was appropriate in condensing
the relevant information of large matrices of similarities
(here, the CD of contrasts between genetic levels of
herds). It meets the requirement to construct sets of
well-connected herds, and may handle large problems
very quickly [18].
This method was applied by Fouilloux et al. [18] to
beef cattle breeds that use artificial insemination. In this
case, links between herds come through reference sires
thathaveprogenyindifferentherdsandasiremodel
can be sufficient to establish connectedness among
herds. However, in many local beef cattle breeds, natural
servi ce is almost exclusively used. In this case, links due
to reference sires are not so important and it is neces-
sary to consider the connection due to maternal and
paternal grandsires [19]. Thanks to the simplicity of the
CACO method, different models of analysis may be
easily adapted to account for these connections [18].
The choice of the best model for t he sampling method
depends on the size of the analyses and the knowledge
of the pedigree. Hence, application of single- or multi-
trait analyses using an animal model with or without
maternal effects will be possible for small-sized evalua-
tions, while sire or sire-maternal grandsire models can
be used for large-sized evaluations, depending on the
number of unkn own sires o r grandsires in the pedigree
files [18].
Bruna dels Pirineus is a local beef breed selected from
the old Brown Swiss (derived from the Canton Schwyz),
which is similar to the American Braunvieh. The herds
are located in the Pyrenean mountain areas of Catalonia
(Spai n). Genetic differen ces among beef herds are likely.
Herd sizes are generally small, relative to other livestock
specie s, and artificial insemination (AI), an effective tool
for connecting herds of other beef and dairy cattle, is
practically nonexistent in this breed. In contrast to other
countries, cooperative breeding schemes, designed to
create such genetic links [6], have been rarely used in
Spain.
The objective of this study was to measure the con-
nectedness among herds of beef cattle bred by natural
service. In particular, the CD of comparisons between
Bruna dels Pirineus herds will be computed using a
sampling method based on an animal model and clus-
ters of well-connected herds will be formed. This study
should permit the determination of the risk of bias
when comparing and selecting animals from different
herds on estimated breeding v alues (EBV), and the
results obtained can then be used as a reference for
other beef cattle b reeds, which are almost exclusively
bred by natural service.
Materials and methods
Data
Data of the on-farm beef cattle evaluation for the Bruna
dels Pirineus breed were used in th is study. The datas et
consisted of 28546 records and the total number of
animals in the pedigree file was 35546. The genetic eva-
luation model was an animal model that included sex
(2 levels), parity (10 levels), twins (2 levels), herd effect
Tarrés et al. Genetics Selection Evolution 2010, 42:6
/>Page 2 of 9
(76 levels), month (12 levels) and year (26 levels) as
fixed effects. The connectedness was studied among the
76 herds that had calf performances recorded during the
last five years.
Estimation of CD of contrasts
The method presented by Fouilloux and Laloë [17] to
estimate CD of estimated breeding values in a sire
model has been applied to an animal model to approxi-
mate the CD of contrasts between herds. The procedure
is as follows:
1- Starting from the pedigree of the pop ulation, the
animals involved in the simulation are sorted from
the oldest to the youngest. An animal model, includ-
ing pedigree with full relationship s, was used for the
simulation. The same one was used in the EBV pre-
diction model.
2- The direct genetic value u
i
of the animal i is calcu-
lated according to the status of its sire (j) and dam (k).
If j and k are unknown, u
i
is generated from
N
u
0
2
,
. If j is known and k is unknown, u
i
is cal-
culated b y u
i
=0.5u
j
+
i
where
i
is drawn from
N
u
0
3
4
2
,
.Thesameifkisknownandjis
unknown, u
i
is calculated by u
i
=0.5u
k
+
i
where
i
is drawn from
N
u
0
3
4
2
,
. Finally, if j and k are
both known, u
i
is calculated by u
i
=0.5(u
j
+ u
k
)+
i
where
i
is drawn from
N
u
0
2
4
2
,
.
3- Performance of each performance-tested animal y
i
= h
i
+ u
i
+ e
i
was simulated using its generated
breeding value u
i
and a residual e
i
drawn from
N
e
0
2
,
. Herd effects h
i
were simulated multiply-
ing a value drawn from U[0,1] by twice the phenoty-
pic standard deviation. The remaining fixed effects
were set to 0.
4- The vector of BLUP estimated breeding values
ˆ
u
is obtained by solving the mixed model equations
using y. BLUP was estimated using PEST software,
ceasing iteration when the convergence criterion was
less than 10
-6
. This process repeated n times leads
to vectors of true (simulated) {u
k
}
k =1,n
and esti-
mated breeding values
ˆ
,
u
k
kn
1
.
5- The CD of contrasts of interest are estimated by
computing their empirical variances and covariances
(quoted with *) following Fouilloux et al. [18]:
CD *( ’ )
(cov*( ’ , ’ ))
var*( ’ ) var*( ’ )
cu
cucu
cu cu
2
with
cov*( ’ , ’ )
’’
, var*( ’ )
’
cucu
cu cu
cu
cu
kk
k
n
n
k
k1
2
11
n
n
and
var*( ’ )
’
.c
u
c
u
k
k
n
n
2
1
Typically, a giv en contrast can be written as a linear
combination of the breeding values (c’u). For instance,
on one hand, the CD of the breeding value of a single
animal (i.e. its reliability) is obtained by using a vector c’
null except a 1 in the appropriate position correspond-
ing to this breeding value. On the other hand, the CD
of contrasts among herds i and j is obtained by using a
vector c’ null except a
1
m
i
or a
1
m
j
in the appropriate
position correspo nding to animals from herd i and j
respectively. Here, m
i
and m
j
were respectively the num-
ber of animals in herd i and j.
The estimated values of the CD of comparis on among
herds were computed by performing 1000 replicates of
the re-sampling method.
Selecting the set of connected herds
The main pra ctical goal of connec tedness studies is to
identify sets of connected herds. Two herds are consid-
ered connected if its CD is greater than an apriori
threshold, say c. A set of connected herds should then
be built in such a way that any pairwise CD between
herds of the set is greater than c. This was achieved
through an agglomerative clustering procedure proposed
for Fouilloux et al. [18], w hich was designed explicitly
for building compact clusters and is suitable for large-
sized datasets. At the start of the process, each herd
begins in a cluster by itself, and each step involves
aggregating herds one by one into appropriate clusters:
1. Each herd begins in the cluster by itself: [{h
1
},{h
2
},
, {h
n
}].ThetwoherdslinkedbythehighestCD,
say h
1
and h
2
, are clustered together, leading to the
following partition: [{h
1
, h
2
}, , {h
n
}].
2. A similarit y index is calcu lated for each herd out-
side the cluster {h
1
, h
2
}. The similarity index of a
given herd is equal to its lowest CD with the herds
currently in the cluster. The herd with the highest
Tarrés et al. Genetics Selection Evolution 2010, 42:6
/>Page 3 of 9
similarity index is added to the cluster. The CACO
of this new clustered herd is equal to its similarity
index a t this step. Supposing, for the sake of simpli-
city, that this herd is {h
3
}, then, the new partition is
the following: [{h
1
, h
2
, h
3
}, , {h
n
}].
The process stops either when all herds are clustered,
or when the CD of comparison between the clustered
herds and each of the remaining herds are all below the
fixed apriorithreshold c. In that latter case, the algo-
rithm is applied to the remaining herds to build other
possible clusters. Finally, two herds within the same
cluster are ensured to be compared with a CD > c.
When applying this method, a decision needs to be
made on the threshold c for the CD to be achieved
before a herd is considered to be connected. Such a
decision is and will always be a subjective matter. The
threshold c was chosen to be equal to 0.4, as in Fouil-
loux et al. [18]. However, a more informed choice is
possible using CD as a criterion of accuracy and pot en-
tial bias, and by considering the relationships between
CD, the amount of information, and the quality of
design.
Sensitivity analysis
For the sensitivity analysis, three different heritabilities
were simulated, first representing low (0.10), moderate
(0.25) and high (0.40) genetic variations. Second, the
results of an animal model were compared with results
from a sire model. In such a case, the data were simu-
lated using an animal model with pedigree but the
genetic evaluation was done using a sire model. Here,
two models were evaluate d: (i) the sire model does not
take into account the pedigree, i.e. the sire effects follow
a
N
s
0
2
,
where
s
2
was a quarter of the genetic
var iance, and (ii) the sire model includes a pedigree, i.e.
thesireeffectsfollowa
N
e
0
2
,
where
s
2
was a
quarter of the gene tic variance and A
s
was the relation-
ship matrix of sires.
Third, the estimation of CD was implemented for
multi-trait animal models where the genetic values were
simula ted in Step 2 as u =[u
l
, u
2
]~MVN(0,G) and the
residual values were simulated in Step 3 as e =[e
l
, e
2
]~
MVN(0,R). The genetic and residual (co)variance
matrices were respectively:
GR
uu
uu
ee
ee
112
12 2
112
12 2
2
2
2
2
and .
Two different multi-trait scenarios were simulated: (i)
alowlyheritabletrait(0.10)withamoderatenegative
genetic correlation (-0.25) and moderately heritable trait
(0.40); and (ii) a lowly heritable trait (0.10) with a high
negative genetic correlation (-0.50) and highly heritable
trait (0.40). First, these two scenarios were simulated
with a null residual correlation but, as a null residual
correlation w as not always realistic, the effect of a non-
null residual correlation was ch ecked by simulating resi-
dual correlations with the same magnitude of the
genetic correlations. The simulated data were analyzed
jointly in Step 4, but the CDs were estimat ed separately
for each trait in Step 5.
Fourth, the estimation of CD was implemented for
models with maternal effects, where the direct and
maternal gene tic values were simulated in Step 2 as
[ um]~MVN(0,G). The gene tic and residual (co)var-
iance matrices were, respectively:
G
uum
um m
2
2
.
Two different scenarios with maternal effects were
simulated: (i) a trait with a lowly heritable maternal
effect (0.10), moderate negative genetic correlation
(-0.25) and moderately heritable direct effect (0.25), and
(ii) a trait with lowly heritable maternal effect (0.10),
high negative genetic correlation (-0.50) and highly heri-
table direct effect (0.40 ). Both scenarios were comp ared
in the case of a null genetic correlation among maternal
and direct effects. In Step 3, the performance of each
performance-tested animal y
i
= h
i
+ u
i
+ m
k
+ e
i
was
simulated using the herd effect h
i
, its generated direct
breeding value u
i
, the maternal breeding value of its
dam m
k
and a residual e
i
drawn from
N
e
0
2
,
.The
simulated data were analyzed using a model with mater-
nal effects in Step 4, but the CDs were estimated sepa-
rately for the direct and maternal effect in Step 5.
Results
Individual reliabilities
First, the sampling method to estimate CD (reliabilities)
of estimated breeding values was applied to an animal
model. The mean reliability of the 28546 animals with
data decreased from 0.51 to 0.22 as the heritability
decreased from a high (0.40) to a low (0.10) value
(Table 1). This reliability was 0.37, with a standard
deviation of 0.08 when the simulated heritability was
0.25. The reliability of sires in the first breeding season
(with 0 to 30 progeny) was under the minimum reliabil-
ity determined by Interbull [20] to publish bull indexes
(0.50-0.75). This reliability became sufficiently high for
publication of breeding values after the first breeding
season,i.e.0.69forsireswith30to60progeny,and
Tarrés et al. Genetics Selection Evolution 2010, 42:6
/>Page 4 of 9
increased up to 0.86 for sires with over than 150 pro-
geny (Table 1). The reliabilities of sires were 0.07 to
0.09 points higher with an animal model than with a
sire model, although they increased only between 0.01
and 0.03 points if the pedigree is not taken into account
in the sire model. These differences were lower for the
lowly heritable traits and increased for the highly herita-
ble traits.
In the multiple trait scenario with a null residual cor-
relation, the mean reliability of the 28546 animals with
data on lowly heritable traits increased from 0.22 to 0.23
and 0.29 in the multiple trait models with moderate
(-0.25) and high (-0.50) genetic correlation respectively
(Table 2). The increase in reliability was higher as relia-
bility of the animal decreased. However, these gains
were not so important when the magnitude of the resi-
dual correlation was equal to the g enetic correlation
(Table 2).
In models with maternal effects, reliabilities of the ani-
mals for the direct effects were similar to those obtained
from single-trait evaluations (results not show n); in par-
ticular, the reliability of dams for maternal effects was
0.21. This reliability increased if a genetic correlation
with the direct effects existed. The increase was equal to
0.04 point if the genetic correlation was high (-0.5) with
a highly heritable trait (0.40) (Table 3). However, the
reliability only became high enough to publish breeding
values for maternal grandsires with more than 30 dam
progeny (Table 3).
CD of comparisons between herds
Once the 76 × 76 matrix of CD o f contrasts among
herds was estimated, the average CD per herd was cal-
culated as the mean of the 76 CD values of each herd
column. Later on, mean, standard deviation, minimum
and maximum of the 76 average CD per herd were cal-
culated. The mean of average CDs per herd in the sin-
gle-trait animal model decreased from 0.53 to 0.31 as
the simulated heritabilities decreased from 0.40 to 0.10.
The percentage of herds contrasts with CD higher than
0.4 decreased with the heritability from 85.93% to
25.54% (Table 4).
The average CD pe r herd ranged between 0.243 and
0.644 when the simulated heritability was 0.25, with a
mean of 0.455 and a standard deviation of 0.087 (Table
4). This average CD was about double than that
obtained using a sire model with unknown and known
pedigree (0.22 and 0.24, respectively). The percentage of
connected herds was also much higher with an animal
model (70.70%) than with a sire model (16.62%). The
percentage of connected herds using a sire model was
very poor even for highly heritable traits (Table 4),
Table 1 Average reliabilities of individual animals in single trait evaluations with different heritabilities (h
2
)
h
2
Model Animals with data Sires with progeny Dams
0-30 30-60 60-90 90-120 120-150 >150
0.40 Sire nr
1
0.38 0.68 0.72 0.74 0.74 0.90
Sire 0.40 0.69 0.74 0.75 0.75 0.91
Animal 0.51 0.49 0.79 0.84 0.85 0.83 0.91 0.26
0.25 Sire nr 0.30 0.60 0.66 0.69 0.69 0.86
Sire 0.32 0.62 0.68 0.70 0.70 0.87
Animal 0.37 0.39 0.69 0.76 0.79 0.77 0.86 0.18
0.10 Sire nr 0.17 0.42 0.51 0.55 0.57 0.74
Sire 0.19 0.45 0.53 0.57 0.58 0.77
Animal 0.22 0.23 0.48 0.58 0.63 0.63 0.75 0.09
Number 28546 364 97 52 22 17 23 6354
1
Sire nr: sire model without relationship
Table 2 Average reliabilities for the lowly heritable trait (h
2
= 0.10) of individual animals in multiple trait evaluations
Model
1
Animals with data Sires with progeny Dams
h
2
r
g
r
e
0-30 30-60 60-90 90-120 120-150 >150
ST 0.22 0.23 0.48 0.58 0.63 0.63 0.75 0.09
0.25 -0.25 -0.25 0.22 0.23 0.50 0.58 0.64 0.63 0.75 0.09
0.25 -0.25 0 0.23 0.24 0.50 0.59 0.65 0.63 0.76 0.10
0.40 -0.5 -0.5 0.25 0.25 0.51 0.59 0.65 0.64 0.76 0.11
0.40 -0.5 0 0.29 0.29 0.54 0.61 0.67 0.65 0.77 0.13
Number 28546 364 97 52 22 17 23 6354
1
Trait evaluated jointly with another trait with heritabili ty (h
2
) and genetic correlation (r
g
) and residual correlation (r
e
) except in the single trait evaluation (ST)
Tarrés et al. Genetics Selection Evolution 2010, 42:6
/>Page 5 of 9
while, the de gree of connection evaluated with an ani-
mal model was important for moderately and highly
heritable traits but still poor for lowly heritable traits.
In the multiple trait scenario with a null residual cor-
relation, the mean of the approximated CD of contrast
for the lowly heritable traits increased from 0.31 in the
single-trait evaluation to 0.35 in the multi-trait evalua-
tion with a high genetic correlation and highly heritab le
trait, increasing the percentage of connected herds from
25.54% to 34.03% (Table 5). However, the increase in
the percentages was not so high if there was residual
correlation with the same magnitude as the genetic
correlation.
In models with maternal effects, the average CD per
herd for the direct effects were similar to those obtained
from single-trait evaluations (results not shown), but the
average CD for maternal effects were lower than in the
single-trait evaluation, i.e. 0.19 vs. 0.31 respectively
(Table 6). The percentage of connected herd s for mater-
nal effects was very low, less than 10% (Table 6). The
mean of average CD per herd increased from 0.202 to
0.251 if the maternal effects had a high genetic correla-
tion with the direct effects, but the percentage of con-
nected herds only increased from 8.25% to 11.82%
(Table 6).
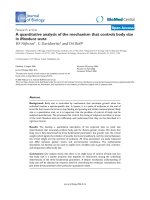
Set of connected herds
The clustering procedure was applied to the 76 × 76
matrix of CD of contrasts among herds. In the moderate
heritability scenario (0.25), a big cluster was found
including 48 herds (Figure 1). Two more clusters were
found by grouping two and three herds. The rest of the
herds up to 76 could not be included in any cluster.
The number of herds in the big cluster was even bigger
(up to 58) when the simulated heritability was high
(0.40) (Figure 1). However, the number dropped to 18
herds for low heritabilities (0.10), although it still con-
tainedthelargerherdsofthebreedbecauseahigher
Table 3 Average reliabilities for the maternal effects (h
2
= 0.10) of individual animals in single trait evaluations with
maternal effects
Model
1
Animals with data Sires with progeny Dams MGS
h
2
r
g
0-30 30-60 60-90 90-120 120-150 >150 0-30 30-60
0.25 0 0.14 0.14 0.21 0.26 0.40 0.34 0.50 0.21 0.23 0.72
0.25 -0.25 0.13 0.15 0.25 0.30 0.43 0.37 0.53 0.22 0.24 0.73
0.40 0 0.15 0.14 0.23 0.28 0.42 0.36 0.51 0.20 0.24 0.72
0.40 -0.5 0.15 0.19 0.35 0.40 0.51 0.45 0.59 0.25 0.29 0.76
Number 28546 364 97 52 22 17 23 6354 345 12
1
The direct effects had heritability (h
2
) with genetic correlation (r
g
) with maternal effects
Table 4 Average coefficients of determination (CD) of
contrasts per herd in single trait evaluations with
different heritabilities (h
2
)
h
2
Model Average CD % CD over 0.4
Mean STD
2
Minimum Maximum
0.40 Sire nr
1
0.260 0.108 0.068 0.509 19.96
Sire 0.285 0.111 0.074 0.534 23.66
Animal 0.535 0.086 0.302 0.705 85.93
0.25 Sire nr 0.220 0.098 0.057 0.464 13.81
Sire 0.244 0.102 0.063 0.492 16.62
Animal 0.455 0.087 0.243 0.644 70.70
0.10 Sire nr 0.147 0.075 0.038 0.358 4.44
Sire 0.169 0.080 0.043 0.390 6.15
Animal 0.310 0.079 0.144 0.512 25.54
1
Sire nr: sire model without relationship.
2
STD: standard deviation
Table 5 Average coefficients of determination (CD) of
contrasts per herd for the lowly heritable trait (h
2
= 0.10)
in multiple trait evaluations
Model
1
Average CD % CD over 0.4
h
2
r
g
r
e
Mean STD
2
Minimum Maximum
ST 0.310 0.079 0.144 0.512 25.54
0.25 -0.25 -0.25 0.310 0.079 0.160 0.489 22.94
0.25 -0.25 0 0.319 0.078 0.176 0.506 24.59
0.40 -0.5 -0.5 0.325 0.078 0.157 0.498 26.60
0.40 -0.5 0 0.354 0.077 0.195 0.541 34.03
1
Trait evaluated jointly with another trait with heritability (h
2
)andgenetic
correlation (r
g
) and residual correlation (r
e
) except in the single trait evaluation (ST)
2
STD: standard deviation
Table 6 Average coefficients of determination (CD) of
contrasts per herd in single trait evaluations with
maternal effects
Model
1
Average CD % CD over 0.4
h
2
r
g
Mean STD Minimum Maximum
0.25 0 0.189 0.084 0.047 0.438 7.75
0.25 -0.25 0.203 0.082 0.054 0.461 8.21
0.40 0 0.202 0.082 0.058 0.445 8.25
0.40 -0.5 0.251 0.079 0.099 0.505 11.82
1
The direct effects had heritability (h
2
) with genetic correlation (r
g
) with
maternal effects
2
STD: standard deviation
Tarrés et al. Genetics Selection Evolution 2010, 42:6
/>Page 6 of 9
number of animals per herd allowed a better compari-
son of the genetic level among herds.
Discussion
TheBLUPofbreedingvaluesallowscomparisons
between animals if the reliability is high enough, but the
individual reliability is not a sufficient measure of risk in
comparing animals across he rds, and does not reflect
potential bias in models that exclude genetic groups or
increased error associated with fitting genetic groups
[5]. A better criterion to assess this risk is the CD of
comparisons between animals (or groups of animals)
from different herds [5]. Generally, a low CD corre-
sponds to a contrast estimated without accuracy due to
some confusion between environmental and genetic dif-
ferences [7]. The CD of comparisons depends on three
factors: (1) the amount of information, through the
number of progeny per herd; (2) th e quality of the
design through the proportion of progeny from refer-
ence sires within a herd; and (3) the heritability [6]. In
this study, the CDs of comparisons between herds of
beef cattle bred by natural service have been computed
using a sampling method. These CDs were low w hen
the genetic evaluation was done using a sire model,
even for highly heri table traits. When the simulated her-
itability was 0.25, the mean of average CD per herd in
the Bruna dels Pirineus breed (0.244) using a sire model
was slightly lower than that found by Fouilloux et al.
[18] in the Bazadais breed (0.294) and much lower than
that of the Charolais breed (0.54 ). These two beef cattle
breeds use artificial insemination. In these cases, links
between herds come through reference sires that have
progeny in different herds and a sire model can be suffi-
cient to establish connectedness among herds. However,
in many local beef cattle breeds, breeding is performed
almost exclusively by natural service. The Bruna dels
Pirineus breeders had never attempted a formal
exchange of bulls among herds, although some amount
of exchange is believed to have taken place through pur-
chases of bulls from prominent breeders and at national
shows and auctions. Because of the lack of artificial
insemination and of an active exchange program, con-
nectedness was expected to be more limited in the
Bruna dels Pirineus breed than in the Bazad ais breed
and, especially, the Charolais breed.
The reliability of comparisons among herds increased
using an animal model because more pedigree informa-
tion was added, especially the connections due to mater-
nal and paternal grandsires. In the Bruna dels Pirineus
breed, Tarres et al. [19] found that the genetic similarity
of connected herds was higher through maternal grand-
sires and paternal grandsires (25.91% and 38.91%,
respectively) than through sharing sires (20.87%). As a
result of including this pedigree infor mation, the degree
of connection evaluated with an animal model in the
Bruna dels Pirineus breed was considerably high for
moderately and highly heritable traits. However, the
connectedness levels for lowly heritable traits, e.g. func-
tional traits, were still poor.
Connectedness in genetic evaluations for lowly herita-
ble traits can be improved by performing joint evalua-
tions with m ore heritable and highly correlated traits,
especially if the residual correlation among these traits
is nearly null. Our results agree with Schaeffer [21], in
the sense that the capacity of a multiple trait analysis to
increase CD depends on residual and genetic correla-
tions used for the analysis. First, the percentage incre-
ment of CD was dependent on the difference between
error and genetic correlations. The greater the absolute
difference in correlations, the greater the increment of
CD for both traits [21]. Second, when the residual corre-
lation is less (greater) than the genetic correlation, in
absolute terms, then the trait with the lower (higher)
heritability achieves t he greatest percent increment of
CD [21].
For traits with direct and matern al effects, the CDs of
comparisons among herds were considerably high for
direct effects. In the case of maternal effects, they can
be better evaluated if a high genetic correlation exists
with the direct effects. This favors the evaluation of the
maternal effects for birth weight that had a heritability
of 0.10 and a high negative genetic correlation (-0.5) to
the highly heritable direct effect (0.40) [22]. For weaning
weight, the maternal effects had a low heritability of
0.10 and a moderate negati ve genetic correlation (-0.25)
to the moderately herit able direct effect (0.25) [22].
Figure 1 Clusters obtained using the CACO method in single
trait analysis with different heritabilities. The heritabilities used
were h
2
= 0.10 (Thin black line), h
2
= 0.25 (dotted black line) and h
2
= 0.50 (thick dashed line).
Tarrés et al. Genetics Selection Evolution 2010, 42:6
/>Page 7 of 9
However, even if high genetic correlation is used in the
evaluation, the comparisons among herds for mat ernal
effects had a low reliability.
As a result of these links, most of the herds of the
Bruna dels Pirineus breed were well connected, espe-
cially for moderately and highly heritable traits. The
herds of this breed were located primarily within the
same region: the Pyrenean area of Ca talonia (Spain).
Because almost all of the matings in this beef population
were by natural service, the close proximity of these
herds has made bulls’ and heifers’ exchanges more feasi-
ble. Furthermore, because they are a one-purpose breed
raised for meat productio n, Bruna dels Pirineus breeders
participating in the YRS have similar breeding objec-
tives, creating the potential for many herds to purchase
and to use related i ndividuals. This can explain the
fact that many of the herds were well connected.
According to the results of the connectedness study
and although all performances must be included in the
genetic evaluation, only genetic values of animals com-
ing from connected herds should be publ ished at a
“racial level,” while genetic values of animals coming
from disconnected herds should be used only within
herds or provided with a warning that comparisons
between poorly connected herds may be biased. By
using sires from well-connected YRS herds, the discon-
nected herds should, quickly, become strongly con-
nected with other Bruna dels Pirineus herds in the
YRS. New herds entering the YRS can, therefore,
become rapidly connected totheentirebreedbypur-
chasing sires from herds that are already well con-
nected. Exchange of bulls and p urchase of bulls from
other herds can increase connectedness effectively and
reducetheriskofbiaswhenEBVsofanimalsfromdif-
ferent herds are compared [23].
Conclusions
The own dynamics of a beef cattle population bred by
natural service could imply an important exchange of
breeding animals between herds (connections) that
could explain the high CD of comparisons found among
herds. It was worthwhile to use an animal model when
performing the sampling method to estimate the CD
because adding pedigree information and, especially,
considering the connections due to the dams, increased
the CD values. Connectedness in genetic evaluations for
lowly heritable traits can be improved by performing
joint evaluations with more heritable traits with a high
genetic correlation. Maternal effects can also be evalu-
ated better if a high genetic correlation with direct
effects exists. As a result of these links, most of the
Bruna dels Pirineus herds were well connected and the
genetic evaluation will allow producers to identify breed-
ing animals that are potentially be tter than their own,
especially for moderately and highly heritable traits. The
genetic values of animals coming from connected herds
should be published at a “racial level,” while genetic
values of animals coming from disconnected herds
should be used only within herds or provided with a
warning that comparisons between poorly connected
herds may be biased.
List of abbreviations used
BLUP: best linear unbiased prediction; CACO: criterion
of admission to the group of connected herds; CD: coef-
ficient of determination; EBV: estimated breeding values;
YRS: yield recording scheme.
Acknowledgements
JT was supported by a “Juan de la Cierva” research contract from the Spain’s
Ministerio de Educación y Ciencia. This research was financed by Spain’s
Ministerio de Educación y Ciencia (AGL2007-66147-01/GAN grant) and
carried out with data recorded by the Bruna dels Pirineus breed society. The
Yield Recording Scheme of the breed was funded in part by the
Departament d’Agricultura, Alimentació i Acció Rural of the Catalonia
govern.
Authors’ contributions
JT performed the statistical analysis and drafted the manuscript. MF
managed the YRS of the Bruna dels Pirineus breed and revised the
manuscript critically for important intellectual content. JP supervised the YRS,
promoted the study and revised the manuscript critically for important
intellectual content. All authors read and approved the final manuscript for
authors.
Competing interests
The authors declare that they have no competing interests.
Received: 29 September 2009 Accepted: 25 February 2010
Published: 25 February 2010
References
1. Foulley JL, Hanocq E, Boichard D: A criterion for measuring the degree of
connectedness in linear models of genetic evaluation. Genet Sel Evol
1992, 24:315-330.
2. Searle SR: Linear Models Wiley and Sons, New York, NY, USA 1971.
3. Fernando RL, Gianola D, Grossman M: Identifying all connected subsets in
a two-way classification without interaction. J Dairy Sci 1983,
66:1399-1402.
4. Weeks DL, Williams DR: A note on the determination of connectedness in
an N-way cross classification. Technometrics 1964, 6:319-324.
5. Kuehn LA, Lewis RM, Notter DR: Managing the risk of comparing
estimated breeding values across flocks or herds through
connectedness: a review and application. Genet Sel Evol 2007, 39:225-247.
6. Laloë D, Phocas F: A proposal of criteria of robustness analysis in genetic
evaluation. Livest Prod Sci 2003, 80:241-256.
7. Laloë D: Precision and information in linear-models of genetic
evaluation. Genet Sel Evol 1993, 25:557-576.
8. Kennedy BW, Trus D: Considerations on genetic connectedness between
management units under an animal-model. J Anim Sci 1993,
71:2341-2352.
9. Mathur PK, Sullivan BP, Chesnais JP: Measuring connectedness: concept
and application to a large industry program. Proc. 7th World Congress of
Genetics Applied to Livestock Production, 19-23 August 2002, Montpellier,
France 32:545-548.
10. Lewis RM, Crump RE, Simm G, Thompson R: Assessing connectedness in
across-flock genetic evaluations. Proceedings of the British Society of Animal
Science, 22-24 March 1999, Scarborough 121-122.
11. Hanocq E, Boichard D: Connectedness in the French Holstein cattle
population. Genet Sel Evol 1999, 31:163-176.
Tarrés et al. Genetics Selection Evolution 2010, 42:6
/>Page 8 of 9
12. Hofer A: Precision of comparisons of estimated breeding values of
centrally test pigs across herds of origin. Proceedings 5th World Congress
of Genetics Applied to Livestock Production, 7-12 August 1994, Guelph, Canada
18:447-450.
13. Bunter KL, Macbeth GM: Evaluating connectedness between pig herds
using on-farm performance and central test data. Proceedings of the 12th
Conference of the Australian Association of Animal Breeding and Genetics, 9-
11 February 1987, Perth 103-111.
14. Roso VM, Schenkel RS, Miller SP: Degree of connectedness among groups
of centrally tested beef bulls. Can J Anim Sci 2004, 84:37-47.
15. Laloë D, Phocas F, Ménissier F: Considerations on measures of precision
and connectedness in mixed linear models of genetic evaluation. Genet
Sel Evol 1996, 28:359-378.
16. Garcia-Cortes LA, Moreno C, Varona L, Altarriba J: Estimation of prediction
error variances by resampling. J Anim Breed Genet 1995, 112:176-182.
17. Fouilloux MN, Laloë D: A sampling method for estimating the accuracy of
predicted breeding values in genetic evaluation. Genet Sel Evol 2001,
33:473-486.
18. Fouilloux MN, Clément V, Laloë D: Measuring connectedness among
herds in mixed linear models: from theory to practice in large-sized
genetic evaluations. Genet Sel Evol 2008, 40:145-159.
19. Tarrés J, Fina M, Piedrafita J: Medida de la conexión entre explotaciones
de bovinos de carne de la raza Bruna dels Pirineus. Proceedings of the
28th meeting of the Interprofessional Association for Agricultural Development,
12-13 May 2009, Zaragoza, 12-13 May 2009, Zaragoza .
20. Interbull: Interbull Guidelines for National & International Genetic
Evaluation Systems in Dairy Cattle with Focus on Production Traits. 2001,
[ />interbull%20guidelines%202001.pdf].
21. Schaeffer LR: Sire and cow evaluation under multiple trait models. J Dairy
Sci 1984, 67:1567-1580.
22. Phocas F, Laloë D: Genetic parameters for birth and weaning traits in
French specialized beef cattle breeds. Livest Prod Sci 2004, 89:121-128.
23. Kuehn LA, Lewis RM, Notter DR: National sheep improvement program
connectedness in Targhee and Suffolk flocks participating in the United
States. J Anim Sci 2009, 87:507-515.
doi:10.1186/1297-9686-42-6
Cite this article as: Tarrés et al.: Connectedness among herds of beef
cattle bred under natural service. Genetics Selection Evolution 2010 42:6.
Submit your next manuscript to BioMed Central
and take full advantage of:
• Convenient online submission
• Thorough peer review
• No space constraints or color figure charges
• Immediate publication on acceptance
• Inclusion in PubMed, CAS, Scopus and Google Scholar
• Research which is freely available for redistribution
Submit your manuscript at
www.biomedcentral.com/submit
Tarrés et al. Genetics Selection Evolution 2010, 42:6
/>Page 9 of 9