Báo cáo sinh học: " Heritability of longevity in Large White and Landrace sows using continuous time and grouped data models" ppsx
Bạn đang xem bản rút gọn của tài liệu. Xem và tải ngay bản đầy đủ của tài liệu tại đây (790.81 KB, 13 trang )
Genetics
Selection
Evolution
Mészáros et al. Genetics Selection Evolution 2010, 42:13
/>Open Access
RESEARCH
BioMed Central
© 2010 Mészáros et al; licensee BioMed Central Ltd. This is an Open Access article distributed under the terms of the Creative Commons
Attribution License ( which permits unrestricted use, distribution, and reproduction in
any medium, provided the original work is properly cited.
Research
Heritability of longevity in Large White and
Landrace sows using continuous time and grouped
data models
Gábor Mészáros*
1
, Judit Pálos
1
, Vincent Ducrocq
2
and Johann Sölkner
1
Abstract
Background: Using conventional measurements of lifetime, it is not possible to differentiate between productive and
non-productive days during a sow's lifetime and this can lead to estimated breeding values favoring less productive
animals. By rescaling the time axis from continuous to several discrete classes, grouped survival data (discrete survival
time) models can be used instead.
Methods: The productive life length of 12319 Large White and 9833 Landrace sows was analyzed with continuous
scale and grouped data models. Random effect of herd*year, fixed effects of interaction between parity and relative
number of piglets, age at first farrowing and annual herd size change were included in the analysis. The genetic
component was estimated from sire, sire-maternal grandsire, sire-dam, sire-maternal grandsire and animal models, and
the heritabilities computed for each model type in both breeds.
Results: If age at first farrowing was under 43 weeks or above 60 weeks, the risk of culling sows increased. An
interaction between parity and relative litter size was observed, expressed by limited culling during first parity and
severe risk increase of culling sows having small litters later in life. In the Landrace breed, heritabilities ranged between
0.05 and 0.08 (s.e. 0.014-0.020) for the continuous and between 0.07 and 0.11 (s.e. 0.016-0.023) for the grouped data
models, and in the Large White breed, they ranged between 0.08 and 0.14 (s.e. 0.012-0.026) for the continuous and
between 0.08 and 0.13 (s.e. 0.012-0.025) for the grouped data models.
Conclusions: Heritabilities for length of productive life were similar with continuous time and grouped data models in
both breeds. Based on these results and because grouped data models better reflect the economical needs in meat
animals, we conclude that grouped data models are more appropriate in pig.
Background
Length of productive life is important from economical,
herd-health and animal welfare points of view in sustain-
able animal production. Intensive selection on produc-
tion and reproduction traits without considering
functional and exterior traits can lead to decreased lon-
gevity [1,2]. In Austria, exterior traits are taken in account
during selection of replacement gilts before the first
insemination. At this stage only a negative selection is
carried out, without any official recording for later use.
However, data on length of productive life and number of
piglets born/weaned are routinely collected and available
for Herdbook sows. The total number of piglets born or
weaned can also be used to express the lifetime produc-
tion of sows, but genetic evaluation of litter size is already
implemented in the Austrian system.
Length of productive life measured as the number of
days between first farrowing and culling has been ana-
lyzed in several studies using either Cox [3] or Weibull
models [4]. During the productive life of sows, the period
between weaning and conception can be non-productive
and optimally, it should be kept as short as to ensure the
highest number of litters. Using conventional measure-
ments of lifetime (i.e. number of days between first far-
rowing and culling), it is not possible to differentiate
between productive and non-productive days during a
sow's lifetime, which can lead to less pertinent results in
* Correspondence:
1
Division of Livestock Sciences, University of Natural Resources and Applied
Life Sciences, Gregor Mendel Str.33, 1180, Vienna, Austria
Full list of author information is available at the end of the article
Mészáros et al. Genetics Selection Evolution 2010, 42:13
/>Page 2 of 13
breeding value estimation [5]. For this reason, a sow's
productive life would be better expressed as the number
of completed parities.
This approach requires rescaling of the time axis from a
continuous scale into several discrete classes. The conse-
quence of this approach is that Cox and Weibull models
will no longer be valid, because these usual approaches
assume continuity of the baseline hazard distribution
and/or absence of ties between ordered failure times [6].
Instead, grouped survival data (discrete survival time)
models introduced by Prentice and Gloeckler [7] can be
used. Grouped data models have been used in beef cattle
[8], rabbits [9] and dairy cattle to evaluate fertility traits
[10], but not for length of productive life in pigs.
The aim of this study is to compare the performance of
Weibull and grouped data models and to estimate herita-
bilities using different genetic models for Large White
and Landrace sows.
Methods
Data
Length of productive life was analyzed for 12319 Large
White sows originating from 838 boars and 4348 dams
and for 9833 Landrace sows originating from 457 boars
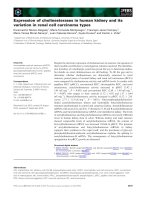
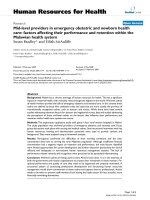
and 2236 dams. Overall survival for both populations is
shown in Figure 1. All sows were purebred and were part
of the herd book in nucleus or multiplier herds. Records
from breeding farms represented 10% of the Landrace
sows and 40% of the Large White sows. Landrace and
Large White animals are used on breeding farms in
Lower and Upper Austria, crossed with Large White ani-
mals on the multiplier level. In Steiermark, the Large
White breed is used on both breeder and multiplier lev-
els. In some cases, breeding farms also produce F1 sows if
these can be marketed for a good price. For these reasons,
breeding and multiplier farms were difficult to distin-
guish and thus, in this study, they were analyzed jointly.
In all cases, F1 sows are mated with Pietrain boars on the
piglet producer level in Austria.
For the Weibull model, length of productive life was
defined as the number of days between first farrowing
and culling. We assumed that culling took place either at
the last weaning of the sow or 28 days after the last far-
rowing if the number of weaned piglets was known, but if
both weaning date and number of weaned piglets were
missing, culling date was set one day after the last farrow-
ing. The choice of setting the culling date at 28 days after
the last farrowing for sows with incomplete weaning date
was based on the average nursing period in the whole
dataset.
Two intervals per parity were used for the grouped data
model: from farrowing to weaning and from weaning to
the next farrowing. Intervals were numbered sequentially
from 1 up to 18 (i.e. sow alive after the 9
th
weaning). Ani-
mals were censored either at the date of the last weaning,
if they were alive at the time of data collection or at the 9
th
weaning if they were alive at the 10
th
farrowing. Only
sows born after 1995 were included in the evaluation and
age at first farrowing between 250 and 550 days was
required.
The analysis was carried out using a proportional haz-
ards model (assumed to be either the Weibull model or a
grouped data model) with the Survival Kit v6 program
package [11].
Continuous time model
The continuous length of productive life was analyzed
with the following Weibull model:
where h*y
i
is the time-dependent random effect of herd
and year of farrowing assumed to follow a log-gamma
distribution, aff
j
the fixed time independent effect of class
of age at first farrowing, par*pigl
k
the time-dependent
effect of interaction between parity and relative number
of piglets (see below for detailed description), hs
l
the
time-dependent effect of annual herd size change. The
random genetic component g
m
differed, defining an ani-
mal, sire, sire-maternal grandsire, sire-dam or sire-mater-
nal grandsire-dam within a maternal grandsire genetic
model.
For age at first farrowing, 33 classes were created with
one-week intervals, where the first group contained ani-
mals up to 43 weeks of age and the last group contained
animals older than 75 weeks at first farrowing.
Parity and classes for piglets born alive relative to the
annual herd's mean were combined into an interaction
term and included into the model (similar to [12]). This
was done in several steps:
h t x h t h y aff par pigl
hs g
ij k
lm
( ; ) ( )exp{
}
=×++×
++
0
Figure 1 Survival in percents for Large White and Landrace pop-
ulations.
Mészáros et al. Genetics Selection Evolution 2010, 42:13
/>Page 3 of 13
Step 1: The number of piglets born alive was cor-
rected for the first farrowing litter size. This was nec-
essary, because the average number of piglets born at
first farrowing is lower than that at later farrowing;
where n is the number of the parity ranging between 2
and 6. Parities 6 and higher were treated in the same way,
because of very similar coefficients. The values for the
coefficients between parity 2 and parity 6 were: 1.055,
1.0877, 1.0922, 1.0853 and 1.0473;
where cnp is the corrected number of piglets and n is
the number of the parity ranging between 2 and 6.
Step 2: The average number of piglets for each year
within each herd (h × y) was computed;
Step 3: The previously corrected numbers of piglets
born alive (in Step 1) were compared to the annual
herd's mean (computed in step 2).
where cnp is the corrected number of piglets born alive
and m is the number of the parity ranging between 1 and
9 (maximal parity after censoring).
Ten classes (relative piglet classes or RPC) were created
according to percentage deviation from the herd mean, as
follows: <75%, 75-85%, 85-90%, 90-95%, 95-100%, 100-
105%, 105-110%, 110-115%, 115-125% and >125%. RPC
were inserted in the model as an interaction term with
the parity number. Classes were recoded as numbers with
three digits, where the first digit denoted the parity num-
ber (from 1 to 9), and the last two digits the RPC class
(from 1 to 10).
Similarly the annual herd size changes were grouped
into eight classes, according to number of farrowing per
herd and year, where January 1
st
of each year was consid-
ered as cut point. In case the number of farrowings was
equal or below 10, no change was accounted for that par-
ticular year. The bounds for classes were: decrease by
more than 50%, decrease by 30-50%, 30-10%, between
decrease by 10% and increase by 10%, increase by 10-30%,
30-50%, 50-100% and increase by 100% and more.
Longevity of sows can also be influenced by index val-
ues on growth traits but since these indexes are not rou-
tinely saved in Austria, we could not include them into
the models.
Grouped data model
Grouped data models are a special case of proportional
hazards models, where failure times are grouped into
intervals A
i
= [a
i-1
, a
i
), i = 1, , r with a
0
= 0, a
r
= +infinite
and failure times in A
i
are recoded as t
i
. Therefore the
regression vector is assumed to be time-dependent but
fixed within each time interval [7].
For the grouped data models, the same effects as for the
Weibull model were used.
Genetic models and heritability computation
For both Large White and Landrace databases, the same
structure of fixed and random effects was used. All mod-
els accounted for pedigree information up to the third
generation of ancestors. The genetic variance was esti-
mated as the mode of its approximate posterior density
after Laplace integration of the other parameters [13]. At
the same time, the mean, variance and skewness of this
posterior density were obtained. Knowing these three
parameters, makes it possible to draw the posterior den-
sity of the variance component using a Gram-Charlier
approximation.
The standard deviation of the posterior density can be
interpreted as a conservative estimate of the standard
error. From this, the standard error of the heritabilities
was computed using the Delta method (see e.g. [14]).
Sire model
In this case, the sow's sire was included in the model,
accounting for 1/4 of the genetic variance. To be correct,
the model implicitly assumes that mates are non-related,
non-inbred, non-selected and that each dam has one
recorded progeny only. The pedigree file contained the
sires' sire and sires' maternal grandsire.
The effective heritability was computed from the sire's
variance as in Yazdi et al. [15]. The effective heritability
accounts for censoring in contrast with the equivalent
heritability which conceptually assumes that all animals
have died. The effective reliability is useful to compute
expected reliabilities of EBV as a function of the expected
number of animals still alive at a given time. The effect of
the herd-year was treated as a time-dependent random
variable assuming a loggamma distribution in all cases.
The following equation was used:
coef n
x piglets born alive in parity
x piglets born alive in p
[]
=
[]
()
n
aarity 1
()
cnp n
piglets born alive in parity n
coef n
[]
=
[]
[]
x piglets h y
piglets born alive in h y
farrowings in h y
×
()
=
×
∑
×
∑
relative litter size
cnp m
x piglets h y
=
[]
×
()
⎛
⎝
⎜
⎜
⎞
⎠
⎟
⎟
*%100
hsire
G
p
G
hy
2
2
1
2
4
()
=
++ ×
ss
ss
var( )
Mészáros et al. Genetics Selection Evolution 2010, 42:13
/>Page 4 of 13
where is the genetic variance, var(h × y) the herd
year variance, p the proportion of uncensored animals
and genetic variance = 4 * sire variance.
Sire - maternal grandsire model
This was similar to the sire model, but the sow's maternal
grandsire was also included in the model and recoded
jointly with the sires. This model accounts for 1/4 + 1/16
= 5/16 of the genetic variance under the same assump-
tions as the sire model (i.e. mates are non-related, non-
inbred, non-selected and each dam has one progeny
only). Additionally dams can be related and selected
through their sire (i.e. the maternal grandsire of the prog-
eny).
The pedigree file had the same structure and the herita-
bility was computed with the equation:
where is the genetic variance, var(h × y) the herd
year variance, p the proportion of uncensored animals
and genetic variance = 4 * sire variance. The additional 1/
16 genetic variance in the denominator stands for the
maternal grandsire's variance.
Sire - dam model
Here both the sire and dam were included in the model,
but recoded together in the data preparation step. Both
sire and dam account for half of the genetic variance, and
full-sibs are therefore recognized as being more similar
than half-sibs. For both parents of the sow, their sire and
dam were included in the pedigree file. The effective her-
itability was computed as:
where is the genetic variance, var(h × y) the herd
year variance, p the proportion of uncensored animals
and genetic variance = 4 * sire variance. The genetic vari-
ance was multiplied by 2 in the denominator (compared
to the sire model) because the sire and dam variances are
assumed equal.
Sire - maternal grandsire - dam within maternal grandsire
This model is in some sense a compromise between sire-
maternal grandsire and sire-dam models, because the
relationship matrix involves only males and it still
accounts for repeated records. The sow's sire and mater-
nal grandsire are recoded together in the data prepara-
tion step. In the final model the sire, maternal grandsire
and dam of the sow are included as separate random
effects.
This model does not account for the Mendelian sam-
pling term of the animal but in contrast with the sire-
maternal grandsire model, sisters can have different
genetic values and more than one progeny each in which
case a non genetic maternal effect is also accounted for.
The main difference with a sire-dam model including a
maternal effect is that dams are considered as related only
through their sire (i.e. maternal grand dams are supposed
to be unselected and to have only one progeny each).
The heritability was computed as:
where is the genetic variance, var(h × y) the herd
year variance, p the proportion of uncensored animals,
the dam within maternal grandsire variance
and genetic variance = 4 * sire variance. The additional 1/
16 genetic variance in the denominator stands for the
maternal grandsire variance.
Animal model
In this case, the animal effect is responsible for the entire
genetic variance and all its ancestors are accounted for. It
is included in the evaluated model as a random effect, as
well as the pedigree file together with its sire and dam.
The heritability is computed as follows:
where is the genetic variance, var(h × y) the herd
year variance, p the proportion of uncensored animals.
Results
Results for fixed effects
A brief statistical overview of the databases is presented
in Table 1. The total proportion of right censored sows
ss
G
2
hsiremgs
G
p
G
hy
2
2
15
16
2
−
()
=
++×
ss
ss
var( )
ss
G
2
hsiredam
G
p
G
hy
2
2
1
2
2
−
()
=
++ ×
s
s
var( )
ss
G
2
hsmgsd
G
p
G
dam mgs
hy
2
2
15
16
22
()
=
++
−
+×
ss
ssss
var( )
ss
G
2
ss
dam mgs−
2
hanimal
G
p
G
hy
2
2
1
2
()
=
++ ×
s
ss
var( )
ss
G
2
Mészáros et al. Genetics Selection Evolution 2010, 42:13
/>Page 5 of 13
was 26.4% in the Large White and 22.3% in the Landrace
database. Landrace sows lived 92 days longer and com-
pleted 0.56 more parities on average, compared to Large
White sows. Standard deviations were large in both cases.
Large White sows had approximately 0.5 more piglets per
farrowing. The average age at first farrowing was similar
in both populations.
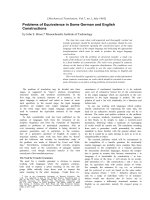
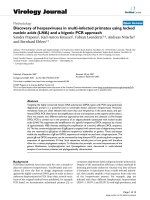
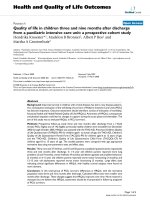
Similar trends for the risk ratios of age at first farrowing
were found for all models and also across breeds (Figures
2 and 3). A high risk of culling was observed for sows
which had their first litter at a very young age, compared
to the reference class (risk ratio = 1) at week 52 for Large
White and week 51 for Landrace sows. After this, a longer
period with a moderate risk follows, approximately till 59
weeks of age, after which the risk of culling increased
again.
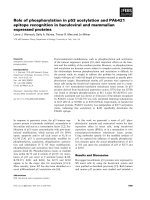
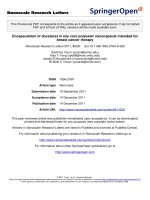
As for the interaction between parity and RPC, the risk
ratios for classes were different between breeds and
model types (continuous time or grouped data). The risk
ratios from the grouped data models were similar during
the first parity, but were higher later on, compared to
continuous time models, as showed in Figure 4. Within
breed and model type, the risks of culling for the classes
were similar, regardless of the genetic component.
Within parities the risk was highest for sows with a lit-
ter size below 75% of the herd's average in a given year,
with only a slight decrease for sows with a higher number
of piglets. First parities of both Large White and Landrace
sows seemed to be exceptions from this pattern. In Large
White sows, only a slight decrease of the risk ratio was
observed throughout the classes and the peak value for
the worst class was much lower. In Landrace sows, the
risk ratio was much higher for sows with a litter size
below that of the farm's average, but for the other classes
no clear tendency was observed.
For Large White sows, the risk ratios were similar for
farrowings 2 to 4 in both Weibull and grouped data mod-
els and from parity 6 (not shown) it increased. However,
during the last parity the risk dropped for the grouped
data model, compared to the Weibull model. For Lan-
drace sows, the risk ratios were similar only for the first
three parities in grouped data models, and increased
from parity 4 onwards. Again during the last parity (not
shown) the risk ratio dropped considerably. Unlike the
other cases, the risk of culling decreased between parities
for the Weibull model in the Landrace breed.
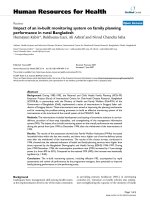
The risk of culling in both populations was highest for
sows from herds with a rapid size decrease (Figure 5), as
Table 1: Statistical overview
Large White
a
Landrace
b
mean std mean std
Parity 4.14 2.87 4.70 3.03
non-censored 4.31 2.94 4.81 3.08
censored 3.55 2.52 4.09 2.62
LPL at last litter (days) 503 456 595 481
non-censored 531 467 615 490
censored 401 397 485 412
Piglets born alive per
parity
10.57 1.62 9.96 1.47
non-censored 10.35 1.53 9.87 1.45
censored 11.36 1.67 10.50 1.51
Age at first farrowing
(days)
378 43 367 37
non-censored 378 44 367 37
censored 380 40 370 36
a
total number of records: 12319, number of non-censored: 9645, number of censored: 2674;
b
total number of records: 9833, number of non-
censored: 8332, number of censored: 1501
Mészáros et al. Genetics Selection Evolution 2010, 42:13
/>Page 6 of 13
expected. The opposite tendency was not clear for grow-
ing farms: the risk remained virtually the same whether
the herd size decreased by less than 30% or increased to
by whatever percent.
Heritabilities
The estimated genetic variances and heritabilities
together with their standard errors for all models in both
breeds are given in Tables 2 and 3. The posterior density
of the genetic variance for each model is presented in Fig-
ure 6. These figures show that all genetic variances are
statistically different from 0 and that the confidence
intervals (credible sets) are quite wide. For a given breed
and type of model (Weibull vs. grouped data), the poste-
rior densities overlap to a large extent. In general, herita-
bilities differ slightly depending on the breed and genetic
Figure 2 Risk ratios for classes of age at first farrowing in Large White sows. n = number of uncensored observations; the arrow indicates the
reference class.
Figure 3 Risk ratios for classes of age at first farrowing in Landrace sows. n = number of uncensored observations; the arrow indicates the ref-
erence class.
Mészáros et al. Genetics Selection Evolution 2010, 42:13
/>Page 7 of 13
model used. For a given genetic model, genetic variances
and heritabilities are extremely similar in grouped data
and continuous time models for the Large White breed,
but they are systematically higher in the grouped data
model for the Landrace breed.
For the Landrace breed, heritabilities range between
0.05 and 0.08 (s.e. 0.014 - 0.020) for the continuous time
and between 0.07 and 0.11 (s.e. 0.016 - 0.023) for the
grouped data models. Heritabilities for Large White sows
range between 0.08 and 0.14 (s.e. 0.012 - 0.026) for the
continuous time and between 0.08 and 0.13 (s.e. 0.012 -
0.025) for the grouped data models. Whatever the breed,
heritabilities are highest for the sire and sire-dam models.
The sire-mgs and the sire-mgs-dam within mgs models
gave similar, but smaller heritabilities. For the latter
model, the dam within mgs variance is supposed to
include 3/16 of the genetic variance plus the maternal
non genetic effect variance if such an effect exists. In fact,
for the Large White breed, the estimated within mgs vari-
ance of the dam (0.016/0.015) was smaller than 3/16 of
Figure 4 Risk ratios for parity*RPC in Large White. Note: The three digit classes on the x axis stand for parity (hundreds) and class of relative piglet
classes (tens and ones); for example 201 is the lowest RPC class in parity 2; the arrow indicates the reference class.
Figure 5 Risk ratios for annual herd size change in Large White sows. The arrow indicates the reference class.
Mészáros et al. Genetics Selection Evolution 2010, 42:13
/>Page 8 of 13
the estimated genetic variance (0.031 for both models).
This inconsistency was not observed in the Landrace
breed. Hence, if a maternal non genetic effect exists, it
should be very small. Finally, the lowest genetic variances
and heritabilities were obtained with the animal model.
Discussion
The average length of productive life in the whole dataset
was 503 days for Large White and 596 days for Landrace
sows, with large standard deviations. Results for the Lan-
drace breed were comparable, but for the Large White
breed, they were lower than those reported in the litera-
ture i.e. 617 days in [16] and 602 days in [4]. Such results
are heavily dependent on the amount of censored records
and the length of the study period.
Prolonged productive life is important for two main
reasons: 1. in general, the number of piglets born during
farrowing 3 and 4 is higher than during the first farrow-
ings, which means that with a higher proportion of older
sows, piglet production increases. 2. On breeding farms
with short generation intervals, it is especially important
that only a low proportion of sows be culled for health
and fertility problems, and the remaining ones be
selected according to production traits, like litter size, fat-
tening or carcass traits.
Our results show that age at first farrowing affects the
risk of culling only for animals that have their first litter
very early or late in life. A very young sow is not prepared
to give birth because of its body development is not suffi-
cient. This particular problem seems to affect only sows
farrowed before 43 weeks of age. This result is in agree-
ment with [17] in Danish Landrace herds for which in the
case of an early first mating i.e. before 210 days of age, the
risk for culling was higher than for sows mated later.
Table 2: Genetic variances and heritabilities for Large White (herd*year var = 0.325)
Genetic models Continuous scale Grouped data scale
variance (std
deviation)
heritability (std
deviation)
variance (std
deviation)
heritability (std
deviation)
Animal 0.140 (0.024) 0.077 (0.012) 0.140 (0.025) 0.077 (0.012)
Sire mgs dam 0.169
a
(0.018) 0.097 (0.023) 0.166
b
(0.017) 0.095 (0.023)
Sire dam 0.202 (0.035) 0.113 (0.018) 0.197 (0.034) 0.111 (0.018)
Sire mgs 0.171 (0.018) 0.098 (0.020) 0.167 (0.017) 0.097 (0.019)
Sire 0.246 (0.023) 0.141 (0.026) 0.230 (0.022) 0.132 (0.025)
a
dam within maternal grandsire (mgs) variance = 0.016;
b
dam within maternal grandsire variance = 0.015
Table 3: Genetic variances and heritabilities for Landrace (herd*year var = 0.233)
Genetic models Continuous scale Grouped data scale
Variance (std
deviation)
Heritability (std
deviation)
Variance (std
deviation)
Heritability (std
deviation)
Animal 0.078 (0.025) 0.049 (0.015) 0.122 (0.033) 0.074 (0.019)
Sire mgs dam 0.074
a
(0.011) 0.047 (0.014) 0.104
b
(0.013) 0.066 (0.016)
Sire dam 0.123 (0.025) 0.078 (0.015) 0.184 (0.032) 0.114 (0.019)
Sire mgs 0.078 (0.011) 0.050 (0.014) 0.108 (0.013) 0.069 (0.017)
Sire 0.115 (0.015) 0.074 (0.020) 0.163 (0.018) 0.105 (0.023)
a
dam within maternal grandsire (mgs) variance = 0.027;
b
dam within maternal grandsire variance = 0.029
Mészáros et al. Genetics Selection Evolution 2010, 42:13
/>Page 9 of 13
After the 43rd week, the risk ratio dropped to a level
around that of the reference class. Age at first farrowing
increased the risk of culling again, for sows older than 60
weeks. If we assume that all sows are supposed to be put
into reproduction at the same age, then it is likely that
these sows had certain problems preventing them to con-
ceive earlier. If these problems had persisted, they could
have been culled early based on the higher risk ratios.
Similar results have been published by [2,16,17].
When the production level of the animals is included in
the statistical model, the genetic value of the "functional"
length of productive life can be approximated, as produc-
tion is usually the main source of voluntary culling.
Hopefully, selection on functional longevity would lead to
a reduction in involuntary culling because of reproduc-
tion or health problems. When the production of the ani-
mal is not taken into account in the model, the genetic
effect reflects the "true" longevity, which means that vol-
untary (i.e. for low production) and involuntary culling
reasons are considered together.
In this paper, we have decided to focus on functional
longevity, and therefore, we have included the number of
piglets born alive relative to the annual herd's mean in
our model, to account for phenotypic selection on litter
size. Working only with absolute numbers of piglets
would not be appropriate, because production at a young
age is generally lower than at an age when the body is
fully developed (milk production in cows [18], goats [19],
litter size in sheep [20], litter size in pigs [21]). Also cull-
ing decisions based on litter size may vary with herd
management and year. In other words, the same litter size
can be treated differently in different farms or on the
same farm in different years. It is therefore necessary to
evaluate the farmers' decisions based on time and place,
when and where they take place.
The risk ratios for the interaction between parity and
RPC decreased within parity. This means that sows with a
higher number of piglets born alive are clearly favoured,
regardless of age of the sow or farrowing number. In most
cases the risk of culling for sows with litters 25% above
the herd's average is two to three times lower than for
Figure 6 Posterior density curves for Landrace and Large White sows. wide black line: animal model; dashed line: sire-maternal grand sire model;
thin black: thin black line: sire-maternal grand sire (dam within maternal grand sire mode; dark grey line: sire model; light grey line: sire-dam model.
Large White - Weibull model
0 0,1 0,2 0,3 0,4
Genetic variance
Posterior density
L
andrace - Weibull model
00,10,20,30,4
Genetic variance
Posterior density
Large White - Grouped model
0 0,05 0,1 0,15 0,2 0,25 0,3 0,35 0,4
Genetic variance
Posterior density
Landrace - Grouped model
0 0,1 0,2 0,3 0,4
Genetic variance
Posterior density
Mészáros et al. Genetics Selection Evolution 2010, 42:13
/>Page 10 of 13
sows 25% under the herd's average. This was not the case
at first parity, when the risk was only slightly lower for
Large White sows, and without any clear tendency for
nearly all classes of Landrace sows. The reason can be
that the farmer did not want to cull the younger sows
with a low number of piglets immediately, but rather
wanted to give them another chance. Our results are sim-
ilar to those of [4] for risk ratios between parities.
Although in our case the parity number was included in
an interaction term, the risk ratios followed a similar pat-
tern.
The results can be compared better with the studies by
[2,3] who also evaluated the risk of culling as an interac-
tion term with parity number. In both cases, they found
an increased risk of culling for sows with poor perfor-
mance, which is similar to our results. There was a differ-
ence when comparing risk of culling between parities.
Engblom et al. [2] have found that the risk of culling was
relatively low for parities 2 to 7, while in our study, risks
of culling were similar throughout the first parities and
increased later in life. Brandt et al. [3] have used stan-
dardized values for the number of piglets born and have
reported a relatively stable risk at the beginning of the
productive life. They have concluded that culling deci-
sions based on performance are made between parities 4
and 5. These results are in agreement with our findings,
which show that the risk of culling was low for the first
parities, and increased from parity 4 in Landrace sows. In
Large White sows, the risk of culling was higher in pari-
ties 2 to 6, compared to the first parity, with an even more
rapid increase from parity 7 onwards.
The risk of culling for effect of herd size change was
similar for both breeds. The risk was highest for sows
from herds that dramatically decreased in numbers with
more than 50%. Decrease of farm size to such an extent
could mean, that some extraordinary event happened
(major financial problems or disease outbreak), which led
to closure of the farm or extreme shrinkage of the herd. In
the future, these records should be treated as right cen-
sored, because most likely the majority of the animals
would live longer in normal circumstances.
In Large White herds for the second worst class, the
risk was twice the one of the reference class, but it was
stable in the case of only a slight decrease or increase in
herd size. For the Landrace dataset the risk was extremely
high for the worst class, but decreased rapidly in the sec-
ond worst category, when the risk of culling was only 1.5
times higher for the Weibull model and 1.3 times higher
for the grouped data model, in comparison with the refer-
ence class. Only a slight reduction in risk of culling for
Large White herds increasing in size by more than 50%
was detected. These results suggest that the farmer's
decision to increase his herd size has a lower impact on
keeping existing animals in the herd compared to the
culling as a result of herd shrinkage. This indicates that
the culling process on these farms continues in its usual
way, probably because the expansion is done by introduc-
ing younger animals either from their own production or
from other farms.
Growth performance undoubtedly influences the
length of the productive life in pigs, and as such it should
be included in the evaluation. New indexes for growth are
calculated every two weeks in Austria and selection is
based on these indexes. Including these in our models
would be desirable, but unfortunately these indexes are
not routinely saved. Nevertheless, the functional length
of productive life could be modelled even better if they
are added in the model.
Genetic models
Most estimations of genetic variance in survival models
have been based on sire or sire-maternal grand sire mod-
els [4,16,22,23]. Two reasons have justified such choices:
first, the Laplace approximation of the posterior density
of the genetic variance requires the repeated inversion of
the Hessian matrix of the log-posterior density, which
quickly becomes too time-consuming for large (animal
model) applications. Due to the existence of time-depen-
dent variables, this matrix is often less sparse than the
usual mixed model coefficient matrix. Second, the quality
of the Laplace approximation has been shown to depend
on the number of observations per level of genetic effects
[13]. Indeed, for many years, it was believed that animal
models could not fit with the Survival Kit because of this
alleged poor performance of the Laplace approximation.
It has been shown recently (see [24] for references) that
this concern was not justified when the data structure is
adequate (several generations of related females).
Increase in computing power has also made estimation
easier for animal models on larger populations.
In this study, the sire model systematically led to the
largest estimates of genetic variances (140 to 180% of the
animal model genetic variance). However, it can be noted
that there is a large uncertainty associated with the esti-
mation of the genetic variance and that the overlap of its
credible set with those of the other models is large. It has
been claimed that the sire survival model is not consis-
tent [25] because the error term of the survival models is
not normally distributed and therefore does not properly
include the remaining 3/4 of the genetic variance. One
potential reason for the overestimation of the genetic
variance may be a poor partition of the genetic variance
between the sire variance and the error term.
In contrast, animal models gave low estimates of
genetic variances and heritabilities. The other models
gave estimates of genetic parameters very similar to the
Mészáros et al. Genetics Selection Evolution 2010, 42:13
/>Page 11 of 13
animal model in Landrace sows, but intermediate
between the sire and animal models in Large White sows.
The reason of this difference between breeds is unclear.
Whatever the breed, the sire-mgs-dam within mgs does
not present much advantage: the genetic variance esti-
mates are almost exactly those obtained with the sire-mgs
model and the dam component is small, not even repre-
senting the expected 3/16 of the genetic variance in Large
White sows. The use of an animal model or a sire-mgs
model to estimate the genetic variance seems advisable to
account for all (or most) of the relationships in the popu-
lation. The sire-mgs is less satisfactory from a modelling
point of view but is favourable when the data structure is
not adequate for the use of the animal model and also for
easier computing.
Heritabilities in our study ranged between 0.08 and
0.14 for Large White and between 0.04 and 0.11 for Lan-
drace sows depending on the model type. In general, her-
itabilities showed some variation, but after considering
the standard error of estimates it seems that none of the
genetic models is clearly superior to another.
To compare our results with those of other authors, we
considered only the studies using survival analysis and
not those using linear models, because estimates from
these methods are not comparable [23].
Yazdi et al. [16] have published a rather wide range of
heritabilities for longevity in Landrace populations rang-
ing from 0.11 to 0.27. Serenius and Stalder [23] have
found heritabilities around 0.16-0.17 for Landrace and
0.17-0.19 for Large White populations. It is important to
note that, in both these papers, heritabilities were com-
puted assuming that the residual effects followed an
extreme value distribution with the variance π
2
/6, while
we used the effective heritability according to [15]. This
could potentially lead to differences in results depending
on parameters of the Weibull distribution. For more
details see [15]. In other words the direct comparison of
heritabilities on log or original scale and the effective her-
itability is not possible.
To obtain more comparable results, we used the vari-
ances of [16,23] and inserted them in the equation of [15]
(the same as we used for the sire model in our study). We
used the sire variance of 0.037 in [16] using a model sce-
nario similar to that in our study (herd*year treated as
random, time dependent variable with 1 year intervals,
with gamma parameter 5.76). Based on the estimated
variance of the random herd*year effect and computed
from the estimate of the gamma parameter, their effective
heritability was 0.09. This result is very similar to our
result of 0.07 from the sire model in the Landrace breed.
Using the same approach, we recalculated the heritabil-
ity from [23] using the original sire's variances 0.068 to
0.081, resulting in effective heritabilities ranging between
0.18 and 0.21. These newly computed results were close
to those in the paper (0.16-0.19) and were higher than our
results in all cases. The herd*year effect was treated as a
time-dependent fixed effect in this study, so no further
adjustment was possible.
Engblom et al. [22] have used the same heritability defi-
nition as in our study, and found values of 0.06 for Lan-
drace and 0.12 for Yorkshire (Large White) breeds with a
sire survival model. Our study supports the previous
findings that heritabilities for longevity in different
breeds are not necessarily the same, even when using
identical models. Their results were very similar to h
2
=
0.07 for Landrace and h
2
= 0.14 for Large White in our
sire models.
Continuous time vs. grouped data model
The production cycle (interval between two farrowings)
in sows consists of three periods: gestation period, suck-
ling period and days open (service period). The heritabil-
ity for gestation length is 0.25-0.3 [26,27], but altering its
length is not a breeding objective. In the Austrian Large
White population, the mean gestation length is 114.8 ±
1.5 days, and in the Landrace 115.3 ± 1.5 days. The nurs-
ing period is heavily affected by breeders' decision for
herd management. It is usually four weeks in Austria for
both Large White (28.2 ± 5.0 days) and Landrace (28.2 ±
6.6 days) populations. The interval from weaning to first
ovulation is optimally 5 to 6 days. If fertilisation is not
successful, it can be longer with cycles repeated every 21
days. The time intervals for days open show much wider
variation compared to gestation length and nursing
period, with 16.0 ± 17.2 days in Large White and 14.0 ±
17.3 days in Landrace populations. From the average val-
ues and standard deviations of these three major compo-
nents of the farrowing interval, it is obvious that the
larger part of the variation is caused by days open. When
considering days of productive life as the dependent vari-
able, sows with longer reproductive cycles will tend to
have higher estimated breeding values. This inconsis-
tency is lifted when using grouped data models [6,8].
More reproductive cycles increase the breeding value of
an animal not because it lives longer, but because it pro-
duces more.
Conclusions
In this study, alternative models for the genetic evaluation
of longevity in sows using continuous time and grouped
data models in Large White and Landrace sows were
examined. Risk of culling associated with length of pro-
ductive life was influenced by all fixed and random
effects. An increased risk was observed for animals hav-
ing their first litter before 43 weeks or after 60 weeks of
age, for sows from herds rapidly decreasing in size and
Mészáros et al. Genetics Selection Evolution 2010, 42:13
/>Page 12 of 13
sows with litter size under the herd's average in the given
year. Some differences between the two breeds were
observed, but in general the risks of culling for fixed
effects in all models were comparable.
Heritabilities for the length of productive life were esti-
mated using sire, sire-maternal grandsire, sire-dam, sire-
maternal grandsire-dam within maternal grandsire and
animal models with Weibull and grouped data models in
both breeds. They ranged from 0.08 to 0.14 (s.e. 0.012-
0.026) in Weibull and from 0.08 to 0.13 (s.e. 0.012-0.025)
in grouped data models in Large White sows, and from
0.05 to 0.08 (s.e. 0.014-0.020) for the Weibull and from
0.07 to 0.11 (s.e. 0.016-0.023) for the grouped data models
in Landrace sows. Sire-mgs models offer a good compro-
mise between accurate modelling of the genetic part and
computation requirements in case the data structure is
not adequate to use an animal model. Heritabilities are
low as for functional traits in general, but given the high
economic importance of the length of productive life, it is
really worthwhile to consider it as a selection criterion in
pig breeding.
The grouped data models in pig tend to focus on the
exact number of reproduction cycles rather than on the
duration of productive life. Therefore sows with a higher
number of parities are favoured, in contrast with sows
which live longer just because of longer intervals between
parities. The performance of grouped data models was
comparable to continuous time models. Based on these
results and because grouped data models reflect better
the economical needs in meat animals, we conclude that
grouped data models are more appropriate in pig.
The final outcome of the study is to provide basic infor-
mation for routine genetic evaluation of the length of
productive life in Austrian pig populations. The grouped
data model will be used for its favourable contribution to
deal with the non-productive days during a sow's lifetime.
Competing interests
The authors declare that they have no competing interests.
Authors' contributions
JS conceived the original idea of the study and reviewed the text. VD further
developed the idea, helped with the analysis, wrote parts of the text and
helped with the revision of existing parts. JP did the statistical analysis and
helped to write the text. GM wrote the manuscript, did the initial data prepara-
tion and helped with the statistical analysis. All authors approved the final ver-
sion.
Acknowledgements
The authors would like to acknowledge Austrian Pig Producers, the Federal
Ministry of Agriculture, Österreichische Schweineprüfanstalt GesmbH for
founding the project "Genetic Analysis of Lifetime Production (Longevity and
Fertility) of Sows" and Austrian Science Found for funding the project "Corre-
lated random effects in survival analysis applied to problems in genetics and
epidemiology of dairy cattle and human population", which made the publica-
tion of this paper possible. The constructive criticisms and valuable sugges-
tions of both reviewers are greatly appreciated.
Author Details
1
Division of Livestock Sciences, University of Natural Resources and Applied
Life Sciences, Gregor Mendel Str.33, 1180, Vienna, Austria and
2
UMR 1313 INRA,
Génétique Animale et Biologie Intégrative, 78352 Jouy-en-Josas, France
References
1. Knaus W: Dairy cows trapped between performance demands and
adaptability. J Sci Food Agr 2009, 89:1107-1114.
2. Engblom L, Lundeheim N, Strandberg E, del PS, Dalin AM, Andersson K:
Factors affecting length of productive life in Swedish commercial
sows. J Anim Sci 2008, 86:432-441.
3. Brandt H, von Brevern N, Glodek P: Factors affecting survival rate of
crossbred sows in weaner production. Livest Prod Sci 1999, 57:127-135.
4. Tarres J, Bidanel JP, Hofer A, Ducrocq V: Analysis of longevity and exterior
traits on Large White sows in Switzerland. J Anim Sci 2006,
84:2914-2924.
5. Árnason Th, Björnsdóttir S: Heritability of age-at-onset of bone spavin in
Icelandic horses estimated by survival analysis. Livest Prod Sci 2003,
79:285-293.
6. Ducrocq V: Extension of survival analysis models to discrete measures
of longevity. Interbull Bull 1999, 21:41-47.
7. Prentice RL, Gloeckler LA: Regression analysis of grouped survival data
with application to breast cancer data. Biometrics 1978, 34:57-67.
8. Phocas F, Ducrocq V: Discrete vs continuous time survival analysis of
productive life of Charolais cows. Proceedings of the 8th World Congress
on Genetics Applied to Livestock Production: August 13-18 2006; Belo
Horizonte 2006. communication 03-13
9. Piles M, Garreau H, Rafel O, Larzul C, Ramon J, Ducrocq V: Survival analysis
in two lines of rabbits selected for reproductive traits. J Anim Sci 2006,
84:1658-1665.
10. Schneider Md, Strandberg E, Ducrocq V, Roth A: Short communication:
Genetic evaluation of the interval from first to last insemination with
survival analysis and linear models. J Dairy Sci 2006, 89:4903-4906.
11. Ducrocq V, Sölkner J, Mészáros G: Survival Kit v6 - A software package
for survival analysis. 9th World Congress on Genetics Applied to Livestock
Production, August 1-6 2010, Leipzig .
12. Vukasovic N, Moll J, Casanova L: Implementation of routine genetic
evaluation for longevity based on survival analysis techniques in dairy
cattle populations in Switzerland. J Dairy Sci 2001, 84:2073-2080.
13. Ducrocq V, Casella G: A Bayesian analysis of mixed survival models.
Genet Sel Evol 1996, 28:505-531.
14. Lynch M, Walsh JB: Genetics and Analysis of Quantitative Traits Sunderland,
MA: Sinauer Assocs., Inc.; 1998.
15. Yazdi MH, Visscher PM, Ducrocq V, Thompson R: Heritability, reliability of
genetic evaluations and response to selection in proportional hazard
models. J Dairy Sci 2002, 85:1563-1577.
16. Yazdi MH, Rydhmer L, Ringmar-Cederberg E, Lundeheim N, Johansson K:
Genetic study of longevity in Swedish Landrace sows. Livest Prod Sci
2000, 63:255-264.
17. Damgaard LH: The use of survival models to infer phenotypic and
genetic aspects of longevity of sows. Plant and Animal Genomes XIV
Conference, 14-18 January 2006, San Diego 2006.
18. Carlen E, Strandberg E, Roth A: Genetic parameters for clinical mastitis,
somatic cell score, and production in the first three lactations of
Swedish Holstein cows. J Dairy Sci 2004, 87:3062-3070.
19. Mellado M, Foote RH, Borrego E: Lactational performance, prolificacy
and relationship to parity and body weight in crossbred native goats in
northern Mexico. Small Rumin Res 1991, 6:167-174.
20. Pollott GE, Gootwine E: Reproductive performance and milk production
of Assaf sheep in an intensive management system. J Dairy Sci 2004,
87:3690-3703.
21. Irgang R, Favero JA, Kennedy BW: Genetic parameters for litter size of
different parities in Duroc, Landrace, and Large White sows. J Anim Sci
1994, 72:2237-2246.
22. Engblom L, Lundeheim N, Schneider Md, Dalin AM, Andersson K:
Genetics of crossbred sow longevity. Animal 2009, 3:783-790.
Received: 20 October 2009 Accepted: 13 May 2010
Published: 13 May 2010
This article is available from: 2010 Mészáros et al; licensee BioMed Central Ltd. This is an Open Access article distributed under the terms of the Creative Commons Attribution License ( by/2.0), which permits unrestricted use, distribution, and reproduction in any medium, provided the original work is properly cited.Genetics Selection Evolution 2010, 42:13
Mészáros et al. Genetics Selection Evolution 2010, 42:13
/>Page 13 of 13
23. Serenius T, Stalder KJ: Genetics of length of productive life and lifetime
prolificacy in the Finnish Landrace and Large White pig populations. J
Anim Sci 2004, 82:3111-3117.
24. Ducrocq V: Current status and prospects of survival analysis in animal
breeding. Proceedings of the 8th World Congress on Genetics Applied to
Livestock Production: August 13-18 2006; Belo Horizonte 2006.
25. Damgaard LH, Korsgaard IR, Simonsen J, Dalsgaard O, Andersen AH:
Genetic versus non-genetic Weibull log-normal sire frailty models: A
simulation study. Interbull Bull 2003, 30:35-42.
26. Hanenberg EHAT, Knol EF, Merks JWM: Estimates of genetic parameters
for reproduction traits at different parities in Dutch Landrace pigs.
Livest Prod Sci 2001, 69:179-186.
27. Rydhmer L, Lundeheim N, Canario L: Genetic correlations between
gestation length, piglet survival and early growth. Livest Sci 2008,
115:287-293.
doi: 10.1186/1297-9686-42-13
Cite this article as: Mészáros et al., Heritability of longevity in Large White
and Landrace sows using continuous time and grouped data models Genet-
ics Selection Evolution 2010, 42:13