Báo cáo sinh học: "A microsatellite-based analysis for the detection of selection on BTA1 and BTA20 in northern Eurasian cattle (Bos taurus) populations" doc
Bạn đang xem bản rút gọn của tài liệu. Xem và tải ngay bản đầy đủ của tài liệu tại đây (702.38 KB, 14 trang )
RESEARC H Open Access
A microsatellite-based analysis for the detection
of selection on BTA1 and BTA20 in northern
Eurasian cattle (Bos taurus) populations
Meng-Hua Li, Terhi Iso-Touru, Hannele Laurén, Juha Kantanen
*
Abstract
Background: Microsatellites surrounding functionally important candidate genes or quantitative trait loci have
received attention as proxy measures of polymorphism level at the candidate loci themselves. In cattle, selection
for economically important traits is a long-term strategy and it has been reported that microsatellites are linked to
these important loci.
Methods: We have investigated the variation of seven microsatellites on BTA1 (Bos taurus autosome 1) and 16 on
BTA20, using bovine populations of typical production types and horn status in northern Eurasia. Genetic variability
of these loci and linkage disequilibrium among these loci were compared with those of 28 microsatellites on other
bovine chromosomes. Four different tests were applied to detect molecular signatures of selection.
Results: No marked difference in locus variability was found between microsatellites on BTA1, BTA20 and the other
chromosomes in terms of different diversity indices. Average D′ values of pairwise syntenic markers (0.32 and 0.28
across BTA 1 and BTA20 respectively) were significantly (P < 0.05) higher than for non-syntenic markers (0.15). The
Ewens-Watterson test, the Beaumont and Nichol’s modified frequentist test and the Bayesian F
ST
-test indicated
elevated or decreased genetic differentiation, at SOD1 and AGLA17 markers respectively, deviating significantly (P <
0.05) from neutral expectations. Furthermore, lnRV, lnRH and lnRθ’ statistics were used for the pairwise population
comparison tests and were significantly less variable in one population relative to the other, providing additional
evidence of selection signatures for two of the 51 loci. Moreover, the three Finnish native populations showed
evidence of subpopulation divergen ce at SOD1 and AGLA17. Our data also indicate significant intergenic linkage
disequilibrium around the candidate loci and suggest that hitchhiking selection has played a role in shaping the
pattern of observed linkage disequilibrium.
Conclusion: Hitchhiking due to tight linkage with alleles at candidate genes, e.g. the POLL gene, is a possible
explanation for this pattern. The potential impact of selective breeding by man on cattle populations is discussed
in the context of selection effects. Our results also suggest that a practical approach to detect loci under selection
is to simultaneously apply multiple neutrality tests based on different assumptions and estimations.
Background
Expectation of neutrality regarding the mutation-drift
equilibrium for microsatellite vari ation is not always
valid due to d emographic changes, including genetic
bottlenecks and admixture (e.g. [1,2]), and selection at
linked sites (e.g. [3,4]). In contrast to demographic pro-
cesses, which affect the entire genome, selection
operates at specific sites associated with phenotypic
traits, such as important quantitative trait loci (QTLs)
and candidate genes. Selection leaves its signature in the
chromosomal regions surrounding the sites, where sig-
nificantly reduced or elevated levels of genetic variation
can be maintained at linked neutral loci. Thus, selection
not only affects the selected sites but also linked neutral
loci and the footprints of selection acting on specific
functional loci can be detected by genotyping poly-
morphic microsatellites in the adjacent non-coding
regions [5].
* Correspondence:
Biotechnology and Food Research, MTT Agrifood Research Finland, FI-31600
Jokioinen, Finland
Li et al. Genetics Selection Evolution 2010, 42:32
/>Genetics
Selection
Evolution
© 2010 Li et al; licensee BioMed Central Ltd. This is an Open Access article distributed under the terms of the Creative Commons
Attribution License ( which permi ts unres tricted use, distribution, and re production in
any medium, pro vided the original work is prop erly cited.
Different statistical methods have been developed to
identify outlier loci under the influence of selection
[6-13] and adaptations have been attempted to improve
the original methods of Lewontin and Krakauer [14],
which have been criticized because of their sensitivity to
population structure and history (e.g. [15]). Nevertheless,
recent studies have shown somewhat inconsistent results
obtained by applying the above statistical tests to the
same data (e.g. [7,12,16,17]). The Lewontin- Krakauer
test [14] is the oldest of these multilocus-comparison
methods. Broadly speaking , these methods are der ived
by using one of the two general approaches detailed
below. The first approach is to develop methods with
Lewontin and Krakauers’ original idea and to use the
distribut ion of estimates of genetic differentiation coeffi-
cient F
ST
and diversity parameters from individual
genetic loci to detect the effects of selection, hereafter
termed the F
ST
-based approach, such as the FDIST pro-
gram-based method [9] , Bayesian regression [12], and
population-specific [7] methods. Schlötterer and collea-
gues have proposed alternative multilocus simulation-
based tests that use summary statistics other than F
ST
,
such as the ln RV [10], the ln RH [6], and the ln Rθ’
[13] tests. These tests involve considering the idea of a
‘selective sweep’ that arises from natural and artificial
selection, and recent genetic exchanges driven by the
selective sweep leave a record or “genetic signature” in
the genome covering the selected sites and their linked
neutral loci. Given that microsatellite loci associated
with a recent selective sweep differ from the remainder
of the genome, they are expected to fall outside the dis-
tribution of neutral estimates of ln RV, ln RH or ln Rθ’
values. As reviewed by [18-20], all the methods have
potential advantages and drawbacks, which can be due
to different underlying assumptions regarding the demo-
graphic and mutational models on which they are based,
as well as on uncertainty associated with the robustness
of the approaches.
The recent increased availability of large genomic data
sets and the identification of a few genes or loci as the
targets of domesti cation or subsequent genetic improve-
ment in cattle have renewed the investigation of the
genomic effects of selection. Candidate genes and QTL
have been described on both BTA1 [21-25] and BTA 20
[26]. On BTA1, the POLL gene, characterized by two
alleles: P (polled) dominant over H (horn), is responsible
for the polled (i.e. hornless) and horn phenotypes in cat-
tle and has been subjected to both natural and artificial
selection. Georges et al. [21] have demonstrated genetic
linkage between the POLL gene and two microsatellites,
GMPOLL-1 and GMPOLL-2. These loci are syntenic to
the highly conserved gene for superoxide dismutase 1
( SOD1). In addition, in various breeds the POLL gene
has been found to be linked to the microsatellites
TGLA49, AGLA17, INRA212 and KAP8, located in the
centromeric region of BTA1 close to the SOD1 locus
[22,23,25]. To date, on BTA20 several QTL and candi-
date genes have been reported e.g. gro wth hormone an d
prolactin receptor genes [27] affecting conformation and
milk production traits, such as body depth (e.g. [28]),
udder (e.g. [29]), udder attachment (e.g. [30]), milk yield
(e.g. [31]), fat percentage (e.g. [28]), and especially pro-
tein content (e.g. [28-30]).
In this study on Bos taurus, w e present microsatellite
data using a relatively larger number of loci than pre-
viously reported, which mainly included the 30 microsa-
tellite markers recommended by the International
Society for Animal Genetics (ISAG)/Food and Agricul-
ture Organization of the United Nations (FAO) working
group (e.g. [2,24]; but see also [32]). Among the 51
microsatellites genotyped on 10 representative cattle
populations of different origins (native and modern
commercial) and horn statuses (polled and horned) in
the northern territory of the Eurasian subcontinent,
seven were on BTA1 and 16 on BTA20. We applied
four tests to detect molecular signatures of selection,
ranging from tests for loci across populations and the
recently proposed pairwise population t ests using a
dynamically adjusted number of linked microsatellites
[13]. We compared the consistency of the different neu-
trality tests available to identify loci under selection in
the north Eurasian cattle populations investigated here.
Materials and methods
Population samples and genetic markers
Microsatellite data from 10 different cattle (Bos taurus )
populations including 366 individuals were an alyzed.
Finnish populations were represented by Finnish
Ayrshire (modern commercial, horned, n =40),Finnish
Holstein-Friesian (modern commercial, horned, n =40),
Eastern Finncattle (native, mostly polled, n =31),
Western Finncattle (native, mostly polled, n =37),and
Northern Finncattle (native, mostly po lled, n = 26). We
were able to inference the heterozygotic status at the
POLL locus in 19 phenotypically polled cattle of the
three Finnish native populations, on the basis of their
offspring/parent phenotypes . In addition, there were 19
animals horned (recessive homozygotic) in the Finnish
native populations. Istoben (native, horned, n = 40),
Yakutian (native, horned, n = 51), and Kholmogory
(native, horned, n = 32) cattle were sampled in Russia.
Ukrainian Grey (native, horned, n =30)andDanish
Jersey (modern commercial, horned, n = 39) were
sampled in Ukraine and Denmark, respectively. During
sample collection, the pedigree information and the
herdsman’s knowledge were used to ensure the animals
were unrelated. Additional information on these popula-
tions has been reported in previous publications [2,33].
Li et al. Genetics Selection Evolution 2010, 42:32
/>Page 2 of 14
Genotypes of the 51 microsatellites were used (for
details on the microsatellites, see [33-35]) among which
data of the 30 markers from the panel of loci recom-
mended for genetic diversity studies in cattle http://
www.projects.roslin.ac.uk/cdiv/markers.html were taken
from the literature [2]. The 23 microsatellites (21 new
ones and two from the recommended panel) on BTA1
and BTA20 were chosen on the basis of their vicinity to
genes and QTL, which could be considered as candidate
loci for selection because of their assumed involvement
in the polled/horned phenotype [22] and in milk yield
and body composition [35]. Details of the primers and
microsatellite analysis protocols can be found in CaD-
Base l in.ac.uk/cdiv/markers.html
and[34].Inthisstudy,GHRJA.UP,5′ -
GGTTCGTTATGGAGGCAATG-3′ ,andGHRJA.DN,
5′ -GTCACCGCTGGCAGTAGAT-3′ primers were
designed based on the sequence of the promoter region
of the growth hormone receptor gene [35] containing
microsatellite GHRJA. Danish Jersey a nimals were ana-
lyzed only at 41 loci (see Table 1). A full l ist of the loci
studied and their chro mosomal and genomic locations,
as wel l as population and basic statistics, are available in
Table 1.
Microsatellite variability measures and test for linkage
disequilibrium
Microsatellite variability, expected heterozygosity (H
EXP
),
allelic richness (A
R
), and Weir and Cockerham’ s F
ST
[36], were e stimated with the FSTAT pro gram, version
2.9.3.2 [37].
The D′ metric used to estimate the LD was calculated
using Multiallelic Interallelic Disequilibrium Analysis
Software (MIDAS; [38]). Values of D′ were calculated
for all syntenic marker pairs on BTA1 and BTA20
across the populations. A more detailed description of
the estimation of D′ can be found in [39]. The statistical
significance of the observed association between pairs of
alleles under the null hypothesis of random allelic
assortment was tested using a Monte-Carlo approxima-
tion of Fisher’ s exact test as implemented i n the soft-
ware ARLEQUIN [40] using a Markov chain extension
to Fisher’sexacttestforR × C contingency tables [41].
A total of 100 000 alternative tables were explored with
the M arkov chain and probabilities were typically esti-
mated with a standard error of < 0.001. Estimation of
the D′ metric for LD and tests for their significance
were conducted only in three Finnish native breeds, i.e.
Northern Finncattle, Eastern Finncattle and Western
Finncattle. The graphic summary of the significance of
LD determinations was displayed using the HaploView
program, version 4.0 [42]. Fisher’ s exact tests in the
GENEPOP v 4.0 [43] were applied to assess LD determi-
nations between all locus pairs across the sample.
Tests to detect loci under selection across populations
Possible departures from the standard neutral model of
molecular evolution - p otentially revealing demographic
events or the existence of selective effects at certain
loci - were examined for each locus using the Ewens-
Watterson test [44,45] and the Beaumont and Nich ols’s
modified frequentist method [9], as well as a more
robust Bayesian test [12].
The Ewens-Watterson test of neutrality was per-
formed with the ARLEQUIN program [40] assuming
an infinite allele mutation model. To obtain sufficient
precision with this test, the probability was recorded as
themeanof20independentrepeatsof1,000simula-
tions. The frequentist method used was that proposed
by [9], further developed by [12], and implemented in
the FDIST2 program />software.html, a currently distributed version of the
original FDIST program as described by [12]. FDIST2
calculates θ, Weir & Cockerham’s [36] estimator of
diversity for each locus in the sample. Coalescent
simulations are then performed to generate data sets
with a distribution of θ centered on the empirical esti-
mates. Then, the quantiles of the simulated F
ST
within
which the observed F
ST
’sfellandtheP-values for each
locus were determi ned. Initially an island model of
population differentiation was used and the procedure
repeated 50,000 times to generate 95% confidence
intervals for neutral differentiation and to estimate
P-values for departure of the loci from these expecta-
tions. Simulation parameters were under an infinite
allele mutation model for 100 demes, 10 sample popu-
lations, sample sizes of 100, and a weighted F
ST
similar
to the trimmed mean F
ST
calculated from the empiri-
cal distribution. Computed by removing the 30% high-
est and lowest F
ST
values observed in the empirical
data set, the trimmed mean F
ST
is an estimate of the
average “neutral” F
ST
value uninfluenced by outlier loci
(see [46]). This method provides evidence for selection
by looking for outliers with higher/lower observed
F
ST
-values, controlling for P-values [12]. The
approach is fairly ro bust regarding variation in muta-
tion rate between loci, sample size, and whether popu-
lations are at equilibrium or not [9].
Beaumont & Balding’ s [12] hierarchical-Bayesian
method was performed using the BAYESFST program
/>html package, which generates 2,000 Markov chain
Monte Carlo (MCMC) simulated loci on the basis of
the distribution of F
ST
given the data. The method
combines information over loci and populations in
order to simultaneously estimate F
ST
at the i
th
locus
and the j
th
population, F
ST
(i, j), for all i loci and j
populations. A hierarchical model is implemented for
F
ST
(i, j)as
Li et al. Genetics Selection Evolution 2010, 42:32
/>Page 3 of 14
Table 1 Summary of the microsatellites and basic population genetic estimates for the microsatellites
Locus BTA Genomic position (bp) A
R
H
E
F
IS
FDIST2 test Ewens-Watterson test
starts ends F
ST
PF
OBS
F
EXP
P
H
P
E
AGLA17 1 641402 641615 1.37 0.08 -0.049 0.017 0.010** 0.907 0.754 0.978* 0.976*
DIK4591 1 1704734 1705228 2.60 0.32 0.064 0.128 0.660 0.467 0.442 0.844 0.622
DIK1044 1 2829429 2829737 4.86 0.70 0.015 0.118 0.631 0.324 0.329 0.136 0.243
SOD1 1 2914373 2915349 4.78 0.65 0.083 0.173 0.968* 0.331 0.379 0.037* 0.047*
DIK5019 1 3900549 3900808 5.42 0.59 0.190 0.164 0.954* 0.381 0.380 0.005** 0.008**
BMS2321 1 10949260 10949302 3.58 0.45 0.154 0.094 0.410 0.429 0.486 0.424 0.052
BM1824 1 122531990 122532171 3.95 0.72 -0.083 0.122 0.655 0.450 0.487 0.030* 0.231
TGLA304 20 11460907 11460992 3.30 0.49 0.113 0.114 0.573 0.497 0.531 0.237 0.238
BMS1754 20 18439757 18439877 3.47 0.58 0.014 0.094 0.384 0.503 0.536 0.153 0.126
NRDIKM033 20 15598470 15598176 5.20 0.75 -0.004 0.098 0.372 0.234 0.213 0.415 0.466
ILSTS068 20 21675187 21675451 2.07 0.25 0.095 0.146 0.760 0.734 0.751 0.383 0.223
TGLA126 20 21808628 21808745 6.27 0.71 -0.009 0.079 0.170 0.493 0.443 0.085 0.057
BMS2461 20 25278607 25278662 4.83 0.62 0.028 0.180 0.985* 0.227 0.246 0.453 0.760
BMS1128 20 26364064 26364112 3.54 0.52 0.032 0.109 0.534 0.472 0.446 0.503 0.203
BM713 20 26977228 26977280 3.36 0.62 -0.074 0.162 0.907 0.439 0.486 0.197 0.674
DIK2695 20 30452613 30452786 3.60 0.58 -0.027 0.075 0.186 0.432 0.411 0.565 0.274
TGLA153 20 31240022 31240154 4.64 0.71 0.025 0.109 0.521 0.345 0.353 0.101 0.269
GHRpromS 20 31023202 31023306 3.12 0.43 0.006 0.114 0.581 0.426 0.446 0.726 0.268
BMS2361 20 34597279 34597368 5.10 0.72 0.019 0.125 0.698 0.329 0.351 0.045** 0.017**
DIK4835 20 35915540 35916040 4.96 0.65 0.022 0.136 0.788 0.293 0.329 0.252 0.046
AGLA29 20 3842995 38843142 5.49 0.78 -0.006 0.087 0.202 0.363 0.412 0.000** 0.000**
BMS117 20 40015465 40015564 3.88 0.67 -0.018 0.078 0.197 0.377 0.376 0.398 0.272
UMBTL78 20 40177064 40177157 4.22 0.58 -0.033 0.102 0.462 0.298 0.256 0.884 0.229
BM2113 2 88476 88616 5.44 0.79 -0.052 0.119 0.673 0.353 0.379 0.003** 0.005**
INRA023 3 35576043 35576259 4.85 0.70 0.009 0.113 0.564 0.309 0.306 0.238 0.107
ETH10 5 55333999 55334220 4.57 0.67 0.002 0.134 0.789 0.432 0.446 0.049* 0.031*
ETH152 5 NA NA 4.56 0.71 0.012 0.081 0.171 0.425 0.486 0.008** 0.020
ILSTS006 7 86555402 86555693 5.14 0.77 -0.007 0.076 0.110 0.331 0.351 0.032* 0.057
HEL9 8 NA NA 5.04 0.70 0.020 0.134 0.792 0.262 0.289 0.240 0.245
ETH225 9 8089454 8089601 5.02 0.71 0.013 0.113 0.560 0.410 0.478 0.009** 0.009**
MM12 9 NA NA 7.76 0.67 0.017 0.123 0.671 0.312 0.347 0.244 0.112
ILSTS005 10 93304132 93304315 2.17 0.43 -0.026 0.083 0.356 0.686 0.664 0.358 0.390
CSRM60 10 70549981 70550081 7.03 0.72 0.011 0.073 0.094 0.405 0.418 0.046* 0.038*
HEL13 11 NA NA 3.14 0.51 0.081 0.125 0.678 0.402 0.407 0.529 0.564
INRA032 11 49569411 49569592 3.81 0.62 -0.010 0.142 0.812 0.511 0.537 0.063 0.016
INRA037 11 70730695 70730819 4.54 0.58 0.030 0.129 0.717 0.266 0.243 0.830 0.462
INRA005 12 71751518 71751656 3.18 0.56 0.032 0.088 0.321 0.594 0.596 0.114 0.096
CSSM66 14 6128576 6128773 5.91 0.74 0.002 0.137 0.873 0.312 0.352 0.000** 0.003**
HEL1 15 NA NA 3.99 0.67 0.020 0.072 0.138 0.468 0.445 0.119 0.155
SPS115 15 NA NA 5.40 0.58 0.039 0.096 0.416 0.478 0.482 0.228 0.146
INRA035 16 62926476 62926577 2.72 0.23 0.391 0.072 0.266 0.521 0.488 0.746 0.421
TGLA53 16 22214785 22214925 12.25 0.74 0.071 0.099 0.354 0.195 0.213 0.063 0.037
ETH185 17 36598852 36599086 8.31 0.68 0.039 0.146 0.877 0.336 0.303 0.186 0.196
INRA063 18 37562469 37562645 3.31 0.57 0.031 0.110 0.546 0.537 0.487 0.270 0.135
TGLA227 18 60360145 60360234 10.71 0.82 0.005 0.076 0.075 0.282 0.315 0.005** 0.012*
ETH3 19 NA NA 4.44 0.65 0.009 0.135 0.787 0.407 0.406 0.073 0.139
HEL5 21 11850292 11850455 4.64 0.66 0.038 0.151 0.903 0.424 0.410 0.023* 0.104
TGLA122 21 50825795 50825936 11.36 0.74 0.007 0.069 0.065 0.210 0.213 0.538 0.152
Li et al. Genetics Selection Evolution 2010, 42:32
/>Page 4 of 14
Fij
iii
iii
ST
(, )
exp( )
exp( )
=
++
+++
1
where a
i
, b
j
and g
ij
are locus, population and locus-by-
population parameters, respectively [12]. In this study,
the interpretations of the potential outliers ar e based on
the locus effect (a
i
). Outliers from our data set were
identified on the basis of the distribution following [12].
Rather than a fixed F
ST
as assumed in the above fre-
quentist method of [9], this BAYESFST test uses more
information from the raw data and does not assume the
same F
ST
for each population [5,12].
Tests to detect loci under selection for pairwise
populations
To test for additional evidence of selection, we used the
combination of statistics lnRH, lnRV and lnRθ’ in the
population pairwise comparisons. The principle behind
these tests is that variability at a neutral microsatellite
locusisgivenbyθ =4N
e
μ,whereN
e
is the effective
population size and μ is the mutation rate. A locus
linked to a beneficial mutation will have a smaller effec-
tive population size and consequently a reduction in
variability below neutral expectations. The relative var-
iance in variability, lnRθ, can be assessed instead by esti-
mating the relative variance in repeat number, lnRV, or
heterozygosity, lnRH, for loci between populations. The
lnRV was calculated using the equation lnRV = ln
(V
pop1
/V
pop2
)whereV
pop1
and V
pop2
are the variance in
repeat number for population 1 and populat ion 2,
respe ctively [10]. T he lnRH test is based on the calcula-
tion of the logarithm of the ratio of H for each locus for
a pair of populations as follows
ln lnRH
pop1
pop2
=
−
⎛
⎝
⎜
⎜
⎞
⎠
⎟
⎟
−
−
⎛
⎝
⎜
⎜
⎞
⎠
⎟
⎟
−
1
1
1
1
1
1
2
2
H
H
where H denotes expected heterozygosity (see equa-
tion 2 in [6]). In addition, we attempted to calculate ln
Rθ by estimating θ directly using a coalescence-based
Bayesian Markov chain Monte Carlo simulation
approach employing the MSVAR program [47].
The tests have been shown to be relatively insensitive
to mutation rate, deviation from the stepwise mutation
model, demographic history of population and sample
size [16]. As suggested by [48], to detect the most recent
and strong sel ective sweeps, the combination of lnRH
andlnRVstatisticsisaspowerfulaslnRValone,but
using both statistics together lowers t he rate of false
positives by a factor of 3 because the variance in repeat
number and the heterozygosity of a population measure
different aspects of the variation at a locus. Thus, com-
binations of any two of the three t ests were implem en-
ted here and significance of lnRH, lnRV and lnRθ’ for
each comparison was calculated according to standard
methods [6,10,48]. These statistics are generally nor-
mally distributed, and simulations have confirmed that
outliers (e.g. more than 1.96/2.58 standard deviations
from the mean for 95%/99% confidence intervals,
respectively) are l ikely to be caused by selection [48].
The tests were implemented for every pairwise compari-
son involving native populations from different trait
categories ( Eastern Finncattle, Western Finncattle and
Northern Finncattle vs. Yakutian, Istoben, Kholmogory
and Ukrianian Grey), i.e. 12 population pairs for the
horn (polled/horned) trait.
Tests to detect loci under selection within a population
The coalescence simulation approach using the DetSel
1.0 program [49] was used to detect outlier loci within
the Finnish native po pulations (Eastern Finncattle,
Western Finncattle and Northern Finncattle). It has the
advantage of being able to take into account a wide
range of potential parameters simultaneously and giving
results that are robust regarding the starting assump-
tions. For each pair of populations (i, j), and for all loci,
we calculated F
i
and F
j
(F
i
and F
j
are the population-
specific divergence; for detail s see [7,49]) and generated
the expected joint distribution of F
i
and F
j
by perform-
ing 10,000 coalescent simulations. Thus, every locus fall-
ing outside the resulting confidence envelope can be
seen as potentially under selec tion. The following nui-
sance parameters were used to generate null distribu-
tions with similar numbers of allelic stages as in the
Table 1 Summary of the microsatellites and basic population genetic estimates for the microsatellites (Continued)
HAUT24 22 45733839 45733962 7.09 0.70 0.025 0.143 0.861 0.406 0.424 0.004** 0.027*
BM1818 23 35634770 35635033 4.03 0.63 0.019 0.102 0.458 0.538 0.486 0.144 0.013*
HAUT27 26 26396836 26396987 8.85 0.61 0.126 0.103 0.453 0.376 0.396 0.083 0.003**
BTA, Bos taurus autosome; A
R
, allelic richness; H
E
, expected heterozygosity, F
IS
, inbreeding coefficient, observed homozygosity, F
OBS
, and expected homozygosity,
F
EXP
, NA, not available; the probabilities for the Ewens-Watterson test were calculated based on homozygosity (P
H
) or Fishers’s exact test (P
E
); *, the significance
level of P < 0.05, **, the significance level of P < 0.01; the genomic positions for the loci are BLASTed against STS or primer sequence in ENSEMBL cow genome
Btau4.0 updated until 11/02/2010
Li et al. Genetics Selection Evolution 2010, 42:32
/>Page 5 of 14
observed data set: mutation rates (infinite allele model)
μ =1×10
-2
,1×10
-3
, and 1 × 10
-4
; ancestor population
size N
e
= 500, 5,000, and 50,000; times since an assumed
bottleneck event T
0
= 50, 500, and 5,000 generations;
time since divergence t = 50 and 500; and population
size before the split N
0
= 50 and 500. In order to detect
outlier loci potentially selected for the polled trait within
the three Finnish native cattle populations, the DetSel
program was run for comparison between the two sub-
populations representing the definitely polled (n =19)
and horned (n = 19) animals, respectively.
Results
Genetic diversity and differentiation
A complete list of loci and their variability in the 10 cat-
tlepopulationsareshowninTable1.Theoverall
genetic differentiation across loci was 0.117 (F
ST
=
0.117, 95% CI 0.108 - 0.125). F
ST
values for an indivi-
dual locus varied from 0.017 (SD = 0.011) at AGLA17
on BTA1 to 0.180 (SD = 0.057) at BMS2461 on BTA20.
Mean population differentiations for loci on BTA1 and
BTA20 were 0.126 (F
ST
= 0 .126, 95% CI 0.103 - 0.143)
and 0.118 (F
ST
= 0.118, 95% CI 0.100 - 0.13 9), respec-
tively. Neither of the values indicated significant differ-
ence from the average for loci o n other chromosomes
(F
ST
= 0.114, 95% CI 0.104 - 0.124).
Levels of variation across populations, including al lelic
richness (A
R
) and expected heterozygosity (H
E
), were in
similar ranges as for microsatellites on BTA1, BTA20
and other autosomes, with the smallest variations
observed at AGLA17 (A
R
= 1.37, H
E
= 0.08). The highest
H
E
of 0.79 was o bserved at BM2113 (BTA2) and the
highest A
R
of 11.36 at TGLA122 (BTA21). Most F
IS
values were positive and for some loci significantly pos i-
tive. Of the 13 negative F
IS
values, seven occurred for
loci o n BTA20, and two for loci on BTA 1. Loci on
BTA1 and BTA20 did not show a significant reduction
or increase in mean F
IS
compared with the loci on other
autosomes (other bovine autosomes, mean F
IS
= 0.038;
BTA1, mea n F
IS
= 0.053, Mann-Whitney test U = 118,
P = 0.409; BTA20, mean F
IS
= 0.011, Mann-Whitney
test U = 273.5 , P = 0.227). Given the ra nge of observa-
tions of F
IS
at an individual locus, there were no marked
difference among the three classes of loci (BTA1, -0.083
- 0.190; BTA20, -0.074 - 0.113; other BTAs, -0.052 -
0.391).
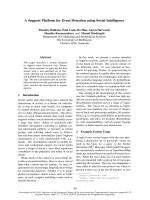
Linkage disequilibrium
The strength of pairwise linkage disequilibrium (LD)
between markers was estimated and the average D′
value of pairwise syntenic markers was 0.32 across
BTA1 and 0.28 across BTA20, both of which are signifi-
cantly (P < 0.05) higher than for non-syntenic markers
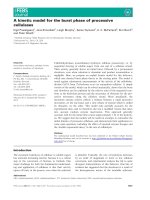
(0.15; only th e D′ > 0.3 are shown in Figure 1). Figure 1
also shows matrices of LD significance levels for all pos-
sible locus combinations of the loci on BTA1 or BTA20
in their chromosomal order. Of the 120 pairwise com-
parisons of the 16 loci on BTA20, a total of 22 (22/120,
18.3%) tests showed P values below 0.05. Likewise, LD
between markers on BTA1 provided sev en (7/21, 33 .3%)
significant observations. However, a substantially smaller
proportion (34/1124, 3.0%) of significant (P < 0.05) pairs
was found between non-syntenic markers. In general,
significantly higher levels of LD were observed for synte-
nic markers on BTA1 and BTA20 than that for non-
syntenic markers. There was no evidence of LD blocks
on either of the chromosomes.
Evidence for selection across the populations
The Ewens-Watterson test enables detec tion of devia-
tions from a neutral-equilibrium model as either a defi-
cit or an excess of g enetic diversity relative to the
number of alleles at a locus (see [50]). When applying
the tests for all the microsatellites, we detected
13 loci (AGLA17, DIK5019, SOD1, AGLA29, BMS2361,
BM2113, ETH10, ETH225, CSSM66, ETH152, TGLA227,
HAUT24,andCSRM60) on 10 different chromosomes
exhibiting significant probabilities for the Ewens-Watter-
son test based on both homozygosity (P
H
)andFisher’s
exact test (P
E
) (see Table 1). Of the 13 loci, one
(AGLA17) exhibited a significant (P < 0.05) deficit of
heterozygosity and all the other 12 loci exhibited a sig-
nificant (P < 0.05) excess in genetic diversity relative to
the expected values; these patterns are consistent with
directional and balancing selection, r espe ctively. The 12
loci generated average P values significantly (Student’s t
test:
P
H
=0.020,t = -5.65, P < 0.0001;
P
E
=0.014,t =
-5.69, P < 0.0001) below than the expected median
value of 0.5. However, average P values of 0.313 for P
H
(t = -4.63, P > 0.1) and 0.232 for P
E
(t = -8.69, P >0.1)
were observed in the remaining 38 loci which were not
under selection. The observation provided further evi-
dence that selection affected genetic diversity at the
microsatellites under selection.
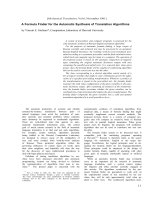
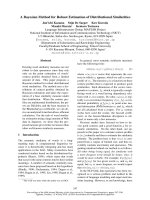
The results of the analyses with the FDIST2 program
are presented in Table 1 and Figure 2a. This summary-
statistic method, based on simulated and observed F
ST
values, identified four loci (SOD1, BMS2461, DIK5019
and AGLA17) as outliers showing footprints of selection
in the analyses, including all 10 populations, at the 5%
significance level. Of the four significant loci, three
(SOD1, BMS2461 and DIK4519) w ith higher F
ST
values
indicated a sign of directional selection and one locus
(AGLA17) appearing in the lo wer tail of the F
ST
distri-
bution sugges ted a signature potentially affected by bal-
ancing selection (Figure 2a). In the Bayesian F
ST
-test
(Figure 2b), which was based on a hierarchical regres-
sion model, three loci (HEL5, DIK4591and SOD1)were
Li et al. Genetics Selection Evolution 2010, 42:32
/>Page 6 of 14
detected as being directionally selected and two
(AG LA17 and TGLA227) as under balancing selection.
Overall, across all the populations, two loci, AGLA17
and SOD1, exhibited the strongest evidence of selection
with all three statistical approaches, which provided
good support to their status as outliers due to select ion.
Two loci (DIK5019 and TGLA227) exhibited significant
departure from the neutral expectations in two out of
the three selection tests. Furthermore, 12 loci (AGLA29,
BMS2361, BM2113 , ETH10, ETH225, CSSM66, ETH152,
Figure 1 Detailed view of the extent and significance of LD in the cattle populations using the Haploview 4.0 program. Numbers in the
blocks indicate the percentage of the LD metric D’ values > 0.3; shadings indicate Fisher’s exact test significance levels: white, P > 0.05; light
shading, P < 0.05.
Li et al. Genetics Selection Evolution 2010, 42:32
/>Page 7 of 14
HAUT24, CSRM60, BMS2461, HEL5 and DIK4591) can
be regarded as candidates affected by selection, but were
revealed only in one of the three tests. Interestingly,
according to ENSEMBL cow genome http://www.
ensembl.org/Bos_taurus/ Info/Index the significant locus
AGLA17 under balancing selection was about 1.78 cM
upstream from the candidate locus for POLL, whereas
locus SOD1 under dire cting selection was located about
3.87 cM downstream from the candidate locus. It should
be noted that the F
ST
-based tests of selection are prone
to false positives because of sensitivity to demographic
history [51], heterozygosity among loci in mutation rate
[52] and locus-specific phenomena not related to selec-
tion [48]. Nevertheless, we expect the set of loci identi-
fied by F
ST
-based tests to be enriched for the true
positives in further tests.
Tests for selection for pairwise populations
Since each of the five tests used above relies on some-
what different assumptions, loci that are repeatedly
found to be outside the range expected for neutrality
are extremely good candidates for markers under selec-
tion. Moreover, LD is known to be extremely high for
the six BTA1 microsatellites near the candidate gene
affecting the presence or absence of horns in Bos taurus,
thus the region under selection is likely to be quite
wide. Despite the possible presence of a few false posi-
tives, the full set of seven loci (SOD1, BMS2461,
DIK5019, HEL5, DIK4591, TGLA227 and AGLA17)was
used for further analyses. The lnRθ methods (lnRH,
lnRV and lnRθ’ ) use heterozygosity or variance differ-
ence, rather than population divergence, to test for
selection. Significant results for the lnRθ tests for selec-
tive sweeps involve the two loci (AGLA17 and SOD1)
detected by the Ewens-Watterson test and the F
ST
-based
tests for pairwise combinations ( n = 12) of three native
Finnish cattle populations and four old native popula-
tions from Russia and Ukraine (Table 2).
Significant results for selective sweeps at loci AGLA17
and SOD1 were obtained for 12 pairwise population
Figure 2 Results of (A) the FDIST2 and (B) BAYESFST tests. The solid lines indicate the critical cutoff for the P-value at the 0.05 level.
Li et al. Genetics Selection Evolution 2010, 42:32
/>Page 8 of 14
comparisons for each of the three different measures of
lnRθ (Table 2). Of the pairwise comparisons, a total of
28 and 26 significant (P < 0.05) or very significant (P <
0.01) results were observed at AGLA17 and SOD1,
respectively, in the three tests. Both loci (AGLA17 and
SOD1) appeared in all three different measures of lnRθ
for eight or more comparisons (Table 2), that is, lnRθ
(lnRH, lnRV and lnRθ’ ) values deviating by more than
1.96 standard deviations from the mean. Accordingly,
the pairwise comparisons between either of Eastern
Finncattle and Western Finncattle and populations of
Yakutian, Kholmogory and Ukrainian Grey were signifi-
cant for all three estimators. All the comparisons
between populations yielded at least two significant
results for the three estimators. In total, 54 (75% 54/72)
significant comparisons involved AGLA17 or SOD1 in
the comparisons between Finnish native populations
(Northern Finncattle, Eastern Finncattle and Western
Finncattle) vs. the native populations from Russia and
Ukraine (Istoben, Ukrainian Grey, Kholmogory and
Yakutian Cattle), which sugge sted that selective sweeps
had taken place in the Finnish native populations.
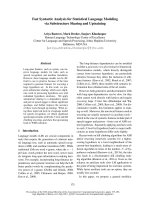
Tests for selection within the Finnish native populations
The coalescent simulation, which was based on a popula-
tion split model [49], was performed with the DetSel pro-
gram within the Finnish native populations with very
similar demographical backgrounds (Eastern Finncattle,
Northern Finncattle and Western Finncattle). Among the
six BTA1 microsatellites around the candidate loci, all
are polymorphic in the three populations involved in the
pairwise-subpopulation comparison. In the pairwise com-
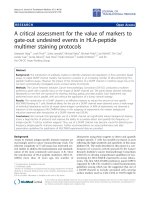
parison between definitely polled (n = 19) and horned
(n = 19) cattle, loci AGLA17 and SOD1 were significantly
outside the 99% confidence interval (Figure 3), while
locus DIK4591 fell slightly outside the 95% confidence
envelope in the three comparisons, which are thus con-
sidered as false positives, i.e., the locus was detected as an
outlier because of the 5% type I error. The outlier beha-
vior for loci AGLA17 and SOD1 was deemed to be the
result of strong local effects of hitchhiking selection.
Discussion
In this study, besides 28 microsatellites on other cattle
autosomes used as a reference set of markers, seven
microsatellites on BTA1 and 16 on BTA20 around candi-
date loci were screened for the footprints of selection
among 10 cattle populati ons with divergent horn or pro-
duction traits. Across diffe rent statistical analyses, a
highly divergent pattern of genetic differentiation and
large differences in lev els of variability were revealed at
the loci SOD1 and AGLA17 among populations, which
was inconsistent with neutral expectations. The results
indicated divergent ‘ selective sweeps’ at AGLA17 and
SOD1, probably caused by selection of the closely-linked
candidate loci for the horned/polled trait, e.g. the POLL
gene.
Evidence of selection of microsatellites surrounding the
POLL gene
Because revealing outlier loci in genome scans currently
depends on statistical tests, one of the main concer ns is
to highlight truly significant loci while minimizing the
detection of false positives [44]. Using a multilocus scan
of differentiation based on microsatellite data, we com-
pared three different methods that aimed at detecting
outliers from simulated neutral expectations: 1) the
Ewens-Watterson method [44,45], 2) the FDIST2
method [9], and 3) a BAYESFST method [12]. Outliers
were identified for 15 loci using a 5% threshold, which
was robust across methods for two loci (SOD1 and
AGLA17). The locus SOD1 presented a higher
Table 2 Estimates of lnRV, lnRH and lnRθ’ for the pairwise comparisons
Pairwise comparison lnRV lnRH lnRθ’
AGLA17 SOD1 AGLA17 SOD1 AGLA17 SOD1
Eastern Finncattle - Istoben * * n.s. n.s. * n.s.
Eastern Finncattle - Yakutian * ** * ** ** *
Eastern Finncattle - Ukrainian Grey ** ** * * ** *
Eastern Finncattle - Kholmogory * ** * * * *
Western Finncattle - Istoben ** * ** ** * *
Western Finncattle - Yakutian ** ** * * * **
Western Finncattle - Ukrainian Grey * * ** * * *
Western Finncattle - Kholmogory * * * * * **
Northern Finncattle - Istoben * n.s * n.s. n.s. *
Northern Finncattle - Yakutian * n.s. n.s. * n.s. n.s.
Northern Finncattle - Ukrainian Grey ** * n.s. n.s. n.s. n.s.
Northern Finncattle - Kholmogory * n.s. n.s. * n.s. n.s.
* Significance P < 0.05, ** P < 0.01, n.s., not significant
Li et al. Genetics Selection Evolution 2010, 42:32
/>Page 9 of 14
differentiation (F
ST
value) than expected, suggesting that
it could have been affected by the action of diversifying
selection among homogeneous gene pools and popula-
tions. I n contrast, the locus AGLA17 presented a lower
genetic differentiation than expected, which could repre-
sent signatures of homogenizing selection among popu-
lations and/or balancing selection within populations.
All three methods identified loci SOD1 and AGLA17 as
good candidates for selection on the polled trait. How-
ever, several significant loci were detected only by one
or two of the tests and thus could not be accept ed as
reliable outliers with the remaining tests. The results
obtained by the three methods are not totally consistent,
probably because of the difference in statistical power
using multiple measures of variability, each of which
measures different parameters and relies on different
assumptions, e.g. heterozygosity and variance in allele
size [48], as detailed in e.g. [53-55].
Besides the global analyses, detection of outlier loci
was also done using pairwise analyses. This helped to
reveal loci with a major overall effect as well as loci
responding with different strengths to artificial selection
on the individual populations. Among the population
chosen for the pairwise analyses, the lnRθ (lnRV, lnRH
and lnRθ’ ) tests yielded a high number of significant
(P < 0.05) results at SOD1 and AGLG17 according to
the three estimators of lnRθ (Table 2). This finding con-
forms well to the previous results of selective sweeps
associated with hitchhiking selection with one or more
genes with locally beneficial mutations. Although there
is dif ference in the statistical power to detect selection,
as discussed in [6,48,56], t he three estimators of lnRθ
provide additional robust evaluation of potential selec-
tive sweeps for the pairwise population comparisons.
Neutrality tests for microsatellites focus mainly on
unlinked l oci and are based on either population differ-
entiation (F
ST
) or reduced variability (lnRθ). Our pro-
posed tests consider lnRθ of several linked loci for the
inference of selec tion. While the single-locus l nRθ-test
is largely independent of the demographical past, the
additional power of linked loci is balanced by the cost
of an increasing dependence of the demographic past
due to the fact that LD is extremely sensitive to the
demographic history. Thus, pairwise analyses between
sub-populations may decrease the demographic effects
in accounting for the selection. As indicated in Figure 3,
the great majority of loci always fall in the confidence
region of the conditional pairwise-subpopulation
Figure 3 Pairwise compa rison of Finnish native cattle populations performed with DetSel. The test was at the 95% confidence envelope:
plot of F
2
against F
1
estimates for the subpopulation pair polled vs. horned.
Li et al. Genetics Selection Evolution 2010, 42:32
/>Page 10 of 14
distributions of branch length estimates, while some loci
do not. Overall, we identified two loci (SOD1 and
AGLA17) that were probably subject to selection in the
three Finnish native populations. Thus, we concluded
that the distribution of variability at these loci could
have been shaped by forces other than demographic
effects e.g. genetic drift. Although the locus DIK4591
was located on the edge or fell just outside the high
probability r egion of the expected conditional distribu-
tion in the Finnish native populations, we must be cau-
tious about the locus because the estimation of F
i
parameters is discontinuous as a result of the discrete
nature of the data, i.e. the allele counts (e.g. [7]). How-
ever, it is worth noting that not a ll significant loci
detected by other methods could be accepted as trust-
worthy outliers with DetSel due to technical constraints,
which means that if a locus is monomorphic in one
population of the pair analyses with DetSel are not
possible.
Tests to detect outlier loci that deviate from neutral
expectation cannot identify false positives (type I errors).
Thus, w e conducted the three different neutrality tests
(the Ewens-Watterson test, the FDIST test and the
BAYESFST test), setting a 95% P level criterion to iden-
tify loci under selection pressure, at which the expected
number of false positive loci is 51 × 0.05 = 2.55. We
still found 13, four and five outlier loci, respectively,
indicating that at least some of the outlier loci are unli-
kely to be false positives. As suggested by [5], a practical
approach to strengthen the candidate status of identified
outlier loci is to apply two or more neutrality tests
simultaneously based on different assumptions and para-
meter estimation and only consider outlier loci that are
supported by several methods for subsequent validation
steps. Thus, the fact that some loci are identified by one
neutrality test, but not by others, suggests that their sta-
tus as candidate loci under selection must be regarded
with considerable caution. However, significant devia-
tions from neutral ity expectation using multiple tests do
not necessarily mean that a particular locus has been
affected by hitchhiking selection. In this case, we applied
three different pairwise population neutrality tests in 12
separate comparisons using two loci (across the popula-
tions: 3 × 12 × 2 = 72 separate tests). This is expected
to result in approximately four false positives at the 95%
P level. The fact that we observed as many as 54 devia-
tions (Table 2) at the 95% P level indicates that it is
unlikely that all the outliers identified by pairwise ana-
lyses are due to type I errors. M oreover, no locus
showed only one significant deviationinonepairwise
population comparison (see Table 2). Therefore, it can
be considered that the approach was quite robust and
conservative in the detection of the effects of
hitchhiking selection, particularly when additional pair-
wise analyses were applied.
Interpretation of the outlier loci and caveats
Actually microsatellites are unlikely to be the target of
selection, but are merely tightly linked to the candidate
genes. Since the microsatellites us ed are located close to
some functional candidate genes (or QTLs) on the same
chromosome, this indicates a high probability that one
or several good c andidate genes (or QTLs) is/are tightly
linked to some of the microsatellites. In many of the
cases examined to date, selective sweeps have affected
only a very small region, potentially containing only one
or a few genes, except in the case of extremely strong
selection (see [57]). Empirical studies indicate that the
negligible LD between a hitchhiking locus and a candi-
date gene underlying selection v aried from tens of bp
(e.g. [55]) to tens or even hundreds of kb (see [58,59]),
which depends on a v ariety of factors such as the geno-
mic regions (e.g. sex chromosome vs. autosome) and
populations (e.g. domesticated vs. wild) investigated, and
the type of markers (e.g. EST- or MHC-microsatellites
vs. microsatellites) used. It has also been suggested that
the LD between loci and candidate genes affected by
selection is determined mainly by the strength of selec-
tion, local recombination rate, po pulation history, and
the age of the beneficial allele [60]. Whatever the rea-
son, significant LD was detected with inter-marker
genomic distances between ca.1100 kb and ca.10300 kb
in this study (see Figure 1), a considerably wider interval
than reported previously.
We detected two microsatellite loci (AGLA17 and
SOD1) probably linked to the candidate gene for the
polled trait in the populations investig ated. The po lled
trait is an autosomal dominant trait in cattle and to
date the genes controlling this trait have not been spe-
cificallyidentified.However,thegenecausingthe
absence of horns is known to be at the centromeric
end of BTA1. Several factors have potentially driven
evolution of the functionally important candidate locus
including a rtificial selection and mating system. In Fin-
nish native cattle populations, polled animals were par-
ticularly favored during selective breeding. However,
we did not detect any locus under selection on BTA20
despite that the fact that several microsatellites includ-
ing GHRJA surround the growth hormone receptor
gene. Growth hormone receptor belongs to the large
superfamily of class 1 cytokine receptors. It has various
roles in growth, lactation and reproduction in cattle
and has been identified as a candidate gene affecting a
few key quantitative traits. Therefore, it is not specific
to dairy traits but to traits related with growth, lacta-
tion and reproduction. Among the cattle populations
Li et al. Genetics Selection Evolution 2010, 42:32
/>Page 11 of 14
investigated here, no contrasting differences in growth,
lactation or reproduction was observed. I n addition, a
recent study on the evolution of the cytoplasmic
domains of the growth hormone receptor gene in
Artiodactyla (see [61]) has suggested that possible
effects of selective sweeps on growth hormone receptor
gene in bovine occurred before domestication and not
among the domestic breeds.
Unfortunately, due to the lack of information on the
mutation and recombination rates, as well as the effec-
tive population size for these data, estimation of the
selection coefficient is not possible here (see [59]).
Given that the genomic interval of significant LD is
comp arable with the findings of hitchhiking around two
anti-malarial resistance genes in humans [58] and
microsatellite hitchhiking mapping in the three-spined
stickleback [59], the hitchhiking selection in this geno-
mic region might be fairly strong. Moreover, the avail-
ability of genomic resources (e.g. NCBI Bovine Genome
Resources; />ome/guide/cow/)in bovine makes it possible to develop
more precise approaches with other much more fre-
quent markers such as SNP. Genotyping an additional
set of high density SNP between AGLA17 and SOD1
markers in the populations investigated will definitely
give more precise information on selection a nd LD in
the region.
Because the populations studied here are not experi-
mental, they differ for many characteristics other than
the polled and horned traits. Thus, some of the genetic
differentiation could have been due to other selective
forces , e.g. pathogens. In addition, since our data violate
at least partly the model assumptions of equal popula-
tion size and migration rates between populations for
the FDIST2 test, the outliers from the test alone should
be considered with caution although the multiple neu-
trality tests based on different assumptions and para-
meter estimation can minimize the possibility of f alse
positives. Moreover, selection is not the only possibility
for changes in the distribution of variation to occur at
particular loci, reduced variation or increased differen-
tiation can result from chance alone, e.g. genetic drift,
bottlenecks or founder events [57]. To obtain clear evi-
dence for selection of these markers, we must analyze
nucleotid e variati ons between polled and horned
populations.
Conclusions
Our microsatellite data from northern Eurasian cattle
populations empirical ly indicate a practical approach for
identifying the best candidate loci under hitchhiking
selection by simultaneously applying multiple neutrality
tests based on different assumptions and parameter esti-
mations. By analyzing microsatellite markers adjacent to
functional genes, we iden tified two loci (SOD1 and
AGLA17)thatare“ selection candidate” targets asso-
ciated with the horned/polled trait in cattle. This result
could be further confirmed by using a more densely
spaced set of markers. It would also be of great inte rest
to see if similar patterns of selection around the POLL
gene are observed in commercial beef breeds such as
Australian Brangus, Angus and Hereford breeds, where
dehorning and breeding practices for polled cattle have
been an accepted part of cattle management for genera-
tions. Another future challenge is to verify the signal of
artificial selection on the POLL gene, possibly using the
next generation sequencing technology to detect the
nucleotide variation of the gene between polled and
horned cattle. In addition, the approach we have taken
in this paper can be easily extended to other cases and
marker types. For example, diversity among cattle has
been directed by man towards different goals (e.g. draft,
milk, meat, fatness, size, color, horn characteristics,
behavior, and other characteristics) during many genera-
tions of selection. Each of these selection events has
potentially left a signature of selection on the genes and
their neighboring loci that could be detected by using
tests such as we have applied here. As a marker technol-
ogy, SNP would offer the advantage of higher through-
put when scanning the genome for evidence of
hitchhiking selection.
Acknowledgements
The study includes parts of the data sets from projects of SUNARE
(Sustainable Use of NAtural REsources; Russia In
Flux, and N-EURO-CAD (North European Cattle Diversity). The projects were
funded by the Academy of Finland, the Ministry of Agriculture and Forestry
in Finland, the Nordic Gene Bank for Farm Animals (NGH), and the Nordic
Council of Ministers. We also thank Tatyana Kiselyova, Zoya Ivanova, Ruslan
Popov, Innokentyi Ammosov, Elena V. Krysova, Nikolai G. Bukarov, Aleksandr
D. Galkin, Boris E. Podoba, Ljudmila A. Popova, and Valerij S. Matjukov for
their help in collecting the samples.
Authors’ contributions
MHL designed the study, performed the data analysis and wrote the
manuscript. TI-T did the laboratory work and contributed to the manuscript
writing and data analysis. HL did the laboratory work, contributed to the
manuscript writing and data analysis. JK planned and coordinated the whole
study, and contributed to the manuscript writing. All the authors read and
approved the final manuscript.
Competing interests
The authors declare that they have no competing interests.
Received: 6 April 2010 Accepted: 6 August 2010
Published: 6 August 2010
References
1. Kantanen J, Olsaker I, Holm L-E, Lien S, Vilkki J, Brusgaard K, Eythrosdottir E,
Danell B, Adalsteinsson S: Genetic diversity and population structure of
20 North European cattle breeds. J Hered 2000, 91:446-457.
2. Li MH, Tapio I, Vilkki J, Ivanova Z, Kiselyova T, Marzanov N, Ćinkulov M,
Stojanović S, Ammosov I, Popov R, Kantanen J: Genetic structure of cattle
populations (Bos taurus) in northern Eurasia and the neighboring Near
Li et al. Genetics Selection Evolution 2010, 42:32
/>Page 12 of 14
Eastern regions: implications for breeding strategies and conservation.
Mol Ecol 2007, 16:3839-3853.
3. Li MH, Adamowicz T, Switonski M, Ammosov I, Ivanova Z, Kiselyova T,
Popov R, Kantanen J: Analysis of population differentiation in North
Eurasian cattle (Bos taurus) using single nucleotide polymorphisms in
three genes associated with production traits. Anim Genet 2006,
27:390-392.
4. Santucci F, Ibrahim KM, Bruzzone A, Hewit GM: Selection on MHC-linked
microsatellite loci in sheep populations. Heredity 2007, 99:240-248.
5. Vasemägi A, Nilsson J, Primmer CR: Expressed sequence Tag-linked
microsatellites as a source of gene-associated polymorphisms for
detecting signatures of divergent selection in Atlantic Salmon (Salmo
salar L.). Mol Biol Evol 2005, 22:1067-1076.
6. Kauer MO, Dieringer D, Schlötterer C: A microsatellite variability screen for
positive selection associated with the “Out of Africa” habitat expansion
of Drosophila melanogaster. Genetics 2003, 165:1137-1148.
7. Vitalis R, Dawson K, Boursot P: Interpretation of variation across marker
loci as evidence of selection. Genetics 2001, 158:1811-1823.
8. Bowcock AM, Kidd JR, Mountain JL Hebert JM, Carotenuto L, Kidd KK,
Cavalli-Sforza LL: Drift, admixture, and selection in human evolution: a
study with DNA polymorphisms. Proc Natl Acad Sci USA 1991, 88:839-843.
9. Beaumont MA, Nichols RA: Evaluating loci for use in the genetic analysis
of population structure. Proc R Soc Lond B Biol Sci 1996, 263:1619-1626.
10. Schlötterer C: Towards a molecular characterization of adaptation in local
populations. Curr Opin Genet Dev 2002, 12:683-687.
11. Porter AH: A test for deviation from island-model population structure.
Mol Ecol 2003, 12:903-915.
12. Beaumont MA, Balding DJ: Identifying adaptive genetic divergence
among populations from genome scans. Mol Ecol 2004, 13:969-980.
13. Wiehe T, Nolte D, Zivkovic D, Schlötterer C: Identification of selective
sweeps using a dynamically adjusted number of linked microsatellites.
Genetics 2007, 175:207-218.
14. Lewontin RC, Krakauer J: Distribution of gene frequency as a test of the
theory of the selective neutrality of polymorphisms. Genetics
1973,
74:175-195.
15. Nei M, Maruyama T: Lewontin-Krakauer test for neutral genes. Genetics
1975, 80:395.
16. Nielsen EE, Hansen MM, Meldrup D: Evidence of microsatellite hitch-
hiking selection in Atlantic cod (Gadus morhua L.): implications for
inferring population structure in nonmodel organisms. Mol Ecol 2006,
15:219-3229.
17. Hansen MM, Skaala Ø, Jensen LF, Bekkevold D, Mensberg K-LD: Gene flow,
effective population size and selection at major histocompatibility
complex genes: brown trout in the Hardenger Fjord, Norway. Mol Ecol
2007, 16:1413-1425.
18. Nielsen EE, Kenchington E: Prioritising marine fish and shellfish
populations for conservation: a useful concept? Fish and Fisheries 2001,
2:328-343.
19. Beaumont MA: Adaptation and speciation: What can Fst tell us? Trends
Ecol Evol 2005, 20:435-440.
20. Guinand B, Lemaire C, Bonhomme F: How to detect polymorphisms
undergoing selection in marine fishes? A review of methods and case
studies, including flatfishes. J Sea Res 2004, 51:167-182.
21. Georges M, Drinkwater R, King T, Mishra A, Moore SS, Nielsen D,
Sargeant LS, Sorensen A, Steele MR, Zhao X, Womack JE, Hetzel J:
Microsatellite mapping of a gene affecting horn development in Bos
taurus. Nat Genet 1993, 3:206-210.
22. Brenneman RA, Davis SK, Sanders JO, Burns BM, Wheeler TC, Turner JW,
Taylor JF: The polled locus maps to BTA1 in Bos indicus × Bos taurus
cross. J Hered 1996, 87:156-161.
23. Harlizius B, Tammen I, Eichler K, Eggen A, Hetzel DJS: New markers on
bovine chromosome 1 are closely linked the polled gene in Simmental
and Pinzgauer cattle. Mamm Genome 1997, 8:225-227.
24. Li MH, Kantanen J: Genetic structure of Eurasian cattle (Bos taurus) based
on microsatellites: clarification for their breed classification. Anim Genet
2010, 41:150-158.
25. Schmutz SM, Marquess FLS, Berryere TG, Moker JS: DNA assisted selection
of the polled condition in Charolais cattle. Mamm Genome 1995,
6:710-713.
26. McKay SD, White SN, Kata SR, Loan R, Womack JE: The bovine 5′ AMPK
gene family: mapping and single nucleotide polymorphism detection.
Mamm Genome 2003, 14:853-858.
27. Viitala S, Schulman N, De Koning -J, Elo K, Kinos R, Virta A, Virta J, Mäki-
Tanila A, Vilkki J:
Quantitative trait loci affecting milk production traits in
Finnish Ayrshire dairy cattle. J Dairy Sci 2003, 86:1828-1836.
28. Ashwell MS, Heyen DW, Weller JI, Ron M, Sonstegard TS, Van Tassell CP,
Lewin HA: Detecting quantitative trait loci influencing conformation
traits and calving ease in Holstein-Friesian cattle. J Dairy Sci 2005,
88:4111-4119.
29. Schrooten C, Bovenhuis H, Coppieters W, van Arendonk JA: Whole genome
scan to detect quantitative trait loci for conformation and functional
traits in dairy cattle. J Dairy Sci 2000, 8:795-806.
30. Ashwell MS, Tassell CPV, Sonstegard TS: A genome scan to identify
quantitative trait loci affecting economically important traits in a US
Holstein population. J Dairy Sci 2001, 84:2535-2542.
31. Arranz JJ, Coppieters W, Berzi P, Cambisano N, Grisart B, Karim L, Marcq F,
Moreau L, Mezer C, Riquet J, Simon P, Vanmanshoven P, Wagenaar D,
Georges M: A QTL affecting milk yield and composition maps to bovine
chromosome 20: a confirmation. Anim Genet 1998, 29:107-115.
32. Medugorac I, Medugorac A, Russ I, Veit-kensch CE, Taberlet P, Luntz B,
Mix HM, Förster M: Genetic diversity of European cattle breeds highlights
the conservation value of traditional unselected breeds with high
effective population size. Mol Ecol 2009, 18:3394-3410.
33. Tapio I, Värv S, Bennewitz J, Maleviciute J, Fimland E, Grislis Z,
Meuwissen THE, Miceikiene I, Olsaker I, Viinalass H, Vilkki J, Kantanen J:
Prioritization for conservation of Northern European cattle breeds based
on analysis of microsatellite data. Conserv Biol 2006, 20:1768-1779.
34. Ihara N, Takasuga A, Mizoshita K, Takeda H, Sugimoto M, Mizoguchi Y,
Hirano T, Itoh T, Watanabe T, Reed KM, Snelling WM, Kappes SM,
Beattie CW, Bennett GL, Sugimoto Y: A comprehensive genetic map of
the cattle genome based on 3802 microsatellites. Genome Res 2004,
14:1987-1998.
35. Blott S, Kim J J, Moisio S, Schmidt-Küntzel A, Cornet A, Berzi P,
Cambisano N, Ford C, Grisart B, Johnson D, Karim L, Simon P, Snell R,
Spelman R, Wong J, Vilkki J, Georges M, Farnir F, Coppieters W: Molecular
dissection of a quantitative trait locus: a phenylalanine-to-tyrosine
substitution in the transmembrane domain of the bovine growth
hormone receptor is associated with a major effect on milk yield and
composition. Genetics 2003, 163:253-266.
36. Weir BS, Cockerham CC: Estimating F-statistics for the analysis of
population structure. Evolution 1984, 38:1358-1370.
37. Goudet J: FSTAT, a program to estimate and test gene diversities and
fixation indices version 2.9.3. 2002 [ />softwares/fstat.htm], Updated from Goudet (1995).
38. Gaunt TR, Rodriguez S, Zapata C, Day INM: MIDAS: software for analysis
and visualisation of interallelic disequilibrium between multiallelic
markers. BMC Genomics 2006, 7:227.
39. Li MH, Merilä J: Extensive linkage disequilibrium in a wild bird
population. Heredity 2010, 104:600-610.
40. Schneider S, Roessli D, Excoffier L: Arlequin Version 2.000: A Software for
Genetic Data Analysis. Genetics and Biometry Laboratory, University of
Geneva, Geneva 2000.
41. Slatkin M: A measure of population subdivision based on microsatellite
allele frequencies. Genetics 1995, 139:457-462.
42. Barrett JC, Fry B, Maller J, Daly MJ: Haploview: analysis and visualization of
LD and haplotype maps. Bioinformatics 2005, 21:263-265.
43. Raymond M, Rousset F: Genepop (version1.2): population genetics
software for exact tests and ecumenicism. J Hered 1995, 86:248-249.
44. Ewens W: The sampling theory of selectively neutral alleles. Theor Popul
Biol 1972, 3:87-112.
45. Watterson G: The homozygosity test of neutrality. Genetics 1978,
88:405-417.
46. Bonin A, Taberlet P, Miaud C, Pompanon F: Explorative genome scan to
detect loci for adaptation along a gradient of altitude in the common
frog. Mol Biol Evol 2006, 23:773-783.
47. Beaumont MA: Detecting population expansion and decline using
microsatellites. Genetics 1999, 153:2013-1029.
Li et al. Genetics Selection Evolution 2010, 42:32
/>Page 13 of 14
48. Schlötterer C, Dieringer D: A novel test statistics for the identification of
local selective sweeps based on microsatellite gene diversity. selective
sweeps Eurekah.com and Klüver Academic/Plenum Publishers, Georgetown,
TX, USANurminski D 2005, 55-64.
49. Vitalis R, Dawson K, Boursot P, Belkhir K: DetSel 1.0: A computer program
to detect markers responding to selection. J Hered 2003, 94:429-431.
50. Vigouroux Y, McMullen M, Hittinger CT, Houchins K, Schulz L, Kresovich S,
Matsuoka Y, Doebley J: Identifying genes of agronomic importance in
maize by screening microsatellites for evidence of selection during
domestication. Proc Natl Acad Sci USA 2002, 99:9650-9655.
51. Whitlock MC, McCauley DE: Indirect measures of gene flow and
migration: FST not equal to 1/(4Nm + 1). Heredity 1999, 82:117-125.
52. Storz JF, Payseur A, Nachman MW: Genome scans of DNA variability in
humans reveal evidence for selection sweeps outside Africa. Mol Biol
Evol 2004, 9:1800-1811.
53. Eveno E, Collada C, Guevara MA, Leger V, Soto A, Diaz L, Gonzalez-
Martinez SC, Cervera MT, Plomion C, Garnier-Gere PH: Contrasting patterns
of selection at Pinus pinaster Ait. Drought stress candidate genes as
revealed by genetics differentiation analyses. Mol Biol Evol 2007,
25:417-437.
54. Bryja J, Charbonnel N, Berthier K, Galan M, Cosson JF: Density-related
changes in selection pattern for major histocompatibility complex genes
in fluctuating populations of voles. Mol Ecol 2007, 16:5048-5097.
55. Vasemägi A, Primmer CR: Challenges for identifying functionally
important genetic variation: the promise of combining complementary
research strategies. Mol Ecol 2005, 14:3623-3642.
56. Ihle S, Ravaoarimanana I, Thomas M, Tautz D: An analysis of signatures of
selective sweeps in natural populations of the house mouse. Mol Biol
Evol 2006, 23:790-797.
57. Kane NC, Rieseberg LH: Selective sweeps reveal candidate genes for
adaptation to drought and salt tolerance in common sunflower,
Helianthus annuus. Genetics 2007, 175:1823-1834.
58. Nash D, Nair S, Mayfong M, Newton PN, Guthmann J-P, Nosten F,
Anderson TJC: Selection strength and hitchhiking around two anti-
malarial resistance genes. Proc R Soc Lond B Biol Sci 2005, 272:1153-1161.
59. Mäkinen HS, Shikano T, Cano JM, Merilä J: Hitchhiking mapping reveals a
candidate genomic region for natural selection in three-spined
stickleback chromosome VIII. Genetics 2008, 178:453-465.
60. Nordborg M, Tavaré S: Linkage disequilibrium: what history has to tell us.
Trends Genet 2006, 18
:83-90.
61. Iso-Touru T, Kantanen J, Li MH, Gizejewski Z, Vilkki J: Divergent evolution in
the cytoplasmic domains of PRLR and GHR genes in Artiodactyla. BMC
Evol Biol 2009, 9:172.
doi:10.1186/1297-9686-42-32
Cite this article as: Li et al.: A microsatellite-based analysis for the
detection of selection on BTA1 and BTA20 in northern Eurasian cattle
(Bos taurus) populations. Genetics Selection Evolution 2010 42:32.
Submit your next manuscript to BioMed Central
and take full advantage of:
• Convenient online submission
• Thorough peer review
• No space constraints or color figure charges
• Immediate publication on acceptance
• Inclusion in PubMed, CAS, Scopus and Google Scholar
• Research which is freely available for redistribution
Submit your manuscript at
www.biomedcentral.com/submit
Li et al. Genetics Selection Evolution 2010, 42:32
/>Page 14 of 14