Báo cáo sinh học: "Joint QTL analysis of three connected F2-crosses in pigs" pdf
Bạn đang xem bản rút gọn của tài liệu. Xem và tải ngay bản đầy đủ của tài liệu tại đây (590.65 KB, 12 trang )
RESEARC H Open Access
Joint QTL analysis of three connected F
2
-crosses
in pigs
Christine Rückert, Jörn Bennewitz
*
Abstract
Background: Numerous QTL mapping resource populations are available in livestock species. Usually they are
analysed separately, although the same founder breeds are often used. The aim of the present study was to show
the strength of analysing F
2
-crosses jointly in pig breeding when the founder breeds of several F
2
-crosses are the
same.
Methods: Three porcine F
2
-crosses were generated from three founder breeds (i.e. Meishan, Pietrain and wild
boar). The crosses were analysed jointly, using a flexible genetic model that estimate d an additive QTL effect for
each founder breed allele and a domi nant QTL effect for each combination of alleles derived from different
founder breeds. The following traits were analysed: daily gain, back fat and carcass weight. Substantial phenotypic
variation was observed within and between crosses. Multiple QTL, multiple QTL alleles and imprinting effects were
considered. The results were compared to those obtained when each cross was analysed separately.
Results: For daily gain, back fat and carcass weight, 13, 15 and 16 QTL were found, respectively. For back fat, daily
gain and carcass weight, respectively three, four, and five loci showed significant imprinting effects. The number of
QTL mapped was much higher than when each design was analysed individually. Additionally, the test statistic
plot along the chromosomes was much sharper leading to smaller QTL confidence intervals. In many cases, three
QTL alleles were observed.
Conclusions: The present study showed the strength of analysing three connected F
2
-crosses jointly. In this
experiment, statistical power was high because of the reduced number of estimated parameters and the large
number of individuals. The applied model was flexible and was computationally fast.
Background
Over the last decades, many informative resource popula-
tions in livestock breeding have been established to map
quantitative trait loci (QTL). Using these populations,
numerous QTL for many traits have been mapped [1].
However, the mapping resolution of these studies is
usually limited by the size of the population. One way to
increase the number of individuals is to conduct a joint
analysis of several experimental designs. In dairy cattle
breeding, a joint anal ysis of two half-sib designs with
some overlapping families has been performed by Benne-
witz et al. [2] and has shown that a combined analysis
increases statistical power substantially, due to the
enlarged design and especially due to increased half-sib
family size. In pig breeding, a joint analysis has been
successfully implemented by Walling et al. [3] in w hich
seven independent F
2
-crosses have beenanalysedina
combined approach for one chromosome. The mapping
procedure developed by Haley et al. [4] was used where
some breeds are initially grouped together in order to ful-
fil the assump tion of the line cross approach (i. e. two
founder lines are fix ed for alternative QTL alleles ).
Further examples can be found in Kim et al. [5] and
Pérez-Enciso et al. [6], both using pig crosses, or in Li et
al. [7] using laboratory mouse populations.
Analysing several F
2
-crosses jointl y could be especially
useful when the founder breeds used for the crosses are
the same i n all the designs. This situation can occur in
plant breeding, where crosses are produced from a diallel
design of multiple inbred lines (e.g. Jansen et al. [8]).
Although rare in livestock breeding, one example is the
experiment described by Geldermann [9]. For this kind
of experiment Li u and Zeng [10] have proposed a flexible
* Correspondence:
Institute of Animal Husbandry and Breeding, University of Hohenheim, D-
70599 Stuttgart, Germany
Rückert and Bennewitz Genetics Selection Evolution 2010, 42:40
/>Genetics
Selection
Evolution
© 2010 Rückert and Bennewitz; licensee BioMed Central Ltd. This is an Open Access article di stributed under the terms of the Creative
Commons Attribution License (ht tp://creativecommons.org/licenses /by/2.0), which permits unrestricted use, distribution, and
reprodu ction in any medium, provided the original work is properly cited.
multiallelic mixture model, which estimates an additive
QTL effect for each founder line and a dominan t QTL
effect for each founder line combination. They have esti-
mated their model by adopting maximum likelihood
using an EM algorithm.
Theaimofthepresentstudywastoconductajoint
genome scan covering the autosome s for three porcine
F
2
-crosses derived from t hree founder breeds. For this
purpose, the method of Liu and Zeng [10] was modified
in order to include imprinting effects. The effect of a
combined analysis was demonstrated by comparing the
results for three traits with those obtained when the
three crosses were analysed separately.
Methods
Connected F
2
-crosses
The experimental design is described in detail by Gelder-
mann et al. [9] and only briefly reminded here. The first
cross (MxP) was obtained by mating o ne Meishan (M)
boar with eight Pietrain (P) sows. The second cross (WxP)
was generated by mating one European wild boar (W)
with nine P sows, some of which were the same as in the
MxP cross. The third cross (WxM) was obtained by mat-
ing the same W boar with four Meishan (M) sows. The
number of F
1
-individuals in the MxP, WxP and WxM
crosses was 22, 28 and 23, respectively and the the number
of F
2
-individuals was 316, 315 and 335, respectively. The
number of sires in the F
1
-generation was between two and
three. The joint design was built by combining all three
designs. All individuals were kept on one farm; housing
and feeding condit ions have been descr ibed by Müller
et al. [11]. All F
2
-individuals were phenotyped for 46 traits
including growth, fattening, fat deposition, muscling, meat
quality, stress resistance and body conformation, see [11]
for further details. In this study, we investigated three
traits i.e. back fat depth, measured between the 13
th
and
14
th
ribs, daily gain and carcass weight. The phenotypes
were pre-corrected for the effect of sex , litter, season and
different age at slaughtering before QTL analysis. The
means and standard deviations of the observations are
given in Table 1. There is substantial variation within and
between crosses for all three traits. Altogether 242 genetic
markers (mostly microsatellites) were genotyped, covering
all the autosomes, with a large number of overlapping
markers in the crosses. Both sex chromosomes were
excluded from the analysis because they deserve special
attention (Pérez-Enciso et al. [6]).
Linkage maps and information content
A common linkage map was estimated using Crimap
[12]. Due to the large n umber of overla pping markers
these calculations were straightforward. I t was assumed
that two founder breeds (breed i and j,withi and j
being breed M, P, or W) of a single cross are divergent
homozygous at a QTL, i .e. showing only genotype Q
i
Q
i
and Q
j
Q
j
, respectively. Although the t hree breeds in this
study are outbred breeds, this assumption holds approxi-
mately, because the b reeds have a very different history
and are genetically divergent (see also Haley et al. [4]).
Subsequently, for each F
2
-individual of a certain cross four
genotype probabilities
pr Q Q
i
p
i
m
()
,
pr Q Q
j
p
i
m
()
,
pr Q Q
i
p
j
m
()
and
pr Q Q
j
p
j
m
()
were calculated for each chromosomal position.
The upper subscript denote s the parental origin of the
alleles (i.e. paternal (p)ormaternal(m)derived)andthe
lower subscript denotes the breed origin of the alleles (i.e.
breed i or j). These probabilities were estimated using a
modified version of Bigmap [13]. This program follows the
approach of Haley et al. [4] and uses information of multi-
ple linked markers, which may or may not be fixed for
alternative alleles in the breeds. The information content
for additive and imprinting QTL effects were estimated
for each chromosomal position, using an entropy-based
information measure as described by Mantey et al. [14].
The information content for the additive QTL effect
represents the probability that two alternative QTL homo-
zygous genotypes can be distinguished, given the indivi-
duals are homozygous. Similarly , the imprinting
information content denotes the probability that two alter-
native heterozygous QTL genotypes c an be separated,
given that the individuals are heterozygous. The informa-
tion content was solely used to assess the amount of infor-
mation available to detect QTL and was not used fo r the
QTL mapping procedure.
Genetic and statistical model
On the whole, the genetic model followed the multial le-
lic model of Liu and Zeng [10], but was extended to
account for imprinting. It is assumed that the breeds are
Table 1 Number of observations (n), mean, standard
deviation (Sd), minimum (Min) and maximum (Max) of
the phenotypic observations and coefficient of variation
(CV)
Trait Cross n Mean Sd Min Max CV
Back fat depth [mm] MxP 316 21.96 6.94 6.7 43.3 31.59
WxP 315 16.76 5.85 5.3 37.3 34.92
WxM 335 31.62 8.62 6.0 54.7 27.25
Joint 966 23.61 9.54 5.3 54.7 40.40
Daily gain [g] MxP 316 589.49 132.03 174.0 951.0 22.40
WxP 315 528.78 107.83 125.0 790.0 20.39
WxM 335 456.65 94.14 143.0 741.0 20.61
Joint 966 523.63 124.61 125.0 951.0 23.80
Carcass weight [kg] MxP 316 76.22 14.19 42.2 109.6 18.62
WxP 315 57.14 12.60 19.7 89.2 22.05
WxM 335 54.75 11.71 20.8 86.8 21.38
Joint 966 62.55 16.02 19.7 109.6 25.61
Rückert and Bennewitz Genetics Selection Evolution 2010, 42:40
/>Page 2 of 12
inbred at the QTL. The genetic mean was defined as the
mean of the L = 3 founder breeds. Considering one
locus, the mean is
=
=
∑
g
L
ii
i
L
1
,
with g
ii
being the homozygote ge notypic value in breed
i (i = M, P, and W, respectively). Now let us consider hap-
loid populations. The mean of the breeds consisting o f
paternal derived and maternal derived alleles at the locus is
p
i
p
i
L
m
i
m
i
L
g
L
g
L
==
==
∑∑
11
and ,
respectively. The term
g
i
p
(
g
i
m
) denotes the genotypic
value of the paternal (maternal) derived allele. The addi-
tive effect of the paternal derived and m aternal derived
allele is
ag
i
p
i
p
p
=−
and
ag
i
m
i
mm
=−
, respectively.
This imposes the restrictions
aa
i
p
i
L
i
m
i
L
==
∑∑
==
11
00and .
(1)
In this haploid model, putative imprinting eff ects will
result in different haploid means. However, in a diallelic
model the two hap loid means are not observable, but
become part of the mean as μ = μ
p
+ μ
m
. Thus the
genetic model of the diploid F
2
-population generated
from the breeds i and j is as follows:
g
g
g
g
ii
pm
ij
pm
ji
pm
jj
pm
⎡
⎣
⎢
⎢
⎢
⎢
⎢
⎢
⎤
⎦
⎥
⎥
⎥
⎥
⎥
⎥
=
⎡
11000
10011
01101
00110
⎣⎣
⎢
⎢
⎢
⎢
⎤
⎦
⎥
⎥
⎥
⎥
⎡
⎣
⎢
⎢
⎢
⎢
⎢
⎢
⎢
⎤
⎦
⎥
⎥
⎥
⎥
⎥
⎥
⎥
+
⎡
⎣
⎢
⎢
⎢
⎢
⎤
⎦
a
a
a
a
d
i
p
i
m
j
p
j
m
ij
⎥⎥
⎥
⎥
⎥
,
(2)
where again the upper subscripts denote the parental
origin and the lower subscripts denote the breed origin
of the alleles. Putative imprinting effects will result in
aa
i
p
i
m
≠
. This genetic model was used to set up the sta-
tistical model. We used the notation of Liu and Zeng
[10] for comparison purposes.
ycrosszzz
ijk ij
ijk i
p
ijk i
p
ijk i
m
ijk i
m
ijk j
p
ijk j
p
=+ + +(
,,
,,
,,
www++
++
z
ze
ijk j
m
ijk j
m
ijk
pm
ijk
pm
ijk
,,
)wa
wd
(3)
where y
ijk
is the phenotypic observation of the kth
individual in the F
2
-cross deri ved from breed i and j .
The term cross
ij
denotes the fixed effect of the F
2
-cross.
It was included in th e model ( and not in the model for
the pre-correction of the data for other syst ematic
effects as described above), because it contai ns a part of
the genetic model (i.e. the mean). The term e
ijk
is a ran-
dom residual with heterogeneous variance, i.e.
eN
ijk ij
~(, )0
2
.Vectora contains the additive effects
(
aa aa
p
m
L
p
L
m
11
, , ,
)andvectord contains the dominance
effects (d
1,2
, d
1,3
, ,d
(L-1),L
). The four w terms are row
vectors of length 2*L with one element equal to one and
the other elements equal to zero. Each w term indicates
one of the four possible additive effects in a that could
be observed in the F
2
-individual based on pedigree data.
For example,
w
ijk i
p
,
denotes the putative allele in off-
spring ijk (indicated by first lower subscript ijk)inher-
ited paternally (indicated by upper subscript p)from
line i (indicated by second lower subscript i). The four
z terms are scalars and are either zero or one. They
indicate if the offspring inherited the corresponding
allele from the corresponding parent. For each offspring
these four terms sum up to two. Similarly,
w
ijk
pm
is a ro w
vector of length L, i ndicating which dominance effect
could be possible in the offspring based on pedigree data.
The scalar
z
ijk
pm
is one i f the offspring is heterozygous at
the QTL and zero otherwise. The true z terms were
unknown and therefore calculated from the four estimated
QTL-genotype probabilities at each chromosomal posi-
tion. For example, the term
z
ijk i
p
,
was set equal to
pr Q Q pr Q Q
i
p
i
m
i
p
j
m
()()+
. The dominance term (
z
ijk
pm
) was
the sum of the two heterozygous genotype probabilities.
The statistical model was a multiple linear regression. The
residual variance was assumed to be heterogeneous.
In order to avoid an over-parameterisation due to the
restrictions shown in (1), the genetic model (2) was
re-parameterised taking the restrictions in (1) into
account, as shown in Appendix. The final regression
was also re-parameterised taking these restrictions into
account. Hence, in fact only 2*L-2 = 4 additive effects
were estimated (i.e.
ˆ
,
ˆ
,
ˆ
,
ˆ
aa aa
i
p
i
m
j
p
j
m
). The estimated
paternal additive effects of the breeds were
ˆˆ
aa
M
p
i
p
=
,
ˆˆ
aa
P
p
j
p
=
and
ˆ
(
ˆˆ
)aaa
W
p
i
p
j
p
=− +
, respectively, where the
lower subscripts M, P and W denote the three breeds.
The same holds true for t he maternal additive effects.
The combined m endelian additive QTL effects for the
three breeds were calculated as
ˆˆˆ
aaa
M
i
p
i
m
=+
,
ˆˆˆ
aaa
P
j
p
j
m
=+
, and
ˆ
(
ˆˆ ˆˆ
)aaaaa
W
i
p
i
m
j
p
j
m
=− + + +
.
The model was fitted every cM on the autosomes by
adapting the z terms accordingly. The test statistic was
an F-test; the F-values were converted into LOD-scores
as LOD ≈ (np*F)/(2*log(10)) with np being the number
of estimated QTL effects [14], i.e. np = 7 (four additive
and three dominance effects).
When imprinting is not accounted for, the models (2)
and ( 3) reduce to the proposed model of Liu and
Rückert and Bennewitz Genetics Selection Evolution 2010, 42:40
/>Page 3 of 12
Zeng [10]. In this case, L - 1 = 2 additive effects are esti-
mated. In this study, this was also solved by using multi-
ple linear regressions with heterogeneous residual
variances.
Hypothesis testing
The highes t test-statistic was recorded within a chromo-
some-segment (for the definition of a chromosome-
segment see the next section). The global null hypothesis
was that at the chromosomal position with the highest
test statistic, every estimated parameter in a and d is
equal to zero. The corresponding alternative hypothesis
was that at least one parameter was different from zero.
The 5% thresh old of the test statistic corrected for multi-
ple testing within the chromosome-segment was
obtained using the quick method of Piepho [15]. Once
the global null hypothesis was rejected, the following
sub-hypotheses were tested at significant chromosomal
positions by building linear contrasts.
Test for an additive QTL:
HandHandor
01
00 0 0:,:/.aa aa aa aa
i
p
i
m
j
p
j
m
i
p
i
m
j
p
j
m
+= += +≠ +≠
The test statistic was an F-test with two degrees of
freedom in the numerator.
Test for dominance at the QTL:
HH
0
:,:.dd
ij ij
=≠00
1
The test statistic was an F-test with three degrees of
freedom in the numerator.
Test for imprinting at the QTL:
H and H and or
01
:,:/.aa aa aa aa
i
p
i
m
j
p
j
m
i
p
i
m
j
p
j
m
== ≠ ≠
The test statistic was an F-test with two degrees of
freedom in the numerator. The mode of imprinting
(either paternal or maternal imprinting) at the QTL
with significant imprinting effects was assessed by com-
paring the paternal and maternal effect estimates.
The test of the three sub-hypotheses resulted in the
three error probabilities p
add
, p
dom
, and p
imp
for additive,
dominance and imprinting QTL, respectively. Note that
if the global null hypothesis was rejected, at least one of
the three sub-null-hypotheses had to be rejected as well.
Therefore, correction for multiple testing was done only
for the global null hypothesis, and for the sub-null-
hypothesis, the comparison-wise error probabilities were
reported.
Finally, the number of QTL alleles that could be dis-
tinguished based on their additive effects was assessed.
This was done by testing the segregation of the QTL in
each of the three crosses, considering only additive men-
delian effects (i.e. ignoring imprinting and dominance).
The corresponding test was:
HH
01
:,:.aa aa aa aa
i
p
i
m
j
p
j
m
i
p
i
m
j
p
j
m
+=+ +≠+
Once again an F -test was used and was applied for
each of the three crosses. If the QTL segregated
between two (three) crosses the number of QTL alleles
wastwo(three).Notethatitwasnotpossiblethata
QTL segregated solely in one cross.
Confidence intervals and multiple QTL
For each significant QTL, a confiden ce interval was cal-
culated using the one LOD-drop method mentioned in
Lynch and Walsh [16]. The lower and upper bounds
were then obtained by going from the lower and upper
endpoints of the one LOD-drop region to the next left
and next right marker, respectively. This procedure
worked against the anti-conservativeness of the one
LOD-drop off method. The anti-conservativeness was
shown by Visscher et al. [17].
The procedure to i nclude multiple QTL in the model
is recursive a nd proceeds as follows. Initially, the gen-
ome was scanned and the 5% chromosomes-wise thresh-
olds were estimated. Next the QTL with the highest test
statistic exceeding the threshold was included as a
cofactor in the model and the genome was scanned
again, but excluding the positions within the confidence
interval of this QTL. This was repeated until no addi-
tional significant QTL could be identified. In each
round of cofactor selection, the quest ion of whether the
test statistic of previously identified QTL remained
above their significance threshold levels was assessed; a
QTL was excluded from the model if no longer signifi-
cant. This can happen if some linked or e ven unlinked
QTL co-segregate by chance (e.g. de Koning et al. [18])
and the strategy used here accounts for this co-
segregation. The thresholds were calculated for chromo-
somes without having a QTL as a cofactor in the model
considering the whole chromosome (i.e. 5% chromo-
some-wise thresholds). If, however, a QTL on a chromo-
some was already included as a cofactor, the thresholds
were estimated for the chromosome segment spanned
by a chromosomal endpoint and the next bound of the
QTL confidence interval (i.e. 5% chromosome-segment-
wise). In case more than one QTL was included as a
cofactor on a chromosome, a chromosome-segment
between two QTL was spanned by the two neighbouring
bounds of the confidence intervals and the threshold
was calculated for this chromosome segment. By defin-
ing chromosome-segments in this way, multiple QTL on
one chromosome were considered. The significance
thresholds were determined for the regions on the chro-
mosomes that were scanned for QTL.
Rückert and Bennewitz Genetics Selection Evolution 2010, 42:40
/>Page 4 of 12
Separate analysis of three crosses
In the study of Geldermann et al. [9], the crosses were
analysed separately, but without modelling imprinting.
Therefore, in order to show the benefit of the joint ana-
lysis, the crosses were analysed again separately, but
accounting for imprinting. The following standard
model was applied:
y a p d p imp p e
ijk a d im ijk
=+ + + +
** * ,
(4)
where μ is the mean of the F
2
-offpring of the cross,
p prQQ prQQ
d
i
p
j
m
j
p
i
m
=+()()
,
p prQQ prQQ
d
i
p
j
m
j
p
i
m
=+()()
,and
p prQQ prQQ
im
i
p
j
m
j
p
i
m
=−()()
.Thetermsa, d,andim
are the regression coefficients, representing the additive,
dominance, and imprinting effects, respectively. The test
statistic was an F-test; LOD scores were obtained as
described above, but using np = 3. Chro mosome-
segment-wise 5% thresh old values were obtained again
using the quick method explained earlier. Multiple QTL
were considered as described above.
Results
The marker order of the estimated linkage map (see
Additional file 1) is in good agreement with other maps.
The average information content for additive and
imprinting effects was high (about 0.868 and 0.752,
respectively, averaged over all individuals and chromoso-
mal positions). This indicated that informative markers
were dense enough to detect imprinting effects (which
requires a higher marker density [14]).
The results of the joint design (obtained with model
(3)) for the traits back fat depth, daily gain and carcass
weight are shown in Tables 2, 3, and 4, respectively, and
oftheseparateanalysisofthethreecrosses(obtained
with model (4)) are shown in Table 5. For each reported
QTL in the joint design (i.e. showing an error probabil-
ity smaller than 5% chromosome-segment-wise) the esti-
mated QTL position, the confidence interval, and the
comparison-wise error probabilities of the sub-
hypothesis are given. A sub-hypothesis was declared as
significant if the comparison-wise error probability was
below 5%. QTL effects are often heavily overestimated
due to significance testing (e.g. Göring et al. [19]).
Therefore, we did not repo rt these estimates, except for
QTL showing imprinting (Table 6). Instead we reported
the order of the breed QTL effects in Tables 2, 3, and 4.
Thirteen QTL were found for back fat depth (see
Table 2) of which 11 showed a significant additive effect,
five significant dominant effects and three a significant
imprinting effect. The QTL on SSC12 and SSC13 were
only significant because of their dominance eff ects. For
three QTL, three alleles could be identified based on
their combined additive effect. In all three cases the
effect of the P breed allele was highest, followed by the
effect of the M breed allele. For other QTL, the effect of
theMbreedallelewashighercomparedtothatofthe
P and W breeds, whereby P and W were often the same
when only two QTL alleles could be separated. Natu-
rally, for those QTL without a significant additive effect
no order of breed allele effects could be observed. For
daily gain, 15 QTL were mapped of which 11 showed a
significant additive, six a significant dominant and four
a significant imprinting effect (Table 3). The QTL on
SSC5 was only significant because of its imprinting
effect and the QTL on SSC9, SSC10 and SSC16 were
significant because of their dominance. For five QTL,
three breed alleles could be identified and the order was
always P over M over W. For the QTL with only two
alleles, the alleles of breeds P and W or of P and M
breeds were the same, but not for M and W breeds. For
carcass weight, 16 QTL were mapped of which 13
showed a signifi cant additive, seven a sign ificant domi-
nant and five a significant imprinting effect. For nine
QTL, three different breed alleles could be identified
and the order was always P over M over W.
Imprinting seemed to be important for these traits.
When imprinting was not accounted for in the joint
design, only eight, nine and nine QTL were mapped for
respectively back fat depth, daily gain and carcass weight
(not shown). Notably, all QTL found with the model with-
out imprinting were also found when imprinting was con-
sidered (not shown). Imprinting was not always found in
all breeds. For examples see Table 6, whe re estimated
additive QTL effects are shown for traits with a significant
imprinting effect. For example, the paternal allele effect of
the P breed at the QTL for carcass weight on SSC7 was
higher compared to the maternal allele effect, which
pointed to maternal imprinting. This, however, was not
observed in the M breed at this QTL (Table 6). The QTL
on SSC3 for daily gain showed opposite modes of imprint-
ing in the M and P breeds. Also no clear mode of imprint-
ing could be observed for the imprinted QTL on SSC2.
For the remaining QTL with imprinting effects the mode
of imprinting was consistent (Table 6).
When comparing the results of the joint design with
those from the separate analysis of the crosses (Table 5)
it can be observed that the number of significant QTL
is much lower in the separate analysis, even if all
QTL across the three crosses are considered as separate
QTL. Additionally, in the joint design i t was sometimes
possible to map several QTL for one trait on one chro-
mosome. For example, on SSC1 thr ee QTL were
detected for back fat depth in the joint design, whereas
only one was detected within the sing le crosses. A com-
parison of the plots of the corresponding test statistics
Rückert and Bennewitz Genetics Selection Evolution 2010, 42:40
/>Page 5 of 12
Table 2 QTL results from the joint design and back fat
SSC Position CI
a
F-value p
add
b
p
dom
c
p
imp
d
Order of effects
e
1 90 [59.3; 95.8] 3.11 0.0195 0.0762 0.1062 â
P
>â
M
>â
W
1 144 [126.3; 149.6] 6.81 <0.0001 0.0889 0.2779 â
P
>â
M
>â
W
1 179 [149.6; 209.1] 2.80 0.0101 0.1010 0.5290 â
M
>â
P
=â
W
2 13 [0.0; 39.9] 5.01 0.0058 0.5031 <0.0001 â
M
>â
P
=â
W
2 77 [68.0; 81.0] 5.79 <0.0001 0.1947 0.3441 â
P
>â
M
>â
W
6 100 [96.4; 101.2] 6.46 <0.0001 0.0275 0.0587 â
M
>â
P
=â
W
7 83 [75.5; 100.9] 5.81 <0.0001 0.0593 0.0422 â
W
>â
M
=â
P
11 83 [61.0; 93.3] 2.77 0.0094 0.1511 0.0939 â
P
>â
M
=â
W
12 58 [0.0; 84.1] 3.37 0.2599 0.0006 0.2458 â
M
=â
P
=â
W
13 56 [39.2; 81.2] 2.34 0.3950 0.0134 0.1595 â
M
=â
P
=â
W
14 51 [27.5; 60.7] 3.05 0.0107 0.0332 0.0802 â
M
=â
P
>â
W
17 74 [43.6; 97.9] 2.26 0.0199 0.9068 0.0267 â
M
>â
P
=â
W
18 27 [10.9; 43.6] 4.38 <0.0001 0.0251 0.2384 â
M
=â
P
>â
W
a
confidence interval;
b
comparison-wise error probability for additive effects;
c
comparison-wise error probability for d ominant effects;
d
comparison-wise error
probability for imprinting effects;
e
â
P
estimated effect of Pietrain breed, â
M
estimated effect of Meishan breed, â
W
estimated effect of the wild boar breed.
Table 3 QTL results from the joint design and daily gain
SSC Position CI
a
F-
value
p
add
b
p
dom
c
p
imp
d
Order of
effects
e
1 58 [25.4;
77.3]
3.27 0.0001 0.1850 0.6335 â
P
>â
M
>â
W
1 134 [126.3;
141.7]
6.15 <0.0001 0.1376 0.1203 â
P
>â
M
>â
W
2 8 [0.0;
39.9]
3.17 0.0058 0.0173 0.8928 â
P
=â
W
>â
M
3 58 [50.8;
74.0]
5.39 0.0006 0.0008 0.0241 â
P
=â
W
>â
M
4 93 [85.6;
98.1]
5.15 <0.0001 0.5892 0.7868 â
P
>â
M
>â
W
5 128 [92.2;
150.4]
2.95 0.4389 0.8924 0.0001 â
M
=â
P
=â
W
6 91 [80.0;
112.0]
2.93 0.0110 0.0647 0.1012 â
P
>â
M
>â
W
6 202 [177.9;
235.5]
2.94 0.0441 0.0161 0.1780 â
W
>â
M
>â
P
7 42 [24.8;
94.4]
2.65 0.0080 0.5892 0.0261 â
M
=â
P
>â
W
8 8 [0.0;
34.0]
4.20 <0.0001 0.5782 0.0363 â
P
>â
M
>â
W
9 90 [80.0;
110.1]
2.86 0.0018 0.5195 0.1961 â
W
>â
M
=â
P
9 194 [187.4;
194.6]
3.29 0.0778 0.0011 0.3357 â
M
=â
p
=â
W
10 53 [30.6;
74.1]
2.98 0.6023 0.0044 0.0509 â
M
=â
P
=â
W
15 67 [52.5;
99.4]
2.99 0.0038 0.0655 0.4120 â
M
=â
P
>â
W
16 87 [69.4;
98.0]
3.14 0.2405 0.0043 0.0676 â
M
=â
P
=â
W
a
confidence interval;
b
comparison-wise error probability for additive effects;
c
comparison-wise error probability for dominant effects;
d
comparison-wise
error probability for imprinting effects;
e
â
P
estimated effect of Pietrain breed,
â
M
estimated effect of Meishan breed, â
W
estimated effect of the wild boar
breed.
Table 4 QTL results from the joint design and carcass
weight
SSC Position CI
a
F-
value
p
add
b
p
dom
c
p
imp
d
Order of
effects
e
1 89 [77.3;
104.1]
7.94 <0.0001 0.7482 0.0385 â
P
>â
M
>â
W
2 76 [70.6;
81.0]
5.55 <0.0001 0.0143 0.2408 â
P
>â
M
>â
W
3 0 [0.0;
35.9]
3.34 0.0001 0.1644 0.5312 â
P
>â
M
>â
W
3 58 [50.2;
74.0]
3.01 0.0489 0.0064 0.3611 â
P
=â
W
>â
M
4 73 [62.1;
81.0]
6.00 <0.0001 0.2317 0.6112 â
P
>â
M
>â
W
4 97 [87.6;
107.7]
2.64 0.0016 0.3586 0.1014 â
P
>â
M
>â
W
5 120 [110.0;
150.4]
3.05 0.0216 0.7526 0.0022 â
W
>â
M
=â
P
6 87 [80.0;
94.4]
4.38 0.0006 0.0105 0.0800 â
P
>â
M
>â
W
7 36 [0.0;
50.0]
2.60 0.1441 0.0243 0.0415 â
M
=â
P
=â
W
7 59 [36.3;
73.3]
3.63 0.0003 0.0623 0.4030 â
M
=â
P
>â
W
8 13 [0.0;
34.0]
4.80 <0.0001 0.3863 0.0822 â
P
>â
M
>â
W
8 127 [110.1;
151.8]
2.99 0.0191 0.0088 0.6977 â
P
=â
W
>â
M
10 59 [30.6;
74.1]
2.69 0.9783 0.0346 0.0085 â
M
=â
P
=â
W
12 86 [64.5;
109.8]
2.53 0.0070 0.2919 0.0902 â
P
>â
M
>â
W
14 93 [60.7;
105.1]
2.98 <0.0001 0.9244 0.8026 â
P
>â
M
>â
W
16 0 [0.0;
21.2]
3.62 0.4887 0.0438 0.0010 â
M
=â
P
=â
W
a
confidence interval;
b
comparison-wise error probability for additive effects;
c
comparison-wise error probability for dominant effects;
d
comparison-wise
error probability for imprinting effects;
e
â
P
estimated effect of Pietrain breed,
â
M
estimated effect of Meishan breed, â
W
estimated effect of the wild boar
breed.
Rückert and Bennewitz Genetics Selection Evolution 2010, 42:40
/>Page 6 of 12
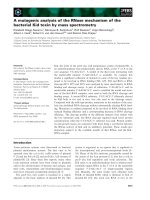
is given in Figure 1. The plot of the joint design is much
sharper and more pronounced, leading to the separation
of the three QTL. This can also be found on SSC2 for
thesametrait(Figure1).Ontheonehand,inthiscase
twoQTLwerefoundinthejointdesign,butoneQTL
in the designs MxP and WxM (Tables 2, 3, 4, and 5).
On the other hand, almost all QTL detected in the sin-
gle designs were also found in the joint design. This can
be seen when comparing the overlap of the confidence
intervals of the QTL (Tables 2, 3, 4, and 5).
When selecting QTL as cofactors, every QTL
remained above its significance threshold level, and thus
stayed in the model. For most QTL, the test statistic
increased when additional QTL were selected as
cofactors.
Discussion
QTL results
Because n umerous QTL w ere mapped in the joint
design, we will not discuss all identified QTL in detail.
For a comparison of QTL found in this study and found
by other groups see entries in the database pigQTLdb
(Hu et al. [1]). Some QTL have also been reported by
various other groups (e.g. QTL for carcass weight on
SSC4).OtherQTLarenovel(e.g.QTLforbackfaton
SSC11 and SSC18). The signs of the breed effects are
often, but not always, consistent with the history of the
breed. For example, the Meishan breed is known to be a
fatty breed, and it would subsequently be expected that
most of the M breed allele effects at the QTL for back
fat depth are higher compared to the P and W breed
alleles. However, this was not always observed (Table 2).
For daily gain and carcass weight traits, the breed allele
effects of breed P are generally the highest (Tables 3
and 4), which fits to the breeding history of P. The P
breed is frequently used as a sire line for meat produc-
tion and daily gain and carcass weight are part of the
breeding goal. Naturally, wild pigs have not been subject
to artificial selection for the three traits; their breed
allele effects were almost always lowest for the three
traits (Tables 2, 3, and 4). Because the P breed was
selected for increase in daily gain and carcass length and
M is a much heavier and fattier breed than W, this was
expected for daily gain and carcass length. Addition ally,
because P was selected against back fat during the last
decades and W is a lean breed, the breed effects of M
and P are frequently the same and lower than the fatty
M breed allele effect (Table 2).
Three QTL with imprinting effects were found on
SSC7 o f which two were paternally imprinted. The
mode of imprinting was not clear for imprinted carcass
weight QTL (Table 6), because nearly the sam e paternal
and maternal additive effects were observed in the M
breed. De Koning et al. [20] have mapped a maternal
expressed QTL for muscle depth on the same chromo-
some. A well known gene causing an imprinting effect
is IGF2, which is located in the proximal region of SSC2
(Nezer et al. [21], van Laere et al. [22]). De Koning et al.
[20] have mapped an imprinted QTL for back fat thick-
ness with paternal expression close to the IGF2 region.
In our study, we found an imprinted QTL in the corre-
sponding chromoso mal region for this trait as well
(Tables2and6),butitwasnotpossibletounravelthe
mode of imprinting. A critical question is: are the
detected imprinting effects really due to imprinting? As
mentioned by Sandor and Georges [23] the number of
imprinted genes in mammals has been estimated to be
only around 100, which is not in a good agreement with
the number of m apped imprinting QTL. The assump-
tion underlying the classical model (4) for the detection
of imprinting is that the F
1
-individuals are all heterozy-
gous at the QTL. It has been shown by de Koning et al.
[24] that in cases where this assumption is violated, the
gene frequencies in the F
1
-sires and F
1
-dams may vary
Table 5 QTL results from the three single crosses (MxP,
WxP, WxM) for the three traits
Cross Trait SSC Position CI
MxP Back fat depth 2 52 [0.0; 78.3]
6 97 [80.0; 98.3]
6 100 [98.3; 101.2]
6 104 [101.2; 124.9]
12 4 [0.0; 51.0]
WxP 1 135 [126.3; 149.6]
7 47 [0.0; 73.3]
WxM 1 144 [126.3; 149.6]
2 78 [52.9; 81.0]
MxP Daily gain 3 58 [50.8; 74.0]
WxP 1 60 [43.5; 77.3]
1 90 [77.3; 119.2]
1 133 [119.2; 141.7]
2 67 [52.9; 96.0]
8 0 [0.0; 18.0]
9 194 [187.4; 194.6]
WxM 7 58 [36.3; 73.3]
15 66 [52.5; 99.4]
MxP Carcass weight 2 76 [70.6; 78.3]
4 82 [27.7; 98.1]
8 21 [0.0; 49.4]
WxP 1 62 [43.5; 77.3]
1 133 [110.3; 141.7]
2 68 [52.9; 81.0]
2 90 [81.0; 115.1]
16 0 [0.0; 21.2]
WxM 1 83 [43.5; 95.8]
1 144 [126.3; 149.6]
7 63 [50.0; 75.2]
Rückert and Bennewitz Genetics Selection Evolution 2010, 42:40
/>Page 7 of 12
randomly, which might result in a significant, but erro-
neous, imprinting effect. This is especially a problem,
when the numb er of males in the F
1
-generation is low,
as in this study. The assumptions of model (4) and the
pitfalls regarding imprinting effects do also hold in
model (3). The additive effects were e stimated depend-
ing on their parental origin, and if the F
1
-sires are not
heterozygous at t he QTL the estimates of the additive
effects might differ depending on their parental o rigin,
resulting in a significant imprinting effect. Hence, some
cautions have to be made when drawing specific conclu-
sions regarding the imprinting effects, especially for the
imprinted QTL with an inconsistent mode of imprinting
(Table 6). In some cases, imprinting effects might be
spurious and due to within-founder breed segregation of
QTL. Besides, the importance of imprinting for these
traits has also been reported on a polygen ic level within
purebred pigs by Neugebauer et al. [25]. In addition, the
same mode of imprinting in different founder alleles
(Table 6) can be seen as evidence for real imprinting
effects for these QTL.
Experimental design and methods
When QTL experiments are analysed jointly, several
requirements have to be fulfilled. Ideally, identical or to
a large extent identical markers have to be genotyped in
the designs and the allele coding has to be standardised.
Subsequently, a common genetic map has to be estab-
lished. Trait definition and measurement have to be
standardised and, ideally, housing and rearing conditions
of the animals should be the same or si milar. All these
points were fulfilled in the present study, since to a
large extent the same markers were used, all animals
were housed and slaughtered at one central unit and
phenotypes were recorded by the same technical staff.
Furthermore, due to the connectedness of the three
designs, the situation for a combined analysis is espe-
cially favourable and allowed the use of model (3). Com-
pared to a separate analysis, fewer parameters are
estimated (i.e. seven instead of nine). Additionally the
number of meioses used simultaneously was roughly
three times hig her. This led to the high statistical power
of the joint design, which is confirmed by the large
number of mapped QTL and by the reduced width of
the confidence intervals. The high experimental power
is probably due t o the fact that not only the same foun-
der breed s were used, but also to some extent the same
founder animals within breeds. Hence the same founder
alleles could be observed in the individuals of two F
2
-
crosses, which increased the n umber of observations to
estimate the effects. This is especially the case for the
WxM and WxP crosses, which both go back to one and
same W boar.
Model (3) was adapted from Liu and Zeng [10] but
was extended for imprinting effe cts. Modelling imprint-
ing seemed to be important for these traits. Ignoring
imprinting resulted in a reduced number of mapped
QTL for all three traits. Besides, all purely mendelian
QTL (i.e. non-significant imprinting) were also found
when imprinting wa s modelled. Hence, estimating two
additional parameters in order to model imprinting
obviously did not reduce the power to map purely
Table 6 Additive QTL effects and mode of imprinting for QTL showing significant imprinting effects: results from the
joint design
Trait SSC Pos.
â
M
p
*
â
M
m
â
P
p
â
P
m
â
W
p
â
W
m
Mode
Back
fat
depth
2131.30 (0.65) 0.10 (0.65) -1.18 (1.00) 0.75 (1.03) -0.12 (1.61) -0.85 (1.65) nc
783-1.28 (0.64) -3.30 (0.67) -0.002 (0.99) -2.97 (1.05) 1.28 (1.59) 5.26 (1.67) pat
17 74 2.42 (0.67) -0.41 (0.70) 3.31 (1.11) -1.33 (1.19) -5.72 (1.74) 1.73 (1.85) mat
Daily
gain
358-24.99 (9.52) 10.69 (9.20) -4.67 (18.27) 35.03 (16.05) 29.66 (26.62) -45.72 (24.19) nc
5 128 -30.74 (9.77) 15.29 (10.17) -28.06 (16.38) -2.62 (16.92) 58.80 (25.07) -12.67 (25.92) mat
7 42 3.98 (9.42) 34.75 (10.14) 19.17 (15.65) 26.04 (16.81) -23.15 (23.61) -60.79 (25.47) pat
8 8 16.73 (10.51) -7.26 (10.82) 71.24 (17.96) 3.81 (18.63) -87.97 (27.2) 3.45 (28.01) mat
Carcass
weight
1896.08 (1.36) 3.22 (1.30) 10.41 (2.33) 10.12 (2.23) -16.49 (3.55) -13.33 (3.40) mat
5 120 -3.76 (0.97) 0.01 (0.99) -4.36 (1.66) -2.10 (1.69) 8.12 (2.53) 2.09 (2.57) mat
7 36 1.07 (1.52) 2.31 (1.51) 5.79 (2.75) 1.22 (2.66) -6.86 (4.04) -3.54 (4.01) nc
10 59 2.47 (1.09) -2.20 (1.21) 4.59 (1.90) -4.01 (2.07) -7.06 (2.87) 6.21 (3.17) mat
16 0 2.90 (1.05) -1.70 (1.10) 6.31 (1.78) -3.42 (1.84) -9.21 (2.72) 5.11 (2.82) mat
Significant additive effects are writte n in bold face; standard errors are given in parenthesis;
*upper subscript denotes parental origin (paternal or maternal derived) and lower subscript denotes breed (M, P or W); mat = maternal, pat = paternal, nc = not
consistent.
Rückert and Bennewitz Genetics Selection Evolution 2010, 42:40
/>Page 8 of 12
Figure 1 LOD-score profiles for back fat depth on chromosome 1 (top) and on chromosome 2 (bottom). The solid black line denotes the
results from the joint analysis; the dashed gray (small dotted, black dashed) line denotes the results of the MxP (WxP, WxM) analysis; the genetic
map is given in the additional files.
Rückert and Bennewitz Genetics Selection Evolution 2010, 42:40
/>Page 9 of 12
mendelian QTL, favouring the model with imprinting.
Thereby it was important to account for heterogeneous
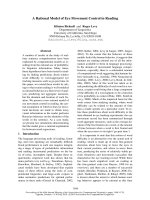
residual variances. A substantial heterogene ity w as
expected given the variation of the phenotypes within
and across the three crosses (Table 1) and could be due
to the different number of QTL segregating in the three
crosses. Following this, it could be assumed that the het-
erogeneity would be reduced if more QTL were added
as cofactors in the model. In Figure 2, the plots of the
residual variances are shown for the three crosses and
different number of QTL included in the model. It can
be seen that the residual variances decreased and the
differences became smaller, but did not disappear. One
reason for this could be that there are still many more
QTL segregating, which were not detected because their
effects are too small. Indeed, Bennewitz and Meuwissen
[26] have used QTL results from a separate analysis of
the same three crosses to derive the distribution of QTL
effects. They have shown that the additive QTL e ffects
are exponentially distribu ted with many QTL of small
effects. Model (3) was also flexible with regard to the
number of QTL alleles, which was important given the
large number of QTL with three different breed allele
effects (Tables 2, 3, and 4).
Figure 2 also shows the benefit of including multiple
QTL as cofactors in the model. The residual variances
reduced continuously, which led to the increased statis-
tical power and subsequently contributed to mapping
the large number of QTL. The inclusion of QTL as
cofactors is also known as composite interval mapping
(CIM) and goes back to Zeng [27,28] and Jansen and
Stam [29]. There are basically two main reasons for
applying CIM. The first is to decrease residual variance
and increase statistica l power, as also used in this study.
The second is to unravel a chromosomal position har-
bouring a QTL more precisely, i.e. to separate multiple
closely linked QTL. This also requires scanning the
chromosomal region of QTL identified in previous
rounds of co factor selection (in our study also rescan-
ning confidence intervals of identified QTL), which,
however, requires dense markers in those regions.
Because marker density was not very high in this study,
no attempts were made to detect multiple QTL within a
QTL confidence interval. Low marker density should
also be kept in mind when interpreting multiple QTL
on single c hromosomes, because the amount of infor-
mation to separate them is limited.
The high statistical power is also due to the defined
relative low significance level (i.e. 5% chromosome-
wise). Hence, correction for multiple testing was done
only for chromosomes or chromosome-segments and
not for the whole genome or even for the whole experi-
ment considering all three traits. The low significance
level was chosen because a large number of QTL with
small effects are segregating in this design [26], and
many QTL with small effects would not have been
found using a more stringent significance level. The
downside of this strategy is, of course, that some
mapped QTL will be false positives. The applied meth-
ods were computationally fast, mainly because of the
applied regression approach, but also because the quick
method was used [15] for the significance threshold
determination rather than applying the permutation test.
Piepho [15] has shown that this method is a good
approximation if the data are normally distributed,
which was the case in this study (not shown). Alterna-
tively, a permutation test could have been used, which
would result in more accurate threshold values and, as
proposed by Rowe et al. [30,31], also for a more sophis-
ticated identification of dominance and imprinting
effects. This should be considered in putative follow-up
studies.
Conclusions
The present study showed the strength of analysing
three connected F
2
-crosses jointly to map numerous
QTL. The high statistical power of the experiment was
due to the reduced number of estimated parameters and
to the l arge number of individuals. The applied model
was flexible with regard to the number of QTL and
QTL allel es, mode of QTL inheritance, and was compu-
tationally fast. It will be applied to other traits and
needs to be expanded to account for epistasis.
Appendix
As stated in the main text, the restriction shown in eq
(1) resulted in a re-parameterisation of the genetic
model presented in eq (2). The re-parameterised model
is as follows.
g
g
g
g
g
g
g
g
g
MM
pm
PP
pm
WW
pm
MP
pm
PM
pm
MW
pm
WM
pm
WP
pm
PW
pm
⎡
⎣
⎢
⎢
⎢
⎢
⎢
⎢
⎢
⎢
⎢
⎢
⎢
⎢⎢
⎢
⎢
⎢
⎤
⎦
⎥
⎥
⎥
⎥
⎥
⎥
⎥
⎥
⎥
⎥
⎥
⎥
⎥
⎥
⎥
=
−−−−
1100000
0011000
1111000
1001100
01100100
1101010
11 10010
10 11001
0111001
−−
−−
−−
−−
⎡
⎣
⎢
⎢
⎢
⎢
⎢
⎢
⎢
⎢
⎢
⎢
⎢
⎢
⎤
⎦
⎥
⎥⎥
⎥
⎥
⎥
⎥
⎥
⎥
⎥
⎥
⎥
⎥
⎡
⎣
⎢
⎢
⎢
⎢
⎢
⎢
⎢
⎢
⎢
⎢
⎤
⎦
⎥
⎥
⎥
⎥
⎥
⎥
⎥
⎥
⎥
⎥
+
a
a
a
a
d
d
d
i
p
i
m
j
p
j
m
MP
MW
PW
⎡
⎣
⎢
⎢
⎢
⎢
⎢
⎢
⎢
⎢
⎢
⎢
⎢
⎢
⎤
⎦
⎥
⎥
⎥
⎥
⎥
⎥
⎥
⎥
⎥
⎥
⎥
⎥
The upper subscripts denote or the parental origin
(i.e. either paternal (p) or m aternal (m)) and the lower
subscripts denote the breed origin M, P, and W. This
model contained only four additive effects (two paternal
and two maternal). Using the above notation,
ˆˆ
aa
M
p
i
p
=
,
ˆˆ
aa
P
p
j
p
=
and
ˆ
(
ˆˆ
)aaa
W
p
i
p
j
p
=− +
.Thesameholdsforthe
maternal alleles. The applied regression model (eq (3) in
Rückert and Bennewitz Genetics Selection Evolution 2010, 42:40
/>Page 10 of 12
the main text) estimated the four additive effects for th e
breeds M and P. The two effects for W not modelled
were reconstructed, as shown above.
Additional material
Additional file 1: Genetic map (marker name and distance from the
start of the chromosome). The genetic map, including the marker
names and the distance from the start of the chromosome.
Acknowledgements
CR received funding from the H. Wilhelm Schaumann Stiftung, Hamburg,
Germany. Both authors thank H P. Piepho from the University of Hohenheim
for helpful discussions and carefully reading of the manuscript, N. Reinsch
from the Research Institute of Farm Animal Biology in Dummerstorf,
Germany, for the use of his Fortran program Bigmap, and C. Baes for
language corrections. The manu script has benefited from the critical and
very helpful comments of two anonymous reviewers and of the editor.
Authors’ contributions
CR did the statistical analysis and JB developed the models. Both authors
drafted the manuscript. Both authors read and approved the final
manuscript.
Competing interests
The authors declare that they have no competing interests.
Received: 23 June 2010 Accepted: 1 November 2010
Published: 1 November 2010
References
1. Hu ZL, Dracheva S, Jang W, Maglott D, Bastiaansen J, Rothschild MF,
Reecy JM: A QTL resource and comparison tool for pigs: PigQTLDB.
Mamm Genome 2005, 15:792-800.
2. Bennewitz J, Reinsch N, Grohs C, Levéziel H, Malafosse A, Thomsen H, Xu N,
LooftC,KühnC,BrockmannGA,SchwerinM,WeinmannC,HiendlederS,
Erhardt G, Medjugorac I, Russ I, Förster M, Brenig B, Reinhardt F, Reents R,
Averdunk G, Blümel J, Bolchard D, Kalm E: Combined analysis of data from
two granddaughter designs: A simple strategy for QTL confirmation and
increasing experimental power in dairy cattle. Genet Sel Evol 2003, 35:319-338.
3. Walling GA, Visscher PM, Andersson L, Rothschild MF, Wang L, Moser G,
Groenen MAM, Bidanel J P, Cepica S, Archibald AL, Geldermann H, De
Koning DJ, Milan D, Haley CS: Combined analyses of data from
quantitative trait loci mapping studies: Chromosome 4 effects on
porcine growth and fatness. Genetics 2000, 155:1369-1378.
4. Haley CS, Knott SA, Elsen JM: Mapping quantitative trait loci in crosses
between outbred lines using least squares. Genetics 1994, 136:1195-1207.
5. Kim JJ, Rothschild MF, Beever J, Rodriguez-Zas S, Dekkers JCM: Joint
analysis of two breed cross populations in pigs to improve detection
and characterization of quantitative trait loci. J Anim Sci 2005,
83:1229-1240.
6. Pérez-Enciso M, Mercadé A, Bidanel JP, Geldermann H, Cepica S,
Bartenschlager H, Varona L, Milan D, Folch JM: Large-scale, multibreed,
multitrait analyses of quantitative trait loci experiments: The case of
porcine X chromosome. J Anim Sci 2005, 83:2289-2296.
7. Li R, Lyons MA, Wittenburg H, Paigen B, Churchill GA: Combining data
from multiple inbred line crosses improves the power and resolution of
quantitative trait loci mapping. Genetics 2005, 169:1699-1709.
8. Jansen RC, Jannink JL, Beavis WD: Mapping quantitative trait loci in plant
breeding populations: Use of parental haplotype sharing. Crop Science
2003, 43:829-834.
9. Geldermann H, Müller E, Moser G, Reiner G, Bartenschlager H, Cepica S,
Stratil A, Kuryl J, Moran C, Danoli R, Brunsch C: Genome-wide linkage and
QTL mapping in porcine F
2
families generated from Pietrain, Meishan
and Wild boar crosses. J Anim Breed Genet 2003, 120:363-393.
10. Liu Y, Zeng ZB: A general mixture model approach for mapping QTL
from diverse cross designs involving multiple inbred lines. Genet Res
2000, 75:345-355.
11. Müller E, Moser G, Bartenschlager H, Geldermann H: Trait values of growth,
carcass and meat quality in Wild Boar, Meishan and Pietrain pigs as well
as their crossbred generations. J Anim Breed Genet 2000, 117:189-202.
Var
15
20
25
30
35
40
45
50
55
60
65
70
Number of QTL detected
12345678910111213141516
back fat depth
Var
5000
6000
7000
8000
9000
10000
11000
12000
13000
14000
15000
16000
17000
18000
Number of QTL detected
1 2 3 4 5 6 7 8 9 10 11 12 13 14 15 16
daily gain
Var
70
80
90
100
110
120
130
140
150
160
170
180
190
200
Number of QTL detected
1 2 3 4 5 6 7 8 9 10111213141516
carcass weight
Figure 2 Residual variance plotted against the number of QT L
included in the model. Solid line (dotted line, dashed line)
denotes the MxP cross (WxP cross, WxM cross).
Rückert and Bennewitz Genetics Selection Evolution 2010, 42:40
/>Page 11 of 12
12. Green P, Falls K, Crooks S: Documentation for CRIMAP (Version 2.4).
Washington University, School of Medicine, St. Louis; 1990.
13. Reinsch N: A multiple-species, multiple-project database for genotypes at
codominant loci. J Anim Breed Genet 1999, 116:425-435.
14. Mantey C, Brockmann GA, Kalm E, Reinsch N: Mapping and exclusion
mapping of genomic imprinting effects in mouse F
2
families. J Heredity
2005, 96:329-338.
15. Piepho HP: A quick method for computing approximate threshold for
quantitative trait loci detection. Genetics 2001, 157:425-432.
16. Lynch M, Walsh B: Genetics and Analysis of Quantitative Traits. Sinauer
Associates, INC; 1998.
17. Visscher PM, Thompson R, Haley CS: Confidence intervals in QTL mapping
by bootstrapping. Genetics 1996, 143:1013-1020.
18. De Koning DJ, Schulman NF, Elo K, Moisio S, Kinos R, Vilkki J, Maki-Tanila A:
Mapping of multiple quantitative trait loci by simple regression in half-
sib designs. J Anim Sci 2001, 79:616-622.
19. Göring HHH, Terwilliger JD, Blangero J: Large upward bias in estimation of
locus-specific effects from genomewide scans. Am J Hum Genet 2001,
69:1357-1369.
20. de Koning DJ, Rattink AP, Harlizius B, van Arendonk JAM, Brascamp EW,
Groenen MAM: Genome-wide scan for body composition in pigs reveals
important role of imprinting. Proc Natl Acad Sci USA 2000, 97:7947-7950.
21. Nezer C, Moreau L, Brouwers B, Coppieters W, Detillieux J, Hanset R,
Karim L, Kvasz A, Leroy P, Georges M: An imprinted QTL with major effect
on muscle mass and fat deposition maps to the IGF2 locus in pigs. Nat
Genet 1999, 21:155-156.
22. Van Laere AS, Nguyen M, Braunschweig M, Neze C, Collette C, Moreau L,
Archibald AL, Haley CS, Buys N, Tally M, Andersson G, Georges M,
Andersson L: A regulatory mutation in IGF2 causes a major QTL effect on
muscle growth in the pig. Nature 2003, 425:832-836.
23. Sandor C, Georges M: On the detection of imprinted quantitative trait
loci in line crosses: Effect of linkage disequilibrium. Genetics 2008,
180:1167-1175.
24. de Koning DJ, Bovenhuis H, van Arendonk JAM: On the detection of
imprinted quantitative trait loci in experimental crosses of outbred
species. Genetics 2002, 161:931-938.
25. Neugebauer N, Luther H, Reinsch N: Parent-of-origin effects cause genetic
variation in pig performance traits. Animal 2010, 4:672-681.
26. Bennewitz J, Meuwissen THE: The distribution of QTL additive and
dominance effects in porcine F2 crosses. J Anim Breed Genet 2010,
127:171-179.
27. Zeng ZB: Theoretical basis for separation of multiple linked gene effects
in mapping quantitative trait loci. Proc Nat Acad Sci USA 1993,
90:10972-10976.
28. Zeng ZB:
Precision mapping of quantitative trait loci. Genetics 1994,
136:1457-1468.
29. Jansen RC, Stam P: High resolution of quantitative traits into multiple loci
via interval Mapping. Genetics 1994, 136:1447-1455.
30. Rowe SJ, Pong-Wong R, Haley CH, Knott SA, de Koning DJ: Detecting
dominant QTL with variance component analysis in simulated
pedigrees. Genet Res 2008, 90:363-374.
31. Rowe SJ, Pong-Wong R, Haley CH, Knott SA, de Koning DJ: Detecting
parent of origin and dominant QTL in a two-generation commercial
poultry pedigree using variance component methodology. Genet Sel Evol
2009, 41:6.
doi:10.1186/1297-9686-42-40
Cite this article as: Rückert and Bennewitz: Joint QTL analysis of three
connected F
2
-crosses in pigs. Genetics Selection Evolution 2010 42:40.
Submit your next manuscript to BioMed Central
and take full advantage of:
• Convenient online submission
• Thorough peer review
• No space constraints or color figure charges
• Immediate publication on acceptance
• Inclusion in PubMed, CAS, Scopus and Google Scholar
• Research which is freely available for redistribution
Submit your manuscript at
www.biomedcentral.com/submit
Rückert and Bennewitz Genetics Selection Evolution 2010, 42:40
/>Page 12 of 12