Báo cáo sinh học: "Breeding value prediction for production traits in layer chickens using pedigree or genomic relationships in a reduced animal model" docx
Bạn đang xem bản rút gọn của tài liệu. Xem và tải ngay bản đầy đủ của tài liệu tại đây (354.45 KB, 9 trang )
RESEARCH Open Access
Breeding value prediction for production traits
in layer chickens using pedigree or genomic
relationships in a reduced animal model
Anna Wolc
1,2*
, Chris Stricker
3
, Jesus Arango
4
, Petek Settar
4
, Janet E Fulton
4
, Neil P O’Sullivan
4
, Rudolf Preisinger
5
,
David Habier
2
, Rohan Fernando
2
, Dorian J Garrick
2
, Susan J Lamont
2
, Jack CM Dekkers
2
Abstract
Background: Genomic selection involves breeding value estimation of selection candidates based on high-density
SNP genotypes. To quantify the potential benefit of genomic selection, accuracies of estimated breeding values
(EBV) obtained with different methods using pedigr ee or high-density SNP genotypes were evaluated and
compared in a commercial layer chicken breeding line.
Methods: The following traits were analyzed: egg production, egg weight, egg color, shell strength, age at sexual
maturity, body weight, albumen height, and yolk weight. Predictions appropriate for early or late selection were
compared. A total of 2,708 birds were genotyped for 23,356 segregating SNP, including 1,563 females with records.
Phenotypes on relatives without genotypes were incorporated in the analysis (in total 13,049 production records).
The data were analyzed with a Reduced Animal Model using a relationship matrix based on pedigree data or on
marker genotypes and with a Bayesian method using model averaging. Using a validation set that consisted of
individuals from the generation following training, these methods were compared by correlating EBV with
phenotypes corrected for fixed effects, selecting the top 30 individuals based on EBV and evaluating their mean
phenotype, and by regressing phenotypes on EBV.
Results: Using high-density SNP genotypes increased accuracies of EBV up to two-fold for selection at an early age
and by up to 88% for selection at a later age. Accuracy increases at an early age can be mostly attributed to
improved estimates of parental EBV for shell quality and egg production, while for other egg quality traits it is
mostly due to improved estimates of Mendelian sampling effects. A relatively small number of markers was
sufficient to explain most of the genetic variation for egg weight and body weight.
Background
During the first decade of the 21st century, ther e has
been a rapid development of genomic selection tools.
Through the application of genomic selection [1], mar-
ker information from high-density SNP genotyping can
increase prediction accuracies at a young age, shorten
generation intervals and impr ove control of inbreeding
[2], which should lead to higher genetic gain per year.
Many simulation studies have shown the benefits of this
technology, depending on heritability, number and dis-
tribution of effects of QTL, population st ructure, size of
training data set used to estimate SNP effects, and other
factors [3]. However, studies on real data are still scarce.
If practical application of genomic selection is to be
implemented in chicken breeding, as already done for
dairy cattle [4], it must prove its advantage over tradi-
tional methods and be used in a way that maximizes
the use of available information. The accuracy of EBV
derived from large numbers of markers for within-breed
selection is difficult to evaluate analytically and must be
validated by correlating predictions to phenotype in the
target population (usually the generation following
training).
One of the challenges in genomic prediction of breed-
ing values is that not all phenotyped individuals are
genotyped. One approach to exploit all available
* Correspondence:
1
Department of Genetics and Animal Breeding, University of Life Sciences in
Poznan, Wołyńska st. 33, 60-637 Poznan, Poland
Full list of author information is available at the end of the article
Wolc et al. Genetics Selection Evolution 2011, 43:5
/>Genetics
Selection
Evolution
© 2011 Wolc et al; licensee BioMed Central Ltd. This is an Open Access article distributed under the terms of the Creative Commons
Attribution License ( licenses/by/2.0), which permits unrestricted use, distribution, and reproduction in
any med ium, provided the original work i s properly cited.
information is to first estimate breeding value s of geno-
typed individuals by pedigree-based methods using all
data, including phenotypes on non-genotyped relatives,
and then use deregressed estimates of those EBV for
marker-based analyses [5,6]. This two-step approach
may, however, result in suboptimal use of information.
Another recently developed method uses a combined
pedigree and genomic covariance matrix, which can
inco rporat e both genotyped and non-genotyped animals
[7,8]. However, these methods are computationally
demanding and require careful scaling of the genomic
relationship matrix to be consistent with the pedigree-
based relationship matrix.
The reduced animal model was proposed by Quaas
and Pollak [9] to make breeding value prediction under
the animal model less computationally demanding. It
fits the full relationship matrix for parents and absorbs
the equations for non-parents. Nowadays, the d evelop-
ment of powerful computers makes the reduction of
computing cost less relevant for pedigree-based analyses
but the reduced model can also be used to exploit mar-
ker-based relationships. In breeding programs using
marker information, individuals that have been used for
breeding (i.e. parents) are more likely to be genotyped
than unselected non-parents. Estimating breeding values
for genotyped animals and absorbing non-genotyped
progeny into their equations can make full use o f all
available data. With this approach, t here is no need to
construct the inverse of the combined pedigree and
genomic covariance matrix of Legarra et al. [7].
The objectives of this study were to implement a
reduced animal model to estimate breeding values using
high-density SNP genotypes, to evaluate the accuracy of
breed ing values estimated using hi gh-density SNP geno-
types in the generation following training in a layer
breeding line, and to compare the accuracy of altern a-
tive methods of breeding value estimation.
Methods
Data
Data on nine traits collected during the first 22 weeks of
production were recorded on 13,049 birds from five con-
secutive generatio ns in a single brown-egg layer line: egg
production (ePD, percent hen average); age at sexual
maturity (eSM, d); weight of the first three eggs laid by the
hen (eE3, g) and shell color ( eC3) collected from same
eggs by Chroma Meter that measures lightness (L) and
hue (as a function of a red-green (a) and a yellow-blue (b)
scale). A second set of egg quality traits collected at 26-28
weeks (early, e) included average weight of eggs (e EW,g);
egg color (eCO) eggs; shell quality measured as puncture
score - a n on-invasive deformation test averaged over
points of the shell (ePS, Newton); albumen height (eAH,
mm); and yolk weight (eYW, g). For birds selected on the
basis of early (e) trait data, also late (l) production (42-46
weeks of age) traits were recorded: body weigh t (lBW, g);
egg production (lPD, percent hen average); puncture score
(lPS, Newton); egg weight (lEW, g); albumen height (lAH,
mm); egg color (lCO, Lab); and yolk weight (lYW, g).
Early and late egg quality measurements were averages of
records on three to five eggs . In total 2,708 animals were
genotyped for 23,356 segregating SNP (minor allele fre-
quency >0.025; maximum proportion of missing genotypes
<0.05; maximum mismatch rate between parent-offspring
pairs <0.05; parentage probability >0.95), using a custom
high-density Illumina SNP panel. Of the genotyped ani-
mals, 1,563 we re females with individual phenotypes and
1,145 were males without phenotypes. The genotyped set
included sires and dams used for breeding in generations 1
to 5 and some progeny from generation 5. Breeding values
were estimated for two stages of selection. To represent
selection at a very young age, when own performances and
phenotypes on female sibs were not yet available, training
used all phenotypic data excluding generation 5, and vali-
dation was performed on 290 genotyped female individuals
from generation 5. To represent selection of males at a
later age, when phenotypes on female sibs are available,
phenotypes of 2,167 non-genotyped hens from generation
5 were added to the training data but validation individuals
were unchanged. A basic description of these data is given
in Table 1.
Statistical analysis
Because of the data structure, a reduced animal model
was applied with all parents genotyped and many non-
genotyped non-parent progeny with phenotypes. In this
approach, a distinction is made between genotyped indi-
viduals, including all parents, for which the full relation-
ship matrix is fitted, and non-genotyped non-parent
individuals. The following model was applied, following
White et al. [10]:
y Xb P QS QD a e=++ + +()
1
2
1
2
where
y is the (N x1) vector of observations,
b is the (25 × 1) vector of generation-hatch-line fixed
effects,
X is the ( Nx25) incidence matrix for fixed effects,
a is t he (px1) vector of breeding values of genotyped
individuals, with variance-covariance matrix G
a
2
,
P is t he (N × p) matrix with element ij =1iftheith
observation is on genotyped individual j, zero otherwise,
Wolc et al. Genetics Selection Evolution 2011, 43:5
/>Page 2 of 9
Q is an (N × N) diagonal matrix with element ii =1if
observation i is on a non-genotyped individual, zero
otherwise,
S and D are (N × p) incidence matrices with elements
in rows for non-genotyped individuals that correspond
to the columns identifying sires and dams set to 1, and
zero’s elsewhere.
e is the (Nx1) vector of random errors which has v ar-
iance
e
2
for observation s on genotyped individuals and
ea
22
1
2
+
for observations on non-genotyped indivi-
duals, ignoring the effect of parental inbreeding on
Mendelian sampling variance in progeny.
Population size and avoiding the mating of close rela-
tives insured low inbreeding in this population. Further-
more, variance component estimates from a full animal
model and the reduced animal model described above,
using pedigree relationships, were very close. Thus,
ignoring the effect of parental inbreeding on Mendelian
sampling variance in proge ny is ex pected to have a neg-
ligible impact on results.
Three models were used to predict breeding values of
individuals in generation 5:
1) PBLUP - Reduced animal model using pedigree
relationships.
2) GBLUP - Reduced animal model using marker-
based relationships for genotyped birds, with covar-
iance matrix derived by the method of VanRaden
[11], using allele frequencies based on all genotyped
animals.
3) Bayes-C-π - A genomic prediction me thod similar
to Bayes-B of Meuwissen et al. [1], except for the
estimation of the proportion of SNP with zero
effects (π) and assuming a common variance for all
fitted SNP, with a scaled inverse chi-square prior
with ν
a
degrees of freedom and scale parameter
S
a
2
,
as described by Habier et al. [12]. The prior for π
was uniform (0,1). The chain length was 160,000
iterations, with the first 50,000 excluded as the burn
in period. In this analysis, the averag e genotype
(number of ‘B’ vs. ‘A’ alleles) of the genotyped par-
ents was used to fit SNP genotype effects to the pre-
adjusted mean performance of their non-genotyped
progeny. To account for different residual variances
for progeny means, re sidual variances were scaled
using weights der ived from
w
h
hp
p
=
−
−
1
105
2
2
(.)/
,
where p is the number of phenotypes included in
the mean [5].
Allmodelsincludedthefixedeffectofhatchwithin
generation, either fitting it in the model (for PBLUP and
GBLUP) or pre-adjusting the data by subtracting solu-
tions f rom a single trait a nimal model that included all
observat ions and pedigree relationships (for Bayes-C-π).
The PBLUP and GBLUP analyses were performed using
Table 1 Description of the population in terms of the number, mean and standard deviation of phenotypes by trait
and generation
Generation ePD eEW ePS eAH eCO eE3 eC3 eYW eSM lBW lPD lEW lPS lAH lCO lYW
N 2,738 2,737 2,738 2,737 2,738 2,729 2,729 2,728 2,738 647 635 649 649 649 649 646
G1Training Mean 80.93 56.81 1425 7.06 73.33 43.64 74.56 15.19 149.30 1.96 77.25 61.46 1,435 6.56 72.38 17.80
Std 11.28 4.60 38.38 0.95 7.74 4.54 7.92 1.12 7.42 0.25 12.07 4.60 24.96 0.87 7.64 1.21
N 2,772 2,772 2,770 2,771 2,771 2,752 2,753 2,736 2,772 793 784 794 794 794 794 793
G2Training Mean 82.39 57.48 1388 7.50 71.37 46.72 74.41 15.12 156.34 1.97 80.55 62.22 1,400 7.21 66.87 17.78
Std 11.30 4.76 39.88 1.02 8.19 5.13 7.68 1.13 9.89 0.23 12.11 4.50 40.60 0.91 9.28 1.31
N 2,965 2,964 2,964 2,963 2,964 2,951 2,952 2,958 2,964 781 778 782 782 782 782 781
G3Training Mean 84.85 57.92 1495 7.41 76.11 47.33 75.43 15.31 159.81 1.95 82.36 63.52 1,509 7.19 72.89 18.14
Std 9.77 4.85 42.52 1.03 7.52 4.64 7.85 1.15 6.21 0.25 11.00 4.66 36.38 0.90 7.90 1.35
N 2,117 2,117 2,115 2,116 2,117 2,103 2,103 2,115 2,117 759 755 768 769 769 769 768
G4Training Mean 83.32 57.20 1460 7.37 77.15 45.22 78.10 15.10 147.57 1.77 80.02 62.65 1,496 6.87 70.93 18.09
Std 10.28 4.92 42.79 0.98 7.72 4.74 7.86 1.23 7.82 0.27 11.02 4.77 36.61 0.94 8.59 1.38
N 2,167 2,167 2,164 2,167 2,167 2,157 2,158 2,164 2,167 768 769 772 772 771 772 769
G5Training Mean 85.99 58.59 1486 8.06 78.70 47.38 79.38 15.20 155.33 1.81 82.90 62.66 1,477 7.65 72.71 17.88
Std 9.55 4.93 46.84 1.01 8.16 4.96 7.59 1.20 8.80 0.25 10.01 4.67 36.53 0.89 9.08 1.41
N 290 290 289 290 290 278 278 290 290 277 274 280 280 280 280 275
G5Validation Mean 83.09 59.17 1,493 7.70 78.06 45.02 80.19 15.38 148.89 1.80 77.38 63.31 1,488 7.47 71.55 17.92
Std 9.20 4.78 41.74 1.09 7.29 4.53 7.56 1.10 7.84 0.27 11.70 4.93 35.01 0.93 8.58 1.38
Early (e) traits recorded at 26-28 weeks of life: egg production (ePD); age at sexual maturity (eSM); shell quality (ePS); weight of first 3 eggs (eE3); color of first 3
eggs (eC3); egg weight (eEW); albumen height (eAH); egg color (eCO); and yolk weight (eYW); late (l) traits recorded at 42-46 weeks: body weight (lBW); egg
production (lPD); egg weight (lEW ); albumen height (lAH); egg color (lCO); and yolk weight (lYW).
Wolc et al. Genetics Selection Evolution 2011, 43:5
/>Page 3 of 9
ASREML [13] and Bayes-C-π using GenSel [12]. The
correlation between EBV with hatch-corrected pheno-
type (as described above) in the validation data sets
divided b y square root of heritability and regression of
hatch-corrected phenotype on EBV were use d as mea-
sures of accuracy and bias of EBV, respectively. Another
comparison of methods was based on selecting the top
30 individuals from the 290 available for validation
based on EBV for each trait and comparing the average
hatch-corrected phenotype of the selected individuals.
Marker based parental average (PA) EBV were also cal-
culated for animals in the validation sets to eval uate the
extent to which improvements in accuracy with u se of
markers resulted from more accurate estimates of
Mendelian sampling terms versus more accurate EBV of
the parents. This was possible in this population because
parent s of b oth sexes were genotyped. To check if com-
bining marker-based estimates with PA increases
accuracies of estimates, as suggested by VanRaden et al.
[6] for dairy cattle, linear regression of pre-adjusted phe-
notypes on PA and genomic EBV was performed; if
GEBV capture all pedigree information, then adding PA
to the regression model is not expected to increase the
ability to predict phenotype in validation animals.
Results and discussion
Estimates of heritability from single-tr ait pedigree-based
animal models fitted to the whole data set are shown in
Table 2. Est imates were low to moderate for prod uction
and shell quality and moderate to high for all other egg
quality traits, as expected. E stimates of heritability for
early traits were higher than for the corresponding late
traits. Variance components for the late traits may be
biased because only selected birds had the opportunity
to obtain phenotypes for these traits.
Accuracy of marker-based EBV
Marker-based EBV had, in general, a higher predictive
ability than estimates using pedigree relationships
(Figures 1 and 2) for all traits and for early and late
selection scenarios. The advantage of GBLUP over
PBLUP is due to the fact that realized marker-based
genetic similarity between animals deviate from pedi-
gree-based relationship coefficients. In addition, marke r-
based EBV are not affected by pedigree errors, although
they are affected by genotyping errors and errors in
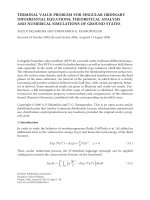
DNA sample identification. As shown i n Figure 3, mar-
ker-based relationships varied substantially arou nd pedi-
gree relationships. The regression of marker-based on
pedigree-based relationships was 0.88 for all individuals
and 0.97 for validati on individuals, demonstrating on
average go od agreement between both types of relation-
ships. The correlation between the two relationship
measures was 0.68 and 0.72 for all and validation indivi-
duals, respectively.
The difference in accuracy between GBLUP and
PBLUP was smaller for selection at a later age than at
an early age, when data on sibs of selection candidates
were available (Figures 1 and 2). This extra information
increased the accuracy of all methods and particularly of
PBLUP. Using marker-b ased relationships increa sed
accuracies up to over tw o-fold for early selection and by
up to 88% fo r late selectio n. Proportionally, the highest
gain in accuracy was achieved for traits with the lowest
heritability. Accuracies obtained with GBLUP were on
average slightly larger than those with Bayes-C-π.Sev-
eral simulation studies have shown that the accuracy of
Bayesian methods is higher than that of GBLUP
[1,14,15] but a simulation study reported by Daetwyler
et al. [ 16] has sho wn that the relative performance of
GBLUP depen ds to a large extent on the genetic archi-
tecture of the trait. Also, studies on real data in dairy
cattle have shown that GBLUP can be equally accurate
or even superior in prediction for traits for which no
individual QTL explains a large proportion of the varia-
tion [17,18].
Correlations for sele ction at an early age between EBV
obtained by PBLUP and GBLUP ranged from 0.48 to
0.70 across the traits; from 0.46 to 0.71 between
EBVfromPBLUPandBayes-C-π; and from 0.79 to
0.97 between EBV from GBLUP and Bayes-C-π.This
indicates t hat reranking of top individuals is very likely
between pedigree- and marker-based methods but lim-
ited between GBLUP and Bayes-C-π. This was con-
firmed by the average performance of the top 30
individuals selected with different m ethods (Table 3),
which was similar for m arker-based methods but some-
what different for the group selected based on pedigree
EBV. A similar tendency was observed for ranking at
Table 2 Estimates of heritability from single-trait
pedigree-based animal model analyses for early (e) traits
recorded at 26-28 weeks of life and for late (l) traits
recorded at 42-46 weeks
Early traits
Trait ePD eEW ePS eAH eCO eYW eE3 eC3
h
2
0.39 0.74 0.29 0.55 0.72 0.47 0.64 0.66
Late traits
Trait lPD lEW lPS lAH lCO lYW lBW eSM
h
2
0.26 0.67 0.25 0.52 0.67 0.50 0.48 0.55
1
Standard errors of heritability were between 0.02 and 0.03; early (e) traits
recorded at 26- 28 weeks of life: egg production (ePD); age at sexual maturity
(eSM); shell quality (ePS); weight of first 3 eggs (eE3); color of first 3 eggs
(eC3); egg weight (eEW); albumen height (eAH); egg color (eCO); and yolk
weight (eYW); late (l) traits recorded at 42-46 weeks: body weight (lBW); egg
production (lPD); egg weight (lEW); albumen height (lAH); egg color (lCO); and
yolk weight (lYW).
Wolc et al. Genetics Selection Evolution 2011, 43:5
/>Page 4 of 9
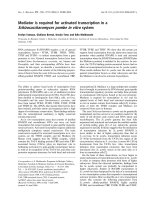
Figure 1 Accuracy of predicted breeding values and parental average (PA) breeding values from three methods: pedigree-based BLUP
(PBLUP), marker-based BLUP (GBLUP), and Bayesian variable selection prediction (Bayes-C-π) in the early selection scenario. Accuracy is
the correlation between predicted breeding values and hatch-corrected phenotype in the validation set divided by square root of heritability
from Table 2.
0
0.1
0.2
0.3
0.4
0.5
0.6
0.7
0.8
0.9
1
lPD ePD eSM ePS lPS eYW eAH eE3 lYW lBW lEW eEW eCO eC3 lCO lAH
PBLUP
GBLUP-PA
GBLUP
Bayes-C-ʋ-PA
Bayes-C-ʋ
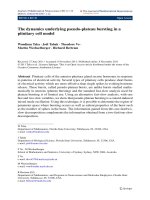
Figure 2 Accuracy of predicted breeding values and parental average (PA) breeding values from three methods: pedigree-based BLUP
(PBLUP), marker-based BLUP (GBLUP), and Bayesian variable selection prediction (Bayes-C-π) in the late selection scenario. Accuracy is
the correlation between predicted breeding values and hatch-corrected phenotype in the validation set divided by square root of heritability
from Table 2.
Wolc et al. Genetics Selection Evolution 2011, 43:5
/>Page 5 of 9
late selection but correlations between EBV from differ-
ent methods were higher for this scenario.
The presence of bias in EBV was evaluate d by regres-
sing phenotypes of validation individuals on their E BV.
On average, these regression coefficients tended to be
lower than the expected value of 1: 0.9 for PBLUP, 0.8
for GBLUP and 0.86 for Bayes-C-π, which sugg ests that
EBV overestimated differences in phenotypes of pro-
geny . This bias m ay be due to selection not being prop-
erly accounted for by the single-trait analyses or due to
the assumption of normality for genotypic values not
being valid. However, the mean squared deviation of the
regression coefficients from 1 was lowest for Bayes-C-π,
0.05, compared to 0.06 for PBLUP and 0.07 for GBLUP,
suggesting that estimates from Bayes-C- π were least
biased. Sib information tended to improve the pe rfor-
mance of all methods in this regard for most traits.
Estimation of π, the proportion of markers with zero
effects
The proportion of markers with zero effect (π )is
estimated from the data in the Bayes-C-π method.
Habier et al. [12] have shown that, if there is enough
information in the data, (1-
ˆ
)k is a good estimate of
the number of QTL affecting the trait when k unlinked
SNP with normally distributed effects were simulated
and genotypes used for training included genotypes at
the QTL. In the case of more realistic simulations,
where QTL genotypes were not included as markers but
the effects were estimated based on k linked markers,
the number of markers fitted was higher than the num-
beroftrueQTL,butthetendencyforlowerestimates
of π for scenarios with more QTL did hold [12].
The posterior means of π (Table 4) suggest that a high
proportion of markers should be included in the model
to explain a substantial part of the genetic variation for
the majority of traits in our data; estimates of π ranged
from 0.19 to 0.99, which suggests that between 111 and
19,541 markers explained variation for the analyzed traits
(Table 4). The large number of associated markers with
relative ly small effects explains the good performance of
GBLUP, which assumes a polygenic determination of
Figure 3 Pedigree and marker based relationships i n the
studied population.
Table 3 Validation of predicted breeding values and parental average (PA) breeding values from three methods:
pedigree-based BLUP (PBLUP), marker-based BLUP (GBLUP), and Bayesian variable selection prediction (Bayes-C-π),
for early and late selection
Method ePD eEW ePS eAH eCO eE3 eC3 eYW eSM
1
lBW
1
lPD lEW lPS lAH lCO lYW
EARLY SELECTION
Slope from regression of phenotype on EBV
PBLUP 0.63 1.12 0.71 0.87 0.93 0.88 0.85 0.70 0.56 1.06 0.52 1.05 0.56 1.16 1.03 0.88
GBLUP 0.53 0.87 0.58 0.93 0.70 0.81 0.67 0.58 0.34 1.07 0.54 0.73 0.61 1.05 0.93 0.82
Bayes-C-π 0.65 0.93 0.68 0.94 0.69 0.86 0.73 0.59 0.34 1.01 0.56 0.91 0.72 1.13 0.98 0.91
Average performance of top 30 individuals
PBLUP 89.9 61.0 1459.3 7.78 84.2 46.0 82.2 15.4 148.0 1.78 80.8 65.1 1453.3 7.29 76.5 18.1
GBLUP 90.3 63.5 1452.4 8.38 86.8 47.4 83.3 15.5 147.3 1.73 79.9 65.1 1440.9 7.22 80.0 18.3
Bayes-C-π 91.2 62.0 1453.7 8.41 85.9 48.3 83.4 15.4 147.2 1.70 78.1 64.7 1449.9 7.12 80.3 18.3
LATE SELECTION
Slope from regression of phenotype on EBV
PBLUP 1.08 0.90 0.51 1.13 0.93 0.85 1.07 0.80 0.90 1.12 0.47 1.04 0.46 1.29 0.95 0.97
GBLUP 0.72 0.85 0.50 1.06 0.82 0.83 0.81 0.72 0.60 1.10 0.54 0.83 0.60 1.06 0.91 0.89
Bayes-C-π 0.81 0.93 0.57 1.10 0.80 0.89 0.86 0.75 0.65 1.06 0.51 1.01 0.69 1.13 0.97 0.97
1
low values are desired.
Wolc et al. Genetics Selection Evolution 2011, 43:5
/>Page 6 of 9
traits. However , GBLUP also performed well for egg
weight and body weight, which had very high estimate s
of π . The results suggest that a limited number of
markers explain most of the genetic variation for body
size in chickens. This can be due to these markers
being linked to or in linkage disequilibrium with
QTL and/or due to markers capturing pedigree rela-
tionships [ 19].
The ac curacy of estimates of π depends on the infor-
mation content of the data and on mixing in the Monte
Carlo Markov Chain, which can be poor for Bayes-C- π.
Two independent chains with a high (0.99) or a low
(0.1) starting value for π were used to verify conver-
gence of π. For some traits (eE3, eEW, lEW, eCO, lBW),
both c hains converged to the same value with a clearly
peaked posterior distribution but for other traits 160,000
iterations were not sufficient for the two chains to reach
thesameposteriormeans,asthe posterior distribution
of π was relatively flat. This difference may reflect differ-
ences in genetic architecture of the traits. For traits with
a high estimate of π (i.e. with few ma rkers associated),
convergence was obtained quickly and the standard
deviation of the posterior distribution of π was small
but for traits for which many markers were fitted in the
model, the standard deviation of π was high, which sug-
gests that models with different numbers of markers
had similar likelihoods. Nevertheless, lack of conver-
gence in π, i.e. different estimates depending on starting
value, had almost no impact on the acc uracy of E BV.
There was also no substantial difference between early
and late selection scenarios with regard to convergence
of estimates of π. Only for ePD and lCO did the inclu-
sion of additional information from sibs make the pos-
terior means of π from different chains more similar to
each other.
Information from parental average EBV
In dairy cattle, genomic predictions are often combined
with pedigree information [4] before obtaining final
genomic EBV. In our study, lEW was the only trait for
which adding pedigree-based information significantly
improved predictive ability. The increase in the R-square
of the regression equation to predict hatch-correc ted
phenotypes from generation 5 when adding PBLUP to
marker-based EBV was significant (p < 0.05) only for
lEW for GBLUP and B ayes-C-π, for which the R- square
increased from 0.174 to 0.189 and from 0.187 to 0.203,
respectively. Increases in R-square were not significant
(p > 0.05) for all other traits using both methods. This
suggests that in this dataset, the markers capture most
of the pedigree information, likely because all the par-
ents were genotyped.
For most traits, the predictive ability of the marker-
based EBV was not substantially lower for traits mea-
sured at a late age (Figures 1 and 2), although late tra its
were only recorded on selected individuals and esti-
mated heritabilities for late traits were generally lower
than for the corresponding traits measured at a younger
age. This indicates that having records only on selected
parents did not limit the ability to estimate marker
effects.
In Figures 1 and 2, the difference between the accu-
racy of marker- versus pedigree-based parental average
EBV (e.g. GBLUP-PA vs. PBLUP) reflects the gain in
information from m ore accurate EBV of parents when
using markers, while the difference between the accu-
racy of marker-based parental average EBV and marker-
based individual EBV (e.g. GBLUP-PA vs. GBLUP) arises
from markers providing information on Mendelian sam-
pling terms. For ePS and ePD and eSM, the i ncrease in
accuracy at an early age could be attributed mostly to
Table 4 Estimates of the proportion of markers with zero effects (x100 ± SD) from the Bayesian variable selection
model with starting values of 0.1 (π = 0.1) or 0.99 (π = 0.99)
Early selection
Trait ePD eEW ePS eAH eCO eYW eE3 eC3
π = 0.1 ± SD 34 ± 19 98 ± 0 33 ± 20 42 ± 32 90 ± 5 60 ± 29 98 ± 0 48 ± 29
π = 0.99 ± SD 21 ± 21 98 ± 0 58 ± 27 71 ± 20 91 ± 3 45 ± 25 98 ± 1 60 ± 26
Trait lPD lEW lPS lAH lCO lYW lBW eSM
π = 0.1 ± SD 19 ± 17 99 ± 0 42 ± 27 37 ± 31 38 ± 23 36 ± 16 99 ± 3 33 ± 24
π = 0.99 ± SD 34 ± 25 99 ± 0 49 ± 30 30 ± 21 56 ± 30 90 ± 9 99 ± 3 58 ± 27
Late selection
Trait ePD eEW ePS eAH eCO eYW eE3 eC3
π = 0.1 ± SD 38 ± 28 98 ± 0 40 ± 22 82 ± 9 92 ± 4 64 ± 24 97 ± 1 69 ± 16
π = 0.99 ± SD 36 ± 21 98 ± 1 35 ± 22 51 ± 29 92 ± 3 39 ± 20 97 ± 1 52 ± 33
Trait lPD lEW lPS lAH lCO lYW lBW eSM
π = 0.1 ± SD 36 ± 17 98 ± 0 41 ± 24 59 ± 26 40 ± 22 43 ± 32 99 ± 2 48 ± 23
π = 0.99 ± SD 49 ± 31 98 ± 1 24 ± 21 41 ± 27 45 ± 20 57 ± 28 99 ± 2 32 ± 19
Wolc et al. Genetics Selection Evolution 2011, 43:5
/>Page 7 of 9
better estimates of parental EBV. For all other traits,
increases in accuracy were primarily based on markers
providing information on Mendelian sampling terms.
For EBV for selection at a later age, the improvement
originated mostly from Mendelian sampling terms,
probably because the pedigree parental average EBV
were much more accurate than at the earlier age.
Reduced animal model
The reduced animal model was used to incorporate
genomic information into genetic evaluation using
GBLUP. It was possible to use this model here because
all the parents were genotyped, thus data from non-
genotyped individuals could be included without loss of
information. If some parents are not genotyped, the
1-step methods that combine pedigree-based and geno-
mic relationships can be used to avoid loss of informa-
tion [7,8]. An alternative to the 1-step method is the use
of deregressed EBV [5,6] but this involves approxima-
tions and a potential loss of information.
In fact, the model used here represents a special case
of the 1-step method of Legarra et al. [7], where all
non-genotyped individuals in the data are non-parent
progeny. In this case, the only pedigree-relationships
that a re used are those between genotyped parents and
their non-genotyped progeny. Without inbreeding, the
expectation of t hese relationships is equal to 0.5, both
based o n pedigree and based on genomic data, because
progeny receive half of their alleles from each parent.
Thus, in this special case, combining genomic and pedi-
gree relationships does not require the rescaling that is
typically required for the 1-st ep approach [20]. In addi-
tion to avoiding the need for rescaling, this special case
allows equations for non-parents to be absorbed, as in
the reduced animal model, which reduces computational
demands, although the main computational task o f
inverting the dense genomic relationship matrix of gen-
otyped individuals remains. By absorbing non-parents,
computing time for the reduced animal model is pro-
portional to n
3
, where n is t he number of genotyped
animals, while the number of animals with phenotypes
has a negligible impact on computing time. Computing
time for Bayes-C-π is proportional to the number of
markers and to the number of records. The reduced ani-
mal model can also easily be extended to a multi-trait
setting, following standard multiple-trait animal model
procedures. Finally, applying a reduced animal model
makes it possible to use weighted genomic relationship
matrices th at accommodate differential weights on SNP,
depending on their effects, similar to the Bayesian
model averag ing methods [21]. Use of a weighted geno-
mic relationship matrix in a multi-trait setting, however,
requires further work.
Implementation of genomic selection in layer chickens
Increases in accuracy were evaluated when selection is
at a very early age, prior to phenotypes being available
on se lection candidates or their sibs, and at a later a ge.
Late age selection represents a scenario in which geno-
mic information is used to increase accuracy of selection
in existing la yer breeding programs, particularly in the
case of males, which are primarily eval uated based on
sib information in current breed ing programs. Early age
selection represents a scenario in which the benefits of
genomic selection are capitalized on by also reducing
the generation interval from the tra ditional one year to
half a year, as proposed by Dekkers et a l. [22]. Using
these results, breeding programs exploiting genomic
information can be optimized, including scenarios where
only male candidates are genotyped and where popula-
tion sizes are reduced to capitalize on the effect of
GEBV on rates of inbreeding. The use of low-density
SNP panels needs to be evaluated [23] to reduce costs
of genotyping, but this was beyond the scope of this
research. In this study, the size of the training data was
limited compared to what is available in dairy cattle and
increasing its size is expected to further increase t he
accuracy of GEBV.
Conclusions
Reduced animal model approaches c an be used to esti-
mate breeding values from high-dens ity SNP data when
all parents have been genotyped. Marker-based methods
improve the prediction of future performances com-
pared to the classical pedigree-based approach, with
most of the accuracy increase due to improved estima-
tion of Mendelian sampling terms. The advantage of
marker-based methods is greater for selection at a
young age, before information on sibs of selection candi-
dates is available. The accuracies o f methods that
assume equal variance for all SNP, such as GBLUP and
of those that allow differential weighting and s hrinkage
of SNP effects are similar.
Acknowledgements
This study was supported by Hy-Line Int., the EW group, and Agriculture and
Food Research Initiative competitive grants 2009-35205-05100 and 2010-
65205-20341 from the USDA National Institute of Food and Agriculture
Animal Genome Program. Ian White helped with the REML analysis.
Author details
1
Department of Genetics and Animal Breeding, University of Life Sciences in
Poznan, Wołyńska st. 33, 60-637 Poznan, Poland.
2
Department of Animal
Science, Iowa State University, Ames, IA 50011-3150, USA.
3
Applied Genetics
Network, Börtjstrasse 8b, 7260 Davos, Switzerland.
4
Hy-Line International,
Dallas Center, IA 50063, USA.
5
Lohmann Tierzucht GmbH, 27472 Cuxhaven,
Germany.
Authors’ contributions
All authors conceived the study, contributed to methods and to writing the
paper and also read and approved the final manuscript. AW undertook the
Wolc et al. Genetics Selection Evolution 2011, 43:5
/>Page 8 of 9
analysis and wrote the first draft. Data were prepared by JA, PS, JF and NPO.
JCMD provided overall oversight of the project.
Competing interests
The authors declare that they have no competing interests.
Received: 7 September 2010 Accepted: 21 January 2011
Published: 21 January 2011
References
1. Meuwissen THE, Hayes BJ, Goddard ME: Prediction of total genetic value
using genome-wide dense marker maps. Genetics 2001, 157:1819-1829.
2. Daetwyler HD, Villanueva B, Bijma P, Woolliams JA: Inbreeding in genome-
wide selection. J Anim Breed Genet 2007, 124:369-376.
3. Goddard M: Genomic selection: prediction of accuracy and maximisation
of long term response. Genetica 2009, 136:245-257.
4. Hayes BJ, Bowman PJ, Chamberlain AJ, Goddard ME: Genomic selection in
dairy cattle: Progress and challenges. J Dairy Sci 2009, 92:433-443.
5. Garrick DJ, Taylor JF, Fernando RL: Deregressing estimated breeding
values and weighting information for genomic regression analyses.
Genet Sel Evol 2009, 41:55.
6. VanRaden PM, Van Tassell CP, Wiggans GR, Sonstegard TS, Schnabel RD,
Taylor JF, Schenkel FS: Reliability of genomic predictions for North
American Holstein bulls. J Dairy Sci 2009, 92:16-24.
7. Legarra A, Aguilar I, Misztal I: A relationship matrix including full pedigree
and genomic information. J Dairy Sci 2009, 92:4656-4663.
8. Christensen OF, Lund M: Genomic prediction when some animals are not
genotyped. Genet Sel Evol 2010, 42:2.
9. Quaas RL, Pollak EJ: Mixed model methodology for farm and ranch beef
cattle testing programs. J Anim Sci 1980, 51:1277-1287.
10. White IMS, Roehe R, Knap PW, Brotherstone S: Variance components for
survival of piglets at farrowing using a reduced animal model. Genet Sel
Evol 2006, 38:359-370.
11. VanRaden PM: Efficient methods to compute genomic predictions.
J Dairy Sci 2008, 91:4414-4423.
12. Habier D, Fernando RL, Kizilkaya K, Garrick DJ: Extension of the Bayesian
Alphabet for Genomic Selection. In Proceedings of the 9th World Congress
on Genetics Applied to Livestock Production. Edited by: Leipzig. German
Society for Animal Science; 2010:468, 1-6 August 2010.
13. Gilmour AR, Gogel BJ, Cullis BR, Thompson R: ASReml User Guide Release
3.0. VSN Int Ltd 2008.
14. Lund MS, Sahana G, de Koning DJ, Su G, Carlborg O: Comparison of
analyses of the QTLMAS XII common dataset. I: Genomic selection. BMC
Proc 2009, 3(Suppl 1):566.
15. Bastiaansen JWM, Bink MCA, Coster A, Maliepaard C, Calus MPL:
Comparison of analyses of the QTLMAS XIII common dataset. I: genomic
selection. BMC Proc
2010, 4(Suppl 1):S1.
16. Daetwyler HD, Pong-Wong R, Villanueva B, Woolliams JA: The impact of
genetic architecture on genome-wide evaluation methods. Genetics 2010,
185(3):1021-31, [Epub 2010 Apr 20].
17. Luan T, Woolliams JA, Lien S, Kent M, Svendsen M, Meuwissen THE: The
accuracy of genomic selection in Norwegian Red Cattle assessed by
cross-validation. Genetics 2009, 183:1119-1126.
18. Verbyla KL, Hayes BJ, Bowman PJ, Goddard ME: Accuracy of genomic
selection using stochastic search variable selection in Australian Holstein
Friesian dairy cattle. Genet Res 2009, 91:307-311.
19. Habier D, Fernando RL, Dekkers JCM: The impact of genetic relationship
information on genome-assisted breeding values. Genetics 2007,
177:2389-2397.
20. Aguilar I, Misztal I, Johnson D, Legarra A, Tsuruta S, Lawlor T: A unified
approach to utilize phenotypic, full pedigree, and genomic information
for genetic evaluation of Holstein final score. J Dairy Sci 2010, 93:743-752.
21. VanRaden PM: Genomic measures of relationship and inbreeding.
Interbull Bull 2007, 37:33-36.
22. Dekkers JCM, Zhao HH, Habier D, Fernando RL: Opportunities for genomic
selection with redesign of breeding programs. J Anim Sci 2009, 87(Suppl
E):275.
23. Habier D, Fernando RL, Dekkers JCM: Genomic selection using low-density
marker panels. Genetics 2009, 182:343-353.
doi:10.1186/1297-9686-43-5
Cite this article as: Wolc et al.: Breeding value prediction for production
traits in layer chickens using pedigree or genomic relationships in a
reduced animal model. Genetics Selection Evolution 2011 43:5.
Submit your next manuscript to BioMed Central
and take full advantage of:
• Convenient online submission
• Thorough peer review
• No space constraints or color figure charges
• Immediate publication on acceptance
• Inclusion in PubMed, CAS, Scopus and Google Scholar
• Research which is freely available for redistribution
Submit your manuscript at
www.biomedcentral.com/submit
Wolc et al. Genetics Selection Evolution 2011, 43:5
/>Page 9 of 9