Báo cáo sinh học: "Mapping of a milk production quantitative trait locus to a 1.056 Mb region on bovine chromosome 5 in the Fleckvieh dual purpose cattle breed" pps
Bạn đang xem bản rút gọn của tài liệu. Xem và tải ngay bản đầy đủ của tài liệu tại đây (391.32 KB, 11 trang )
RESEARCH Open Access
Mapping of a milk production quantitative trait
locus to a 1.056 Mb region on bovine chromosome
5 in the Fleckvieh dual purpose cattle breed
Ashraf Awad
1
, Ingolf Russ
2
, Martin Förster
1,2
, Ivica Medugorac
1*
Abstract
Background: In a previous study in the Fleckvieh dual purpose cattle breed, we mapped a quantitative trait locus
(QTL) affecting milk yield (MY1), milk protein yield (PY1) and milk fat yield (FY1) during first lactation to the distal
part of bovine chromosome 5 (BTA5), but the confidence interval was too large for positional cloning of the causal
gene. Our objective here was to refine the position of this QTL and to define the candidate region for high-
throughput sequencing.
Methods: In addition to those previously studied, new Fleckvieh families were genotyped , in order to increase the
number of recombination events. Twelve new microsatellites and 240 SNP markers covering the most likely QTL
region on BTA5 were analysed. Based on haplotype analysis performed in this complex pedigree, families
segregating for the low frequency allele of this QTL (minor allele) were selected. Single- and multiple-QTL analyses
using combined linkage and linkage disequilibrium methods were performed.
Results: Single nucleotide polymorphism haplotype analyses on representative family sires and their ancestors
revealed that the haplotype carrying the minor QTL allele is rare and most probably originates from a unique
ancestor in the map ping population. Analyses of different subsets of families, created according to the results of
haplotype analysis and availability of SNP and microsatellite data, refined the previously detected QTL affecting
MY1 and PY1 to a region ranging from 117.962 Mb to 119.018 Mb (1.056 Mb) on BTA5. However, the possibility of
a second QTL affecting only PY1 at 122.115 Mb was not ruled out.
Conclusion: This study demonstrates that targeting families segregating for a less frequent QTL allele is a use ful
method. It improves the mapping reso lution of the QTL, which is due to the division of the mapping population
based on the results of the haplotype analysis and to the increased frequency of the minor allele in the families.
Consequently, we succeeded in refining the region containing the previously detected QTL to 1 Mb on BTA5. This
candidate region contains 27 genes wi th unknown or partially known function(s) and is small enough for high-
throughput sequencing, which will allow future detailed analyses of candidate genes.
Background
Recent developments in molecular biology and statistical
methodologies for quantitative trait loci (QTL) mapping
have made it possible to identify genetic factors affecting
economically important traits. Such developments have
the potential to significantly increase the rate of genetic
improvement of livestock species, through marker-
assisted selection of specific loci, genome-wide selection,
gene introgression and positional cloning [1]. However,
after an initial exaggerated enthusiasm animal geneti-
cists, like their colleagues in human genetics e.g. [2]
have faced somewhat unexpected challenges.
The first step in QTL mapping usual ly involves a com-
plete or partial genome scan, where the mapping popula-
tion is genotyped for markers covering the entire genome
or only selected chromosomes, respectively. The QTL are
then mapped using linkage analysis (LA) methods. The
resolution of this mapping approach is low because rela-
tively few new recombin ation events are generated in the
* Correspondence:
1
Chair of Animal Genetics and Husbandry, Faculty of Veterinary Medicine,
Ludwig-Maximilians-University Munich, Veterinärstr .13, 80539 Munich,
Germany
Full list of author information is available at the end of the article
Awad et al. Genetics Selection Evolution 2011, 43:8
/>Genetics
Selection
Evolution
© 2011 Awad et al; licensee BioMed Centra l Ltd. This is an Open A ccess articl e distributed under the terms of the Creative Commons
Attribution License (htt p://creativecommons.org/licenses/by/2.0), which permits unrestricted use, dis tribution, and reproduction in
any medium, prov ided the orig inal work is properly cited.
single generation separating parents and progeny. Typi-
cally, the size of confidence intervals for the most likely
QTL positions ranges between 20 and 40 cM.
Fine-mapping approaches have been developed to
reduce these confidence intervals e.g. [3-5], leading in
some instances to the identification of the underlying
causal mutation [6-9]. These approaches are usually
based on the addition of new families, new markers and
the use of statistical methods combining linkage-disequi-
librium and linkage (LDL) analysis. In general, the mar-
ker density is increased by adding a few tens of new
markers (microsatellite markers or single nucleotide
polymorphism (SNP)) identified within the QTL region
or candidate gene.
At present, high-throughput SNP analysis provides the
opportunitytogenotypemanyanimalsforhundredsor
even thousands of SNP per bovine chromosome [10-12].
Therefore, the limiting factors in QTL fine-mapping
studies have now switched partly from marker density
to the applied methods and designs. Use of linkage-
disequilibrium (LD) information i ncreases the precision
of QTL mapping because it exploits the entire number
of recombinations accumulated since the original muta-
tion generating the new QTL allele occurred [13].
The degree of LD in livestock populations has attracted
much attention because it provides useful information
regarding the possibility of fine-mapping QTL and the
potential to use marker-assisted selection. In cattle,
previous reports using a low density microsatellite map
(10 cM interval on average) and Hedrick’ s normalized
measur e of LD [14] D’ have shown that LD extends over
several tens of centimorgans [10,15,16]. However, an
exceedingly low long-range and non-syntenic LD has
been estimated [17] when evaluated by the standardized
chi-square measure of LD, which is related to the predic-
tive ability of LD. Nevertheless, the extent of LD in cattle
[18] is greater than in humans [19] but smaller than in
dog [20].
Combined linkage disequilibrium and linkage (LDL)
analysis [3] makes it possible to exploit recombinations
occurring both within and outside the pedigree and gen-
otype d population. It also gives a clearer signal for QTL
positions compared with LA or LD mapping alone [3].
Additionally, the LDL approach reduces the risk of
false-positive QTL identification caused by accidental
marker-phenotype associations when LA and LD are
used separately, and also increases the power and reso-
lution of QTL mapping by combining all available infor-
mation [21].
In dairy cattle, several studies have reported the pre-
sence of one or more QTL affecting milk production
traits on BTA5 e.g. [22-25], but the results differ among
studies with respect to the number of QTL detected,
their positions, and the extent to which the milk traits
are affected by the QTL.
Thepresentstudyaimedatrefiningthepreviously
detected QTL affecting milk yield (MY1), milk protein
yield (PY1) and milk fat yield (FY1) during first lactation
in the distal part of BTA5 in the Fleckvieh dual-purpose
cattle breed [24], and to define the candidate region
for high-throughput sequencing. To achieve this, we
sampled additional families carrying the low frequency
allele of the putative QTL (minor QTL allele) and geno-
typed additional markers covering the most likely QTL
region on BTA5. These new families were identified by
combining results from QTL-mapping based on micro-
satellites and haplotype analysis based on SNP in a com-
plex pedigree. Single- and multiple-QTL analyses based
on the LDL method were performed in diff erent sam-
ple-sets, in order to allocate the minor QTL allele to
specific families and to use the increased frequency of
the minor QTL allele for refined mapping.
Methods
Animals and phenotype
In this study, we analysed the same nine granddaughter
(GD) families used in our previous study [24], in which
we identified three GD families (G01, G02 and G03) as
heterozygous for a QTL located in the distal region of
BTA5. The grandsires of these three GD families are
designated as G01, G02 and G03, respectively. Grand-
sires G01 and G02 are half-sibs and have inherited the
same haplotype in the dist al region of BTA5 from their
comm on ancestor A0 [24]. By target sampling (see hap-
lotyping section, below), we introduced two additional
GD families; family G10 with 85 sons, and family G11
with 47 sons. G randsire G10 (grandsire of family G10),
was connected through his dam to A0. Grandsire G11
(grandsire of family G11) is a son of grandsire G02. In
addition, we identified all a vailable progeny-tested
maternal grandsons of grandsires G01, G02, G10 and
G11 t o add more, possibly recombinant, A0 haplotypes
into the mapping population. In this way, we created
three maternal grandsire (MGS) families, M02 with 21
grandsons, M10 with 32 grandsons and M11 with 33
grandsons, descendants of grandsires G02, G10 and
G11, respectively. Samples of maternal grandsons were
not available for grandsire G01. Thus, the analysis
included 11 GD families: G01 to G11 and three MGS
families (M02, M10 and M11). Figure 1 shows the rela-
tionships of all families included in this study. In some
cases, mapping an alyses were ca rried out on 173 addi-
tional animals available from other projects that are not
descended from ancestor A0. Estimated breeding values
(EBV) of the Fleckvieh bulls for milk production traits
MY1, PY1, and FY1, (along with their reliability values)
Awad et al. Genetics Selection Evolution 2011, 43:8
/>Page 2 of 11
were obtained from the 2009 joint Austria-Germany
genetic evaluation of the Fleckvieh population [26].
DNA preparation, microsatellite marker selection and
genotyping
Genomic DNA was prepared from semen using stan-
dardmethods,andfromwholebloodsampleswith
QIAamp Blood-Kits (Qiagen), according to the manu-
facturer’s protocol.
Twelve evenly distributed microsatellite markers were
added to the 28 microsatellite markers used in the pre-
vious study [24]. Twenty-one of these 40 microsatellite
markers covered the most likely region containing the
QTL in the distal part of BTA5 (Table 1) and were used
in most analyses of the present study. Previously ana-
lysed animals were genotyped only for the new markers,
but the five new f amilies (G10, G11, M02, M10 and
M11) were genotyped for all marker sets [24]. For 11 of
50%
RH
G
02
A0
100%
RH
G
01
G
09
G
06
G
05
G
07
G
03
G
08
G
04
G
28
G
14
G
22
G
29
G
12
G
23
D
3E
G
27
G
36
G
30
G
37
G
24
G
13
DD
2I
DD
3F
DD
3H
DD
3G
G
18
DD
2J
G
26
G
38
G
35
G
19
G
15
G
20
G
25
G
21
G
31
G
34
DD
3D
G
16
G
17
DD
2E
DD
2D
G
10
G
11
M
10
M
11
M
02
A1
A2
A1A1
G
33
DD
2A
A1
AAGAGGAAAGCCCGGAAGAAGGGAG
G•A••••••••••••GG•••••AC•
G••G•••••••AAAA••AC••AAC•
G•A•••••••••••A••A•G••AC•
GGA••A•G•••A•AAG•A••••AC•
G•••A•G•••A••••G•A••••AC•
G
32
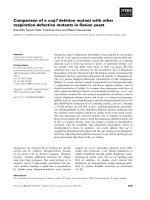
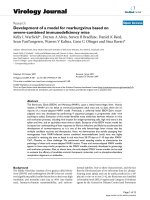
Figure 1 Familial relationships considered in this study and segregation of most important haplotypes. A complex pedigree of 38 sires
(squares) of GD families (G), ten sires of daughter design (DD) families, three maternal grandsire (M) families and 26 sampled and genotyped
relevant ancestors; the pedigree has been simplified by showing only ancestors who made it possible to trace haplotypes from family-sires to
the most important ancestors (A0, A1, A2); furthermore, to reduce the complexity of the figure, ancestor A1 is represented more than once;
correspondingly, letters and numbers within squares of family-sires represent the internal family ID; non-genotyped individuals are represented
by smaller circles (females) and squares (males) marked with a diagonal line; the estimated haplotype of 25 markers (A0
H1
) comprising a derived
QTL allele affecting MY1 and PY1 with 97% CI between 117.962 Mb and 119.018 Mb is graphically presented by yellow bars above the
individual’s symbol; five other most frequent haplotypes are represented by five different coloured bars; introgression of Red-Holstein genes into
the mapping populations is represented by ancestor A2 and the corresponding haplotype presented by a red bar; to reduce the complexity of
the figure, 77 low frequency haplotypes are omitted; the allelic composition of the respective haplotypes is presented within the figure; the
pedigree MSPED2089 is a subset of the total material which can be constructed by keeping the families marked by a grey circle around squares
and associated ancestors; pedigrees MSPED1038 and SNPPED421 are subsets of MSPED2089 which can be constructed by removing appropriate
families as described in material and methods; the pedigree SNPPED308 consists of GD family G36 and animals across the entire mapping
population but not descending from A0; the pedigree SNPPED723 is a sum of pedigrees SNPPED308 and SNPPED421.
Awad et al. Genetics Selection Evolution 2011, 43:8
/>Page 3 of 11
the 12 markers, relevant information was obtained from
the MARC-ARS-USDA public database at http://www.
ars.usda.gov/Main/docs.htm?docid=12539 [27]. The new
marker LMU0505 was obta ined by a targeted search for
dinucleotide repeats in genomic regions with a low mar-
ker density. The unique sequences flanking the newly
identified dinucleotide repeats were tested for informa-
tivity by genotyping a small set of animals first. Primers
for the 12 new microsatellite markers were optimized
using Primer3 (v.0.4.0) according to t he bovine genome
sequence data currently available (i.e. Baylor release
Btau_4.0, />and the appropriate fragment size in the currently
designed marker set. New markers were divided into
two PCR multiplex sets ( Table 1) that were combined
again after PCR for electrophoresis and fragment analy-
sis. The frag ment analysis of the PCR products was per-
formed on ABI377 and ABI Prism 310 sequencers.
Table 1 Microsatellite markers used for QTL mapping
Nb Marker ID cM bp Forward primer
Reverse primer
Remark
1 LMU0502 95.00 98418609-98419268 TGGAAGAATATGCAGGTAACTCT
GTCGCTCTTTGTGGCTTCAC
Set1
2 DIK2336 99.79 101071987-101072659 ATGTGGAATGTAGGGCAAGG
TCCCTCACCTTTCGAACAAA
Set1
3 BM315 103.17 104045839-104046013 TGGTTTAGCAGAGAGCACATG
GCTCCTAGCCCTGCACAC
Set0
4 DIK4843 107.02 107077504-107078179 CATGCAAGCTTTCAAGAATGA
TGCAGAGATAAGCCGAGGAC
Set4
5 DIK1135 108.22 10181410-10182069 GTCTGCCATCTAGCCAAAAA
GTTTTTCAGTGGGCATTTGG
Set1
6 DIK5238 110.97 111864734-111865363 TGGAACCAGTGAAGTTTAGGG
GAAATGCCCACTGAAGCTCT
Set3
7 ETH2 112.43 112903902-112909263 ATTTGCCCTGCTAGCTTTGA
AAGACTCTGGGCTTCAAAAGG
Set1
8 DIK2122 114.68 113216193-113216706 CAACAAACTGTGCGTTGTGA
ACTCAGCAGTTGCCCTCAGT
Set3
9 BM2830 116.91 115262054-115262075 AATGGGCGTATAAACACAGATG
TGAGTCCTGTCACCATCAGC
Set0
10 BM49 118.06 116205343-116205972 CACCATATTTGCCAGGATCA
GCGGGATCTCACTAAACCAG
Set3
11 BM733 119.95 117125799-117126005 CTGGAGTCTCCTCCGTTGAG
AGAGAGGGCCCTTGTGAGAT
Set4
12 DIK2035 120.85 119370626-119371127 CAGTCAATGCAGGAAAAGCA
GCTGCTAGAGGGAGACAGGA
Set3
13 DIK5277 121.53 120099447-120100247 ACCCAAACTTAGCGTGGATG
GTCTCCAAGGCTGCTCACTC
Set3
14 DIK5106 121.47 118461214-118461602 GCATGTGTGCAGAAGAAGGA
TGTTCAGTGGTTCCCTGTGA
Set3
15 LMU0505 123.64 121423920-121424520 TGCAAGGAGAAGCGGTAGAT
TGCACACTTACCCCATGTTC
Set3
16 ETH152 124.95 Unknown GTTCTCAGGCTTCAGCTTCG
TGATCAGAGGGCACCTGTCT
Set1
17 URB060 127.55 122472602-122473177 TTGTCATTTCTGGACTCCACTG
TGATCAGAGGGCACCTGTCT
Set1
18 DIK5212 129.17 123262266-123262905 GGCTGGAACAGTGACTCTGG
GGACCCAGATTTCAATGGAG
Set3
19 DIK5247 129.80 123619504-123619855 GGGTCTGTAGGGAGAAGCTG
GCTTTCGAGAAGCATCCACT
Set3
20 MNB71 133.09 Unknown CATCTAAGGCAGAGCCAACC
TTCTTGGTGCCTCTCTCTCC
Set1
21 NOR44 133.98
125340968-125341598 ACCCACCCGTACACATTCAA
GGGGAGGAGATGGACTGTTC
Set3
Marker name, relative position (cM), physical position (bp), forward and reverse primer sequences and marker set (set: Set0 & Set1 as in previous study; Set3 and
Set4 comprise multiplex 1&2 in this study).
Awad et al. Genetics Selection Evolution 2011, 43:8
/>Page 4 of 11
Genotypes were assigned using GENESCAN and GENO-
TYPER (Applied Biosystems) software programs. W e
performed double genotyping of a ll families and ances-
tors using two independent runs. For ambiguous geno-
types, the raw data were re-evaluated and animals were
re-genotyped if necessary.
SNP selection, genotyping and haplotyping
SNP genotyping was carried out by Tierzuchtforschung
e. V. München using the commercial Illumina Bovine
SNP50 Bead chip featuring 54 001 SNP (http://www
illumina.com/; Illumina, San Diego) that span the bovine
genome, excludi ng Y-chromosome. The genotype calling
was performed with the GenCall application, as imple-
mented in Illumina Bead chip Genotyping analysis soft-
ware. This application computes a Gencall score for each
locus, which evaluates the quality of genotypes. We
included only animals with confirmed paternity and with
a call rate above 0.98. Furthermore, we only used markers
with a call rate above 0.90. We excluded all markers pro-
ducing more than 1% paternity problems in pairs with
confirmed paternity, and also excluded all markers that
were non-informative in the Fleckvieh population or with
an unknown chromosomal position. T his yielded 43 806
info rmative SNP available for the whole-genome analysis
in the Fleckvieh population, of which 1 976 are found on
the BTA5. Two hundred and forty of these covered the
region most likely containing the QTL in the distal part
of BTA5 and were used in the present study.
We pe rformed SNP genotyping in two stages. First, 75
animals i.e. the gransires of the nine initial GD families
and their ances tors, and also a number of potential GD-
family sires and their ancestors, were genotyped with
the SNP chip and their haplotypes were reconstructed
with the BEAGLE program [28]. These 75 animals con-
stitute a complex pedigree (Figure 1) in which it is pos-
sible to trace the segregating haplotypes five generations
back to some important ancestors of the Fleckvieh
population, born in the 1960’s and 1970’s. Thi s pedigree
represents almost all of the important bull lines origi-
nating from a wide range of dams. Considering this, and
the fact that a large proportion of the included bull
dams are unrelated (no common grand-parents), these
75 animals provide a good representation of the haplo-
type diversity in the breeding Fleckvieh population. Sec-
ond, the new families (G10, G11, M02, M10 and M11)
containing the target haplotype segment of ancestor A0
were genotyped with microsatellite markers and with
the genome-wide SNP chip. These animals and 173
additional Fleckvieh animals not closely related to
ancestor A0 (but genotyped with the SNP chip in other
projects running in our laboratory) were also haplotyped
using the BEAGLE program.
Linkage map construction
The relative positions of microsatellite markers were re-
evaluated by the CRI-MAP program [29]. A physical
map was constructed according to the sequence data of
all the markers (Table 1) using the basic alignment
search tool (BLAST) and the latest cattle genome
sequence />Our g enetic data was used to resolve cases where more
than one marker order was obtained from published
linkage and physical maps. When our genetic data sup-
ported a marker order different from that of the public
linkage map, but in accordance to the physical map, we
modified the relative position (cM) of the markers along
with the corresponding sequence. The linkage and phy-
sical maps were used as a framework to insert the newly
designed marker (LMU0505) with the build option of
the CRI-MAP program. The resulting final map (Table
1) was used for all the following analyses.
QTL fine mapping
LDL mapping by microsatellite markers
Joint linkage disequilibrium and linkage (LDL) analysis is
a variance component approach and we used linear
mixed model s to estimate variance components as
described previously [24]. Thereby, we used the Markov
chain Monte Carlo (MCMC) implemented in the pro-
gram LDLRAMS [30-32] (version 1.76) to estimate IBD
probabilities in general complex pedigrees [30-32]. To
estimate LD-based IBD probabilities, we assumed the
number of generations since the base population (muta-
tion age) and the past effective population size to be 100,
and the initial homozygosity at each microsatellite mar-
ker in the base population was set to 0.35. In addition,
the program LDLRAMS exploits allele frequencies in the
population. To calculate an unbiased estimation of allele
frequencies in the Fleckvieh population, we performed
allele counting within the complex pedigree. We counted
both alleles of all genotyped founder individuals and only
the maternal allele of descendents in the pedigree. Two
complex pedigrees consisting of 2 089 (MSPED2089 ) and
1038(MSPED1038) animals, respectively, were analysed
by LDLRAMS.TheMSPED2089 pedigree included nine
GD families from the previous study (G01 to G09), two
additional GD families (G10 and G11), three maternal
grandsire families (M02, M10 and M11), some highly
related animals and some important ancesto rs (paternal
and maternal grandsires of phenotyped sons and of
family sires). The MSPED1038 pedigree included two GD
fam ilies (G01 and G02) found to be segregat ing for QTL
in the previous study, two additional GD (G10 and G11)
families and three MGS families (M02, M10 and M11)
sampled according to the results of the haplotype analy-
sis. For both LDL analyses, as implemented in the
Awad et al. Genetics Selection Evolution 2011, 43:8
/>Page 5 of 11
MCMC approach of the program LDLRAMS,weusedan
initial burn-in of 500 it erations followed by 2 500 itera-
tions, with parameter estimates collected for each itera-
tion. To avoid entrapment in a local maximum, we
performed two independent sampling procedures (i.e.
two LDLRAMS runs with different random number
seeds).
LDL mapping by SNPs
Here we used three c omplex pedigrees for LDL map-
ping by SNPs. The first pedigree, SNPPED723,was
based on all progeny-tested Fleckvieh animals geno-
typed with the SNP chip, and consisted of 325 geno-
typed and phenotyped sons, and 16 genotyped and 382
non genotyped ancestors. The second pedigree,
SNPPED421, was based on progeny-tested animals that
could be traced back to ancestor A0, and consisted of
175 genotyped and phenotyped sons, eight genotyp ed
and 238 non genotyped ancestors. The third pedigree,
SNPPED308, was based on animals not related to
ancestor A 0 according to the known pedigree, and
consisted of 144 genotyped and phenotyped animals,
12 genotyped and 152 non genotyped ancestors. These
pedigrees were analysed with LDLRAMS using a dense
map of 240 SNPs covering the region from 112.650 to
124.780 Mb on BTA5, i.e. a region larger than the 97%
confidence interval as determined by 1-LOD support
interval [24]. Due to computing constraints, the total
marker set was divided into five overlapping sets of 80
SNP each. Since IBD estimates are most accurate in
the middle of an investigated marker set, we present
log-likelihood ratio (LRT) values only for the internal
40 marker intervals within these windows (that is,
excluding the most proximal and most distal 20
markers). We used the model described above, setting
the initial homozygosity at each SNP in the base
population to 0.75 and using an initial burn-in of 500
iterations followed by 2 500 iterations. The parameter
estimates were collected after each iteration. Two
independent MCMC sampling procedures (i.e. two
LDLRAMS runs with different random number seeds)
indicated convergence to a global maximum.
Multiple-QTL analysis using linkage disequilibrium and
linkage (LDL) analysis method
We used the analysis method of Olsen et al. [33], i.e.
the same model as for single-QTL analysis, but includ-
ing a random QTL effect of a specified marker bracket.
That is, the bracket that showed the highest LRT in
the single-QTL analysis was included as a random
effect in the QTL model in turn, and the analysis was
repeated. These analyses searched for an additional
QTL, given that the QTL in the specified marker
bracket is accoun ted for, and is similar to the fitting of
cofactors [34].
Estimation of model parameters and test statistics
The variance components and the logarithm of the likeli-
hood (L) of a model containing a QTL as well as residual
polygenic effects at position p (logL
p
) were estimated by
AIREML [32,35], which is an integral part of the
LDLRAMS and LDL programs. The likelihood of a model
without QTL effect (logL
0
) was calculated on the basis of
a polygenic model. The log-likelihood ratio (LRT) was
calculated as double difference in logL between models
with and without a QTL, i.e. LRT = -2 (logL
0
-logL
p
). The
LRT test statistic is distributed approximately as chi-
square with 1 degree of freedom [36]. The confidence
interval (CI) for the QTL position was determined as
1-LOD support interval, which was constructed as the
interval surro unding the QTL peak where the LRT
exceeds LRT
max
-2×ln (10), where LRT
max
is the maxi-
mum LRT-value for the tested QTL [37].
Results
Genotypes and linkage map construction
Genotypes for 40 microsatellite markers were available
to build the BTA5 genetic map. In most of the LDL
analyses, only the 21 most distal markers (Table 1) cov-
ering the 97% confidence interval were considered.
When we controlled if the genotype and haplotype data
were plausible, the most distal marker (MNB71), which
was genotyped in previous projects [24], showed exten-
sive double recombinations with the 12 markers added
in the present project. To reduce possible mapping
errors, we excluded this marker from all subsequent
analyses. Using the build option of the CRI-MAP pro-
gram, we re-estimated the marker distances and order.
The following changes with respect to the public
USDA lin kage map were made: (i) according to the phy-
sical map (i.e. bp position of release Btau_4.0) and con-
firmed by applying the build option of the CRI-MAP
program to our own data, the positions of markers
BM49 and BM733 are inverted (Table 1); (ii) markers
DIK2035 and DIK5277 are both at the same position
(120.85 cM) on the USDA linkage map but, according
to our genotypes and the physical map results, they are
separated, placing DIK2035 (120.38 cM) upstream of
DIK5277 (120.82 cM); (iii) the new marker developed in
this study (LMU0505) is highly informative for linkage
analysis and its relative position between DIK5106 and
ETH152 was estimated by applying the build option of
the CRI-MAP program. The positions of both flanking
markers DIK5106 and ETH152 also changed (Table 1).
Haplotype analysis in a complex pedigree
Using the algorithm implemented into the program
BEAGLE, we haplotyped the 75 animals of the complex
pedigree in Figure 1 with 1 976 SNP on BTA5 that
are informative in the Fleckvieh population. Thus
Awad et al. Genetics Selection Evolution 2011, 43:8
/>Page 6 of 11
reconstructed haplotypes were used to identify families
segregating for the QTL detected in the initial study
[24]. As already shown by the microsatellite analysis,
the grandsires of families G01 and G02 which are het-
erozygous at the QTL, inherited the same haplotype
in the distal region of BTA5 from their ancestor A0
(Figure 1). This was confirmed by the haplotype recon-
struction using the 1 976 SNP. This A0 ancestral hap-
lotype is named “ haplotype 1” or (A0
H1
)anditsA0
alternative haplotype “ ha plotype 2” or (A0
H2
). Family
G03, previously declared as heterozygous for the target
QTL [24] but not identif ied here, has inherited haplo-
types not related to A0
H1
(Figure 1). All animals with
haplotype A0
H1
(surrounding the putative QTL posi-
tion) can be traced back to A0. Two of these, grand-
sires G10 and G11 are paternal and maternal
grandsons of A0, and are very important Fleckvieh bull
sires. We have collected samples of all the available
progeny-tested sons of these two grandsires and all
available progeny-tested maternal grandsons of grand-
sires G01, G02, G10 and G11, to add more recombi-
nant A0 haplotypes into the mapping population. In
total, 48 5 animals were genotyped by the SNP chip
and haplotyped for BTA5. By calculating the indepen-
dent haplotypes in the complex pedigrees, and consid-
ering the traceability of all A0
H1
haplotypes to A0, we
estimated a very low f requency (<0.005) of A0
H1
in the
Fleckvieh population. Consequently, throughout the
rest of this paper, the less frequent putative QTL allele
embedded in this less frequent haplotype is referred to
as the minor QTL allele.
Combined linkage disequilibrium and linkage analysis
Thirty-seven microsatellite marker s (three markers
BM6026, BMS610 and MNB71 showed extensive recom-
binations and were excluded) and the complex pedigree
MSPED2089 were used for initial LDL mapping ana-
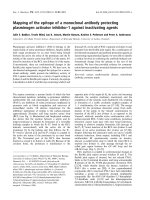
lyses. As shown in Figure 2, we observed a highly signif-
icant QTL effect (LRT = 20 to 22, i.e. P = 0.0000077 to
0.0000027), but were unable to improve the mapping
accuracy because of the presence of two or three peaks.
According to previous results [24], and to the results
obtained in the first part of this study, we have assumed
that haplotype A0
H1
has only introduced one QTL into
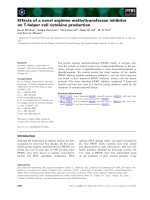
the mapping population. Therefore, we performed a sec-
ond LDL analysis using the 21 mo st distal markers, and
limited to GD and MGS families descending from A0
and known to carry A0
H1
,i.e.pedigreeMSPED1038
(Figure 3). Unlike the analysis of pedigree MSPE D2089,
Figure 3 illustrates a single rather broad peak between
positions 119.005 cM and 120.166 cM. However, this
highly significant QTL (P = 0.000062 to 0.000021) is
still mapped with a lo w accuracy, i.e. 1-LOD drop-off
0
2
4
6
8
10
12
14
16
18
20
22
24
0
10
20
30
40
50
60
70
80
90
100
110
120
130
Position
(
cM
)
L
RT
MY1
PY1
FY1
Figure 2 LDL analysis by variance component approach using
microsatellites in a complex pedigree of 2089 animals. Joint
linkage disequilibrium and linkage (LDL) analysis for three milk yield
traits; Milk Yield (MY1), Milk Protein Yield (PY1) and Milk Fat Yield
(FY1) during first lactation using 37 microsatellites, a complex
pedigree of 2 089 animals, EBV as phenotype and AIREML as
implemented in LDLRAMS and LDL program. Chromosome length in
centiMorgan (cM) on the X-axis, log-likelihood ratio test (LRT) values
on the Y-axis. Solid triangles on the X-axis represent positions of
markers included in the analysis.
0
2
4
6
8
10
12
14
16
18
20
22
24
0
10
20
30
40
50
60
70
80
90
100
110
120
130
Position
(
cM
)
L
RT
MY1
PY1
FY1
Figure 3 LDL analysis by variance component approach using
microsatellites in a complex pedigree of 1 038 animals. Joint
linkage disequilibrium and linkage (LDL) analysis for three milk yield
traits; Milk Yield (MY1), Milk Protein Yield (PY1) and Milk Fat Yield
(FY1) during first lactation using 21 microsatellites covered the most
likely region containing the QTL in the distal part of bovine
chromosome 5 (BTA5), a complex pedigree of 1 038 animals, EBV as
phenotype and AIREML as implemented in LDLRAMS and LDL
program. Chromosome length in centiMorgan (cM) on the X-axis,
log-likelihood ratio test (LRT) values on the Y-axis. Solid triangles on
the X-axis represent positions of markers included in the analysis.
Awad et al. Genetics Selection Evolution 2011, 43:8
/>Page 7 of 11
support intervals are 4.7 cM for FY1, 10.4 cM for PY1
and 11.5 cM for MY1.
Since the confidence interval achieved by LDL ana-
lyses using pedigree MSPED1038 was still too large for a
positional candidate gene approach, we analysed pedi-
gree SNPPED723 using the LDL approach. The results
were similar to t hose obtained with microsatellite mar-
kers and pedigree MSPED2089, namely, multiple peaks
suggesting multiple QTL or no QTL (Figure 4).
To resolve this dilemma, we divided pedigree SNPP
ED723 into pedigree SNPPED421 consisting of all pro-
geny-tested animals descending from ancestor A0, and
pedigree SNPPED308 consisting of the remaining pro-
geny-tested animals. The LDL analyses of SNPPED308
pedigree showed a moderately f lat, non-significant t est
statistic along the investigated chromosomal segment
(Figure 5). Only LRT values for FY1 reached an indica-
tive level of 3.99 (P = 0.046). Conversely, it was possible
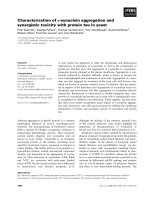
to map a QTL with pedigree SNPPED421 whose minor
allele is most probably originating from ancestor A0
(Figure 6). There were two distinct peaks; one with LRT
values over 17 (P < 0.000037) for both MY1 and PY1 in
a region of 0.5 Mb (from 118.107 to 118.606 Mb), and
one with a very high LRT value for only PY1 (LRT =
20.72, P = 0.0000053) at position 122.115 Mb. Consider-
ing 1-LOD drop-off support intervals, the 97% confi-
dence intervals were located between 117.962 Mb and
119.018 Mb (i.e. 1.056 Mb) for the QTL affecting MY1
0
2
4
6
8
10
12
14
16
18
20
22
24
112
113
114
115
116
117
118
119
120
121
122
123
124
12
5
Position
(
Mb
)
LRT
MY1
PY1
FY1
Figure 4 LDL analysis by variance component approach using
SNP in a complex pedigree of 723 animals. Joint linkage
disequilibrium and linkage (LDL) analysis for three milk yield traits;
Milk Yield (MY1), Milk Protein Yield (PY1) and Milk Fat Yield (FY1)
during first lactation using 240 SNPs covered the most likely region
containing the QTL in the distal part of bovine chromosome 5
(BTA5), a complex pedigree of 723 animals, EBV as phenotype and
AIREML as implemented in LDLRAMS and LDL program.
Chromosome length in Megabase (Mb) on the X-axis, log-likelihood
ratio test (LRT) values on the Y-axis.
0
2
4
6
8
10
12
14
16
18
20
22
24
112
113
114
115
116
117
118
119
120
121
122
123
124
12
5
Position
(
Mb
)
L
RT
MY1
PY1
FY1
Figure 5 LDL analysis by variance component approach using
SNP in a complex pedigree of 308 animals. Joint linkage
disequilibrium and linkage (LDL) analysis for three milk yield traits;
Milk Yield (MY1), Milk Protein Yield (PY1) and Milk Fat Yield (FY1)
during first lactation using 240 SNPs covered the most likely region
containing the QTL in the distal part of bovine chromosome 5
(BTA5), a complex pedigree of 308 animals, EBV as phenotype and
AIREML as implemented in LDLRAMS and LDL program.
Chromosome length in Megabase (Mb) on the X-axis, log-likelihood
ratio test (LRT) values on the Y-axis.
0
2
4
6
8
10
12
14
16
18
20
22
24
112
113
114
115
116
117
118
119
120
121
122
123
124
12
5
Position
(
Mb
)
LRT
MY1
PY1
FY1
A0 Homo
Figure 6 LDL analysis by variance component approach using
SNP in a complex pedigree of 421 animals. Joint linkage
disequilibrium and linkage (LDL) analysis for three milk yield traits;
Milk Yield (MY1), Milk Protein Yield (PY1) and Milk Fat Yield (FY1)
during first lactation using 240 SNPs covering the most likely region
containing the QTL in the distal part of bovine chromosome 5
(BTA5), a complex pedigree of 421 animals, EBV as phenotype and
AIREML as implemented in LDLRAMS and LDL program.
Chromosome length in Megabase (Mb) on the X-axis, log-likelihood
ratio test (LRT) values on the Y-axis. The long homozygous region
(~5 Mb) in ancestor A0 was shown (A0 Homo).
Awad et al. Genetics Selection Evolution 2011, 43:8
/>Page 8 of 11
and PY1, and between 121.800 Mb and 122.200 Mb (i.e.
0.400 Mb) for the QTL affecting only PY1. There were
two additional peaks with LRT values over 15 in regions
around the positions 115.650 and 116.300 Mb, but they
were not included in the 97% confidence interval for
PY1 and were not supported by the highly correlated
MY1 trait.
The two identified peaks (located between 118.107 Mb
and 118.606 Mb and at 122.115 Mb, respectively) may
be due to either the presence of more than one QTL, or
the presence of one QTL with carryover effects to
ano ther region. Thus, a multiple-QTL analysis was per-
formed. T wo-QTL analyses using pedigree SNPPED421
for MY1 and PY1 fitting a QTL at position 118.202 Mb
revealed a single QTL affecting only MY1 at this loca-
tion and an additional QTL affecting PY1 at position
122.115 Mb (P = 0.019). However, two-QTL analyses
accounting for the QTL at position 122.115 Mb did not
rule out a possible second QTL affecting PY1 at position
118.202 Mb (P = 0.019).
Discussion
Theaimofthisstudywastorefinethepositionofa
previously mapped QTL by increasing the marker den-
sity in the region, ta rget sampling of additional families
and adapting fine mapping methods. According to our
previous results [24] and to results from the initial part
of this study, we hypothesized the presence of a minor
QTLallelewithastrongeffect,butataverylowfre-
quency, in the Fleckvieh dual-purpose cattle breed. In
such a situation, random sampling of additional families
for confirmation and fine-mapping purposes can result
in an increased freque ncy of the common QTL allele in
the mapping design Thus, the capacity to differentiate
between genetic background noise and the initially tar-
geted QTL will be de creased. The reduce d accuracy of
QTL position estimates when using all genotyped ani-
mals (pedigrees MSPED2089 or SNPPED723)compared
to a subset of animals (pedigrees MSPED1038 or
SNPPED421) is c ounterintuitive to the general notion
that the use of more information should result in better
estimates. To further explore this unexpected result, we
have investigated several possible explanations, including
the effects of the haplotype distribution and the possibi-
lity of additional QTL. To study the haplotype distribu-
tion in the Fleckvieh population, 485 animals were
genotyped with the Illumina 50 K SNP chip. Of these, a
subset of 144 animals were not progeny-tested and not
relevant for QTL mapping, but were very informative
for the study o f haplotype distribution. In particular,
considering the putative QTL affecting MY1 and PY1
located within the 97% CI (between 117.962 Mb and
119.018 Mb), a haplotype of 25 markers (A0
H1
) covering
this region was detected in 89 of 485 animals. This
haplotype A0
H1
, most probably carrying the minor QTL
allele, could be traced back to the ancestor A0 in all 89
cases (Figure 1). The alternative haplotype A0
H2
,most
probably carrying the common QTL allele, was found in
13 cases but was tra ced back to the ancestor A0 only in
three. A perfect LD between the minor QTL allele and
A0
H1
(and only A0
H1
) would result in a relatively low
allele frequency (0.137) of t he minor QTL allele in phe-
notyped animals of pedigree SNPPED723,andinafre-
quency about double (0 .254) in pedigree SNPPED421.
The mapping results did reflect this difference too.
In contrast, consider the six markers located within the
97% CI (between 121.800 Mb and 122.200 Mb) of the
putative QTL region affecting only PY1. Ancestor A0 is
homozygous for a very long segment of this region i.e.
from positions 118.266 Mb to 123.347 Mb (three SNP
telomeric to the main peak of QTL affecting MY1 and
PY1). This segment of 5.080 Mb includes 109 informative
markers in the Fleckvieh population. Comparison of map-
ping results from pedigrees SNPPED723(Figures 4),
SNPPED421 (F igure 6), and SNPPED308 (Figure 5)
revealed a highly significant QTL allele affecting PY1 only
when the pedigree included families segregating for haplo-
type A0
H1
(see comparison between Figures 4 and 6).
Excluding these families yielded LRT values below 3.99
(P > 0.045) for all three milk yield traits and for the com-
plete investigated region (Figure 5, between 113.500 Mb
and 123.700 Mb). We the refore mainly used the linkage
information in the SNPPED421 pedigree (A0
H1
always
traceable to A0), to map a QTL affecting both MY1 and
PY1 in a 97% CI of 1 Mb.
Haplotype and LDL analyses by microsatellite markers
(Figures 2 and 3) and SNP (Figures 4 and 6) clearly sug-
gest that the minor QTL allele associated with th e puta-
tive QTL around the physical position 118 Mb (97% CI
between 117.962 Mb to 119.018 Mb) has been intro-
duced by ancestor A0 into the mapping population. The
explanation of the second possible QTL that maps to
the physical position 122.115 Mb and affects only PY1 is
different. First, this QTL should also be associated with
ancestor A0 haplotypes, i.e. absence of effect in the
smaller SNPPED308 pedigree (Figure 5). Second, both
ancestor haplotypes at the physical position 122.115 Mb
are most probably identical by descent (i.e. homozygous
for a 5.080 Mb segment with 109 informative SNP).
Therefore, ancestor A0 is most probably homozygous
for the putative QTL at this position too. Third, this
part of the haplotype is not unique to A0, but also seg-
regat es in other families, i.e. there is LD information for
mapping, too. The relatively sharp LRT peak at p osition
122.115 Mb and homozygosity of A0 suggest an essen-
tial contribution of LD to this mapping result. Fourth,
analyses with the two-QTL model did not rule out the
possibility of a second QTL affecting PY1 within the
Awad et al. Genetics Selection Evolution 2011, 43:8
/>Page 9 of 11
candidate region on BTA5. And finally, despite the over-
all presence of haplotypes with a high IBD to ancestor
haplotypes around position 122.115 Mb, the complete
absence of this peak in SNPPED308 pedigree can be
explained by either a novel mutation i n ancestor A0 or
by the incapacity of the method and design used here to
map it in a relatively small pedigree like SNPPED308.
More reasonable explanations may be the lower statisti-
cal power of the pedigree SNPPED308, possible local
inconsistencies in the map order (which was based on
map release Btau_4.0), the presence of a strong QTL at
position 118.000 Mb with carryover effects to other
regions, or a combination of all these explanations.
The LDL analysis using SNPs and pedigree SN PP
ED723 indicate several peaks affecting MY1 and PY1 in
the region inves tigated here. In principle, these results
(Figure 4) a re comparable to the fine-mapping results
reported on BTA3 by Druet et al. [38]. In this study, the
authors have also first carried out mapping by linkage
analysis and finally ended up with LDL analyses and
multiple LRT peaks. We used larger overlapping marker
windows (80 SNP) than Druet et al. [38]. By dividing
the data set according to the results of linkage and hap-
lotype analyses, most of the multiple peaks were
explained as genetic background noise in a larger family
set. The multi ple peak profile could b e explained by the
heterogeneous LD structure within the QTL region or
by the use of LD in the model when there is no LD
information at all [38]. This might be increased by pos-
sible local inconsistencies in the map order, which was
based on the draft assembly, or on comparative map
information. Moreover, the method and the data struc-
ture may not make it possible to discard some regions
even though they do not harbour the QTL [38].
To check for possible effects of the data structure on
the reported mapping results, we tested regression of
EBV on genetic distance from ancestor A0 for all car-
riers of haplotype 1 (A0
H1
). The apparent lack of this
regression suggests that we are looking at a real QTL
effect, and not an artifact of pedigree-tracking.
Searching the region between 117.900 and 119.100 Mb
for candidate genes revealed 27 genes, 13 of which had
no known function. Based on current biological infor-
mation, the genes with partly known function could
only be indirectly related to milk yield traits.
Conclusions
In the present study, we have performed a haplotype-
assisted extension of the mapping design and thus
increased the allele frequency of the minor QTL allele
in mapping families. Alternative analyses with family
subsets resulted in a substantial reduction of the genetic
background noise and an increased frequency of the
minor QTL allele. Using these subsets, we succeeded in
refining the map position of the previously detected
QTL for milk production traits on BTA5 to a 1 Mb
interval. In spite of imple menting a two-QTL analysis,
the possibility of a second QTL affecting only PY1 could
not be ruled out. All in all, the results of both this study
and the previous study by Awad et al. [24] support the
presence of a QTL affecting both MY1 and PY1 that is
close to the centromeric part of the long homozygous
region (~5 Mb) in ancestor A0. Therefore, positional
cloning and high-throughput sequencing of the candi-
date region located between 117.900 Mb and 119.100
Mb should now be considered, but should also not
neglect the second possible QTL around position
122.115 Mb.
Acknowledgements
Ashraf Awad was supported by the Ministry of Higher Education, Egypt. We
thank Stela Masle and Matt North for useful editorial comments. We thank
Tierzuchtforschung e.V. München for providing genome-wide SNP
genotypes of animals related to ancestor A0 and for providing a part of the
DNA samples analysed here. One hundred and seventy-three Fleckvieh
animals not connected with A0 were genome-wide genotyped within the
project ME3404/1-1, gratefully funded by German Research Foundation
(DFG). We thank all breeders and breeding associations who sent us
remaining samples free of charge to support this study. In particular, we
thank Arbeitsgemeinschaft Süddeutscher Rinderzucht-und
Besamungsorganisationen e. V. (ASR) and the Bavarian Gene Reserves at LfL,
Grub, Germany. We also thank the associate editor in charge and the two
reviewers whose comments resulted in substantial improvement of the final
manuscript version.
Author details
1
Chair of Animal Genetics and Husbandry, Faculty of Veterinary Medicine,
Ludwig-Maximilians-University Munich, Veterinärstr .13, 80539 Munich,
Germany.
2
Tierzuchtforschung e.V. München, Senator-Gerauer-Str. 23, D-
85586 Grub, Germany.
Authors’ contributions
AA carried out DNA extraction, microsatellite genotyping; AA and IM
performed all data analysis and wrote the paper; IM and MF designed the
study; IR performed SNP genotyping and partly performed sampling. All
authors read and approved the final manuscript.
Competing interests
The authors declare that they have no competing interests.
Received: 14 July 2010 Accepted: 24 February 2011
Published: 24 February 2011
References
1. Andersson L: Genetic dissection of phenotypic diversity in farm animals.
Nat Rev Genet 2001, 2:130-138.
2. Weiss KM, Terwilliger JD: How many diseases does it take to map a gene
with SNPs? Nat Genet 2000, 26:151-157.
3. Meuwissen THE, Karlsen A, Lien S, Olsaker I, Goddard ME: Fine mapping of
a quantitative trait locus for twinning rate using combined linkage and
linkage disequilibrium mapping. Genetics 2002, 161:373-379.
4. Olsen HG, Lien S, Gautier M, Nilsen H, Roseth A, Berg PR, Sundsaasen KK,
Svendsen M, Meuwissen TH: Mapping of a milk production quantitative
trait locus to a 420-kb region on bovine chromosome 6. Genetics 2005,
169:275-283.
5. Gautier M, Barcelona RR, Fritz S, Grohs C, Druet T, Boichard D, Eggen A,
Meuwissen TH: Fine mapping and physical characterization of two linked
quantitative trait loci affecting milk fat yield in dairy cattle on BTA26.
Genetics 2006, 172:425-436.
Awad et al. Genetics Selection Evolution 2011, 43:8
/>Page 10 of 11
6. Grisart B, Coppieters W, Farnir F, Karim L, Ford C, Berzi P, Cambisano N,
Mni M, Reid S, Simon P, Spelman R, Georges M, Snell R: Positional
candidate cloning of a QTL in dairy cattle: identification of a missense
mutation in the bovine DGAT1 gene with major effect on milk yield and
composition. Genome Res 2002, 12:222-231.
7. Winter A, Kramer W, Werner FA, Kollers S, Kata S, Durstewitz G, Buitkamp J,
Womack JE, Thaller G, Fries R: Association of a lysine-232/alanine
polymorphism in a bovine gene encoding acyl-CoA: diacylglycerol
acyltransferase (DGAT1) with variation at a quantitative trait locus for
milk fat content. Proc Nat Acad Sci USA 2002, 99:9300-9305.
8. Blott S, Kim JJ, Moisio S, Schmidt-Kuntzel A, Cornet A, Berzi P, Cambisano N,
Ford C, Grisart B, Johnson D, Karim L, Simon P, Snell R, Spelman R, Wong J,
Vilkki J, Georges M, Farnir F, Coppieters W: Molecular dissection of a
quantitative trait locus: a phenylalanine-to-tyrosine substitution in the
transmembrane domain of the bovine growth hormone receptor is
associated with a major effect on milk yield and composition. Genetics
2003, 163:253-266.
9. Cohen-Zinder M, Seroussi E, Larkin DM, Loor JJ, Everts-van der Wind A,
Heon-Lee J, Drackley JK, Band MR, Hernandez AG, Shani M, Lewin HA,
Weller JI, Ron M: Identification of a missense mutation in the bovine
ABCG2 gene with a major effect on the QTL on chromosome 6 affecting
milk yield and composition in Holstein cattle. Genome Res 2005,
15:936-944.
10. Khatkar MS, Thomson PC, Tammen I, Cavanagh JA, Nicholas FW,
Raadsma HW: Linkage disequilibrium on chromosome 6 in Australian
Holstein-Friesian cattle. Genet Sel Evol 2006, 38:463-477.
11. Khatkar MS, Zenger KR, Hobbs M, Hawken RJ, Cavanagh JAL, Barris W,
McClintock AE, McClintock S, Thomson PC, Tier B, Nicholas FW,
Raadsma HW: A primary assembly of a bovine haplotype block map
based on a 15,036-single-nucleotide polymorphism panel genotyped in
Holstein-Friesian cattle. Genetics 2007, 176:763-772.
12. Gautier M, Faraut T, Moazami-Goudarzi K, Navratil V, Foglio M, Grohs C,
Boland A, Garnier JG, Boichard D, Lathrop GM, Gut IG, Eggen A: Genetic
and haplotypic structure in 14 European and African cattle breeds.
Genetics 2007, 177:1059-1070.
13. Meuwissen THE, Goddard ME: Fine mapping of quantitative trait loci
using linkage disequilibrium with closely linked marker loci. Genetics
2000, 155:421-430.
14. Hedrick PW: Gametic disequilibrium measures: Proceed with caution.
Genetics 1987, 117:331-341.
15. Farnir F, Coppieters W, Arranz JJ, Berzi P, Cambisano N, Grisart B, Karim L,
Marcq F, Moreau L, Mni M, Nezer C, Simon P, Vanmanshoven P,
Wagenaar D, Georges M: Extensive genome-wide linkage disequilibrium
in cattle. Genome Res 2000, 10:220-227.
16. Tenesa A, Knott SA, Ward D, Smith D, Williams JL, Visscher PM: Estimation
of linkage disequilibrium in a sample of the United Kingdom dairy cattle
population using unphased genotypes. J. Anim. Sci 2003, 81(3):617-623
[ />17. Lipkin E, Straus K, Tal Stein R, Bagnato A, Schiavini F, Fontanesi L, Russo V,
Medugorac I, Foerster M, Sölkner J, Dolezal M, Medrano JF, Friedmann A,
Soller M: Extensive long-range and non-syntenic linkage disequilibrium
in livestock populations: deconstruction of a conundrum. Genetics 2009,
181:691-699.
18. Bovine HapMap Consortium: Genome-wide survey of SNP variation
uncovers the genetic structure of cattle breeds. Science 2009,
324
:528-531.
19. Tenesa A, Navarro P, Hayes BJ, Duffy DL, Clarke GM, Goddard ME,
Visscher PM: Recent human effective population size estimated from
linkage disequilibrium. Genome Res 2007, 17:520-526.
20. Lindblad-Toh K, Wade CM, Mikkelsen TS, Karlsson EK, Jaffe DB, Kamal M,
Clamp M, Chang JL: Genome sequence, comparative analysis and
haplotype structure of the domestic dog. Nature 2005, 438:803-819.
21. Goddard ME, Meuwissen THE: The use of linkage disequilibrium to map
quantitative trait loci. Aust J Exp Agric 2005, 45:837-845.
22. Bennewitz J, Reinsch N, Grohs C, Leveziel H, Malafosse A, Thomsen H, Xu N,
Looft C, Kuhn C, Brockmann GA, Schwerin M, Weimann C, Hiendleder S,
Erhardt G, Medjugorac I, Russ I, Forster M, Brenig B, Reinhardt F, Reents R,
Averdunk G, Blumel J, Boichard D, Kalm E: Combined analysis of data from
two granddaughter designs: A simple strategy for QTL confirmation and
increasing experimental power in dairy cattle. Genet Sel Evol 2003,
35:319-338.
23. Ashwell MS, Heyen DW, Sonstegard TS, Van Tassell CP: Detection of
quantitative trait Loci affecting milk production, health, and
reproductive traits in Holstein cattle. J Dairy Sci 2004, 87:468-475.
24. Awad A, Russ I, Emmerling R, Förster M, Medugorac I: Confirmation and
refinement of a QTL on BTA5 affecting milk production traits in the
Fleckvieh dual purpose cattle breed. Anim Genet 2010, 41:1-11.
25. Kolbehdari D, Wang Z, Grant JR, Murdoch B, Prasad A, Xiu Z, Marques E,
Stothard P, Moore SS: A whole genome scan to map QTL for milk
production traits and somatic cell score in Canadian Holstein bulls. J
Anim Breed Genet 2009, 126:216-227.
26. Emmerling R, Lidauer M, Mäntysaari EA: Multiple lactation random
regression test-day model for Simmental and Brown Swiss in Germany
and Austria. Interbull Bull 2002, 29:111-117.
27. Ihara N, Takasuga A, Mizoshita K, Takeda H, Sugimoto M, Mizoguchi Y,
Hirano T, Itoh T, Watanabe T, Reed KM, Snelling WM, Kappes SM,
Beattie CW, Bennett GL, Sugimoto Y: A comprehensive genetic map of
the cattle genome based on 3802 microsatellites. Genome Res 2004,
14:1987-1998.
28. Browning BL, Browning SR: A unified approach to genotype imputation
and haplotype phase inference for large data sets of trios and unrelated
individuals. Am J Hum Genet 2009, 84:210-223.
29. Green P, Falls K, Crooks S: Documentation for CRI-MAP, Version 2.4
Washington University School of Medicine, St. Louis; 1990.
30. Lee SH, van der Werf JH: The efficiency of designs for fine-mapping of
quantitative trait loci using combined linkage disequilibrium and
linkage. Genet Sel Evol 2004, 36:145-161.
31. Lee SH, Van der Werf JH: The role of pedigree information in combined
linkage disequilibrium and linkage mapping of quantitative trait loci in a
general complex pedigree. Genetics 2005, 169:455-466.
32. Lee SH, Van der Werf JH: An efficient variance component approach
implementing average information REML suitable for combined LD and
linkage mapping with a general complex pedigree. Genet Sel Evol 2006,
38:25-43.
33. Olsen HG, Meuwissen THE, Nilsen H, Svendsen M, Lien S: Fine mapping of
quantitative trait loci on bovine chromosome 6 affecting calving
difficulty. J Dairy Sci 2008, 91:4312-4322.
34. Jansen RC: Interval mapping of multiple quantitative trait loci. Genetics
1993, 135:205-211.
35. Johnson DL, Thompson R: Restricted maximum likelihood estimation of
variance components for univariate animal models using sparse matrix
techniques and average information. J Dairy Sci 1995, 78:449-456.
36. Olsen HG, Lien S, Svendsen M, Nilsen H, Roseth A, Aasland OM,
Meuwissen TH: Fine mapping of milk production QTL on BTA6 by
combined linkage and linkage disequilibrium analysis. J Dairy Sci 2004,
87:690-698.
37. Mangin B, Goffinet B, Rebai A: Constructing confidence intervals for QTL
location. Genetics 1994, 138:1301-1308.
38. Druet T, Fritz S, Boussaha M, Ben-Jemaa S, Guillaume F, Derbala D,
Zelenika D, Lechner D, Charon C, Boichard D, Gut IG, Eggen A, Gautier M:
Fine mapping of quantitative trait loci affecting female fertility in dairy
cattle on BTA03 using a dense single-nucleotide polymorphism map.
Genetics 2008, 178:2227-2235.
doi:10.1186/1297-9686-43-8
Cite this article as: Awad et al.: Mapping of a milk production
quantitative trait locus to a 1.056 Mb region on bovine chromosome 5 in
the Fleckvieh dual purpose cattle breed. Genetics Selection Evolution 2011
43:8.
Awad et al. Genetics Selection Evolution 2011, 43:8
/>Page 11 of 11