Báo cáo sinh học: " Quantitative trait loci analysis for leg weaknessrelated traits in a Duroc × Pietrain crossbred population" potx
Bạn đang xem bản rút gọn của tài liệu. Xem và tải ngay bản đầy đủ của tài liệu tại đây (309.57 KB, 7 trang )
RESEARCH Open Access
Quantitative trait loci analysis for leg weakness-
related traits in a Duroc × Pietrain crossbred
population
Watchara Laenoi
1
, Muhammad Jasim Uddin
1
, Mehmet Ulas Cinar
1
, Christine Große-Brinkhaus
1
, Dawit Tesfaye
1
,
Elisabeth Jonas
1,2
, Armin M Scholz
3
, Ernst Tholen
1
, Christian Looft
1
, Klaus Wimmers
4
, Chirawath Phatsara
1,5
,
Heinz Juengst
1
, Helga Sauerwein
1
, Manfred Mielenz
1
and Karl Schellander
1*
Abstract
Background: Leg weakness issues are a great concern for the pig breeding industry, especially with regard to
animal welfare. Traits associated with leg weakness are partly influenced by the genetic background of the animals
but the genetic basis of these traits is not yet fully understood. The aim of this study was to identify quantitative
trait loci (QTL) affecting leg weakness in pigs.
Methods: Three hundred and ten F
2
pigs from a Duroc × Pietrain resource population were genotyped using 82
genetic markers. Front and rear legs and feet scores were based on the standard scoring system. Osteochondrosis
lesions were examined histologically at the head and the condylus medialis of the left femur and humerus. Bone
mineral density, bone mineral content and bone mineral area were measured in the whol e ulna and radius bones
using dual energy X-ray absorptiometry. A line-cross model was applied to determine QTL regions associated with
leg weakness using the QTL Express software.
Results: Eleven QTL affecting leg weakness were identified on eight autosomes. All QTL reached the 5%
chromosome-wide significance level. Three QTL were associated with osteochondrosis on the humerus end, two
with the fore feet score and two with the rear leg score. QTL on SSC2 and SSC3 influencing bone mineral content
and bone mineral density, respectively, reached the 5% genome-wide significance level.
Conclusions: Our results confirm previous studies and provide information on new QTL associated with leg
weakness in pigs. These results contribute towards a better understanding of the genetic background of leg
weakness in pigs.
Background
Leg weakness (LW) has a great impact on fitness and
longevity of animals, which influences not only animal
welfare but also production and reproduction perfor-
mance. It has been shown that between 20 and 50% of
boars completing performance tests are rejected as
breeding animals because of LW problems [1]. Genetic
correlations between LW-related traits and longevity in
breeding sows have been reported and suggest that a
better leg status would decrease involuntary culling
[2,3]. Heritability estimates have been reported for LW
in Duroc, Landrace, and Yorkshire sires i.e. 0.23, 0.30
and 0.39, respectively [4], and for an overall leg score in
Landrace and Large White sows, i.e. 0.27 and 0.38,
respectively [2]. In addition, osteochondrosis (OC) is
regarded as the main cause of LW in pig [5,6]. OC is a
skeletal disease characterized by disturbed bone forma-
tion, cartilage retention, or necrosis of the cartilage
canal in articular cartilage [7,8] and results in economic
losses mainly due to the culling of pigs in the breeding
industry [9]. The disease occurs at high frequencies in
growing pigs in all commercial breeds [10]. The esti-
mated heritability of OC ranges from 0 .06 to 0.5
[2,5,11,12] in different pig breeds. Moreover, OC is
* Correspondence:
1
Institute of Animal Science, University of Bonn, Endenicher Allee 15, 53115
Bonn, Germany
Full list of author information is available at the end of the article
Laenoi et al. Genetics Selection Evolution 2011, 43:13
/>Genetics
Selection
Evolution
© 2011 Laenoi et al; licensee BioMed Central Lt d. This is an Open Access article distributed under the terms of the Creative Commons
Attribution License ( g/li censes/by/2.0), which permits unrestricted use, distribution, and reproduction in
any medium, provided the original wor k is properly cited.
reported to have negative effects on important perfor-
mance traits such as sow longevity, growth and feed
conversion rate [12,13].
In addition to OC, bone mineral density (BMD) is
generally regarded as an i mportan t parameter to assess
bone growth and is associated with bone fracture risk
and structural soundness in pigs. Studies in humans
have shown that variation in BMD can be explained by
genetic factors [14,15]. Taken together, all the data
reported so far imply that LW-related traits have a low
to moderate heritability. Nevertheless, genetic studies of
LW-related trait s in growing and finishing pigs are lim-
ited. A significant number of QTL for performance
traits has been reported in pigs [16] but few studies
have been devoted to LW-related traits [17-21]. There-
fore, the aim of this study was to investigate QTL for
LW-related traits, including leg and feet scores, OC and
bone mineral traits in a Duroc × Pietrain resource
population.
Methods
Experimental animal population
In this study, we used 310 F
2
pigs from a Duroc × Pie-
train resource populatio n comprising three generatio ns,
Parent (P), F
1
,andF
2
pigs, and which had been pre-
viously analysed to detect QTL for growth, carcass and
meat quality traits [22]. The F
2
pigs were generated by
mating six F
1
males with 25 F
1
females. All animals
were maintained at the Frankenforst experimental
research farm at the University of Bonn. Piglets were
weaned at 28 days of age, males were castrated prior to
weaning and placed in pens in the post-weaning unit
until 10 weeks of age. The F
2
pigs were given an ad libi-
tum diet during the whole test period and were
slaughtered at approximately 105 kg live weight at
around 25-26 weeks of age in the slaughterhouse of the
research farm Schwarzenau in Bavaria, Germany. Tissue
samples from the tail were collected within the first
week after birth for DNA isolation.
Phenotyping
Before slaughter, legs and feet were scored by the same
person, using the criteria listed in additiona l file 1, Table
S1 as guidelines to make assessments. The traits were
recorded according to the rules of German performance
stations [23]. Each ‘ leg score’ is an assessment of the
strength and straightness of the legs and of the stability
of the joints. Leg scores ranged from 1 to 5, the optimum
level being 3. Data were then transformed into a de sir-
ability scale, by using the absolute value of the original
scores after subtracting three scores (score 3 becomes 0
for optimum leg score, sco re 2 and 4 become 1 for mod-
erate leg score, and score 1 and 5 become 2 for poor leg
score ). For feet, the angle and strength of feet/leg attach-
ment, soundness of toes and weight distribution o n toes
were assessed a nd given a score value between 1 (poor)
and 3 (good). Leg and feet scores were measured on pigs
walking on a solid concrete floor. After slaughter, the left
fore and rear legs were removed from the carcass to
carry out histological examinatio ns of OC lesions. As OC
is a bilaterally symmetrical syndrome, it was decided to
examine only the left legs. The recorded OC lesions were
scored1to4,4fornormaland3to1formildlyto
severely affected (Additional file 1, Figure 1). OC lesions
were evaluated on the head of the humerus (HH), condy-
lus medialis humeri (CMH), head of the femur (HF) and
the condylus medialis femoris (CMF). The histological
examination assessed cartilage thickness, cartilage
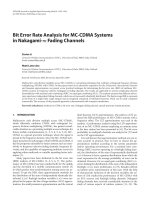
Figure 1 Evidence of QTL for leg weakness related traits on SSC 2 and 3. Marker positions along each chromosome are indicated in cM on
the x-axis, and F values are given along the y-axis; 5% chromosome-wide (dotted line), and 1% chromosome-wide (solid line).
Laenoi et al. Genetics Selection Evolution 2011, 43:13
/>Page 2 of 7
degradation and the vessel structure of cartilage canals.
The histological procedures that were used have been
described by Laenoi et al. [24]. The number of animals
with OC on different joints ranged between 274 and 279
(Table 1). A total of 1,108 samples (532 from castrated
and 576 from female pigs) out of 1,240 samples were
phenotyped. In addition, the whole ulna and radius bones
from the left carcass were stripped of all surrounding tis-
sues and the bone mineral-related traits (BMD, BMC and
BMA) were examined using dual energy X-ray absorptio-
metry (DXA ) [25] . In total 275 animals wer e phenotyped
for the DXA traits (Table 2).
Genotyping
Markers used for genotyping were mainly selected
from the USDA/MARC map (a.
gov) and included 79 microsatellites and three biallelic
markers. Marker order and genetic distances between
markers are described in additional file 2, Table S2.
Genotyping, electrophoresis, and allele determination
were carried out with a LI-COR 4200 Automated
Sequencer (DNA Analyzer, GENE reader 4200). Allele
and genotyping errors were checked using Pedcheck
software (v 1.1) [26]. In addition to the microsatellite
markers, SNP in genes assumed to affect cartilage
quality were included, i.e. SNP located in the
COL10A1 and MMP3 genes. Sequences were obtaine d
from GenBank (accession no AF222861 and FJ788664
for porcine COL10A1 and MMP3, respectively) and
assays were designed to permit genotyping using a
multiplex SNP genotyping platform (Beckman Coul-
ter). The relative positions of the markers were
assigned using the build, two-point and fixed options
of CRIMAP software, version 2.4 [27]. Recombination
units were converted into map distances using the
Kosambi mapping function. Marker information con-
tent and segregation distortion were tested. A linkage
map was constructed with a total length of 2588.7 cM
and an average marker interval of 31.57 cM.
Statistical analysis
Thedatawereanalysedusingthesoftwarepackage
SAS
®
(v 9.2, SAS
®
Inc., CA, USA). Ge neralized linear
models (PROC GLM) were used to identify the effects
of sire, dam, age, sex, birth weight, daily weight gain, lit-
ter size, litter effect, parity, season, and of carcass weight
and length at slaughter on the investigated traits (Addi-
tional file 3, Table S3).
F
2
QTL interval mapping was performed using the
web-based p rogram QTL Express [28] available at
The basic QTL regression model
used in the present study was:
y
i
= μ +F
i
+ β cov
i
+c
ai
a+c
di
d+ε
i
where: y
i
= phenotype of the i
th
offspring; μ =overall
mean; F
i
= fixed effect of litter; b = regression coeffi-
cient on the covariate; co v
i
= covariate of average daily
gain for leg and feet score age for OC, and slaughter
weight and carcass length for DXA; c
ai
= additive coeffi-
cient of the i
th
individual at a putative QTL; c
di
= domi-
nance coefficient of the i
th
individual at a putative QTL;
a = additive effect of the putative QTL; d = dominance
effect of the putative QTL; and ε
i
= residual error.
The regression model was fitted at 1-cM intervals
along each chromosome and the F-value for the QTL
effect was calc ulated at each point. Thresholds for chro-
mosome-wide significance were determined by 1000
data permutations [29] for individu al chromosomes. Sig-
nificance at the 5% chromosome-wide (CW) level was
considered suggestive, 1 % CW was considered signifi-
cant and significance at the 5% genome-wide (GW) level
as highly significant. To derive GW significance levels
from the chromosome-wide significance levels, the Bon-
feroni correction was applied [30]. Empirical 95%
Table 1 Statistics of LW-related traits and phenotypic correlations between traits
Traits
1
N Mean SD Min Max Phenotypic correlation with traits
FLS RLS FFS RFS HH CMHM HF CMF
FLS 310 2.65 1.08 1 5 0.28 0.23 0.22 0.08 -0.02 0.02 -0.04
RLS 310 2.70 0.66 1 5 0.23 0.19 -0.08 -0.003 -0.003 -0.05
FFS 310 2.02 0.45 1 3 0.44 -0.08 -0.12 0.01 -0.07
RFS 310 2.53 0.53 1 3 -0.01 -0.06 0.04 -0.13
HH 278 1.78 0.78 1 4 0.12 0.07 -0.007
CMH 279 1.82 0.95 1 4 0.11 -0.07
HF 274 1.98 0.84 1 4 -0.10
CMF 277 2.59 1.09 1 4
1
FLS = fore leg score; RLS = rear leg score; FFS = fore feet score; RFS = rear feet score; HH = OC score at head of humerus; CMH = OC score at condylus medialis
humeri; HF = sc ore OC at head of femur; CMF = score OC at condylus medialis femori.
Laenoi et al. Genetics Selection Evolution 2011, 43:13
/>Page 3 of 7
confidence intervals (CI) and flanking markers for esti-
mated QTL positions were obtained by applying the
bootstrap approach with 1000 re-samplings [27]. The
percentage of phenotype variation explained by a QTL
was calculated as:
V
ar% =
M
S
R
− M
S
F
MS
R
× 10
0
where, MS
R
is the mean sq uare of the reduced model
without QTL ef fects and MS
F
is the mean square of the
full model.
Results
Distributions and correlation of the traits
Descriptive statistics of LW-related traits are given in
Tables 1 and 2. It is important to note that in this
study the direction of a desirable score is the differ-
ence between leg and feet scores and OC scores. For
leg score, a low value is desirable but for feet and OC
scores a high value is desirable. A high percentage of
animals showed moderate fore feet scores (FFS)
(79.4%) and good rear feet scores (RFS) (54.5%). Only
9.0% and 1.3% of animals showed poor feet scores for
fore and rear feet, respectively. For the fore leg score
(FLS), 42.3% of animals had a score value of 2 and for
the rear leg score (RLS), 54.8% of animals had a score
value of 3. Few animals had very poor leg scores (4.8%
for fore leg and 0.3% for rear leg). Phenotypic correla-
tions among FLS, RLS, FFS and RFS were low to med-
ium, ranging from 0.19 to 0.44 (Table 1). The
percentage of severe OC lesions in the 1,108 cartilage
samples was higher in the CMF of the knee joint com-
pared to other joints. The CMH and HH of fore limbs
had healthier scores than CMF and H F. Phenotypic
correlations among OC scores were very low, ranging
from -0.13 to 0.12 (Table 1). BMD and BMC were not
significantly different between castrated male pigs and
female pigs (Table 2). The phenotypic correlation
between BMD and BMC was positive (r = 0.70, P <
0.01). Parity, carcass length, weight at slaughter, age
and average daily gain ha d significant (P < 0.05) effects
on the measured traits (Table S2). Parity, carcass
length and average daily gain had significant (P < 0.05)
effects on FLS but only average daily gain (ADG) had
an effect on RLS. Parity showed effects on FFS, HH,
CMH and HF. Age also had an effect on HF. Parity,
carcass length and weight at slaughter affected all
DXA traits. BMD and BMC were highly correlated
(P < 0.01) with the animals’ weight at slaughter (r =
0.54 and 0.71, respectively).
QTL for leg weakness-related traits
The results of the QTL analysis are given in Table 3.
Eleven QTL were identified for LW-related traits on
eight autosomes. Most QTL had highly significant domi-
nance effects and three QTL were additive. Two chro-
mosomal regions were identified for FFS (P ≤ 0.05,
CW), at 166 cM on SSC1 and at 36 cM on SSC16. Two
QTL, at 87 cM (P ≤ 0.05, CW) on SSC6 and at 26 cM
on SSC18, were identified for RLS. No QTL was found
for rear feet score and fore leg score. QTL associated
with OC were located on SSC2, 3, 6, 10 and 14. The
OC score of HH was influenced by three QTL regions,
on SSC2, 3, and 6 at 14, 13 and 61 cM, respectively. A
QTL for CMH was identified at 0 cM on SSC14. One
QTL affecting OC score of CMF was identified on
SSC10at70cM.However,nosuggestiveQTLwas
found for OC score of HF. Two QTL were identified for
bone mineral-related traits, one for BMD and one for
BMC. A QTL for B MD was found on SSC3 at 71 c M.
Only one QTL was detected for BMC, a t 0 cM on
SSC2. Both QTL for BMD and BMC reached a 5% GW
significance.
In this study, most of the detected QTL appeared to
have effects on only one trait, showing no effects on
other traits. However, some chromosomal regions influ-
enced more than one trait, notably on SSC2, 3 and 6.
Discussion
In this study, we evaluated conformation traits describ-
ing leg and feet condition, osteochondrosis score and
bone mineral density, which are important in selection
to reduce the risk of leg weakness in pigs. However, the
genetics of LW-related traits is complex [12,31]. A num-
ber of factors are known to influence the development
of LW, such as nutrition imbalance, high body weight,
rapid growth rate, bone and joint diseases, bad body and
leg structure, and mechanical stress [11,13]. Moreover, it
has been reported that the degree of LW and OC may
berelatedtothebreedandsexofanimals[32].
Table 2 Statistics of DXA phenotypes
Traits
1
Total (n = 275) Females (n = 145) Castrated males (n = 130)
Mean ± SD Min Max Mean ± SD Min Max Mean ± SD Min Max
BMD (g/cm
2
) 0.96 ± 0.08 0.69 1.25 0.95 ± 0.07 0.79 1.172 0.96 ± 0.09 0.69 1.25
BMC (g) 66.72 ± 7.07 45.53 87.36 66.38 ± 6.03 45.53 83.29 67.02 ± 7.69 48.42 87.36
BMA (cm
2
) 69.67 ± 5.26 55.91 84.64 69.75 ± 5.22 55.91 84.64 69.62 ± 5.36 57.36 83.29
1
BMD = bone mineral density, BMC = bone mineral content, BMA = bone mineral area, n = number of animals.
Laenoi et al. Genetics Selection Evolution 2011, 43:13
/>Page 4 of 7
However, in our study there was no effect of gender on
LW-related traits, which implies that frequencies of LW
and OC vary and depend on the genetic background of
the animals [33]. It has been reported that the Duroc
pure breed shows the highest incidence of OC com-
pared to other European pig breeds ( Pietrain, Landrace
and Yorkshire) [32]. Our data suggest that the unfavour-
able QTL allele for O C originates from both Duroc and
Pietrai n breeds (i.e. two QTL originated from the Duroc
and three from the Pietrain) (Table 3) and that in
Duroc and Pietrain crossbred animals, the fore legs are
less susceptible to OC than the rear legs. Andersson-
Eklund et al. [17] have also reported lower OC inci-
dences in the humerus than in the femur in a Wild boar
× Large White population. In addition, our data show
that the frequency of OC is high (31.05%) at CMF,
which agrees with a previous report of 30.0% by Kadar-
mideen et al. [12].
QTL analyses for le g weakness and bone-related traits
have been perf ormed in diffe rent pig breeds, including
Landrace purebred [34], White Duroc × Erhualian
[19,21], Large White × Meis han [20], Duroc × Landrace
and Duroc × Large White crossbred [18], and Wild boar
× Large White [17]. To the best of our knowledge, our
study is the first to map QTL for LW-related trai ts in a
Duroc and Pietrain intercross. We have identified 11
QTL some of which being novel and some confirming
previous studies [17-21,34], as described in the next sec-
tion. However, l arge confidence regions were obtained
in this experiment, which represents a common problem
in QTL studies and hampers the comparison of QTL
results and their interpretation in terms of causative
genes, since large confidence intervals can contain many
potential candidate genes [35].
In this study, a QTL for FFS was detected on SSC1 at
166 cM. QTL for the same trait have been reported at
89 cM in a Landrace purebred [34] and at 52 cM in a
Large White × Meishan intercross [20] on the same
chromosome. The dominant QTL for FFS found on
SSC16 a t 36 cM is cl ose to a previously reported domi-
nant QTL at 27 cM for rear leg score [19]. The QTL
identified for RLS on SSC6 and SSC18 are new and do
not overlap with any previous study. A QTL associated
with rear leg score was observed on SSC6, close to mar-
ker SW193 (SSC6q2.1), where the gene for trans forming
growth factor-beta 1 (TGFb1) is located [36]. This gene
is an important candidate for LW-related traits since
TGFb1 is a potent regulator of cell proliferation and
influences the size and shape of the limb [37]. We iden-
tified a QTL for the OC score at HH on SSC2 at 14
cM, while Christensen et al. [18] have reported QTL
associated with cartilage thickening of the medial part of
condylus humeri at 15 cM on the same chromosome. In
addition, a QTL with dominance effect identified for the
OC score at HH on SSC6 at 61 cM is located close to
previously repo rted QTL for depression of the proximal
edge of the radius at 51 cM [18] and for physis score at
75 cM [20]. QTL for HH on SSC3 at 13 cM and for
CMH on SSC14 at 0 cM are new QTL (Figure 1). Inter-
estingly, the QTL for CMF on SSC10 at 70 cM is close
toapreviouslyidentifiedQTLregionsat75cMforOC
lesion in the subchondral bone of the medial part of
condylus humeri and at 83 cM for fissure between carti-
lage and bone in pigs [18]. The QTL on SSC2 at 0 cM,
close to marker SW2443 (SSC2p17), was the only QTL
detected for BMC. One of the highest linkage associa-
tions, reaching a 5% GW significance, was found on
SSC3 at 71 cM for BMD. A potential candidate gene in
Table 3 Summary of QTL detected for LW-related traits that exceed suggestive linkage
SSC
a
Trait
b
POS
c
F
d
a±se
e
d±se
f
Var%
g
CI95
h
Closest markers
i
1 FFS 166 5.06* -0.15 ± 0.05 0.16 ± 0.09 4.38 35.0 - 206.5 S0155
2 BMC 0 7.65** -2.17 ± 0.61 3.72 ± 1.97 6.82 0.0 - 92.5 SW2443
2 HH 14 4.75* 0.39 ± 0.13 -0.59 ± 0.48 4.25 0.0 - 103.0 SW2443
3 BMD 71 6.77** -0.04 ± 0.01 -0.02 ± 0.02 6.09 0.0 - 95.5 SW2570-S0002
3 HH 13 6.17* -0.04 ± 0.11 0.70 ± 0.21 5.45 0.0 - 69.5 SW72-S0164
6 RLS 87 5.82* 0.09 ± 0.06 0.36 ± 0.12 5.00 27.0 - 147.5 SW193
6 HH 61 5.49* -0.23 ± 0.09 -0.39 ± 0.18 4.88 29.0 - 150.0 S0087
10 CMF 70 5.15* 0.41 ± 0.13 0.05 ± 0.18 4.61 8.5 - 97.0 S0070
14 CMH 0 6.36* -0.26 ± 0.09 -0.34 ± 0.14 5.56 0.0 - 43.0 SW857
16 FFS 36 6.01* 0.18 ± 0.09 0.85 ± 0.29 5.16 16.5 - 146.0 SW857
18 RLS 26 4.84* -0.37 ± 0.12 -0.11 ± 0.36 4.20 0.0 - 112.0 SW1023-SW787
a
Sus scrofa chromosome;
b
trait abbreviations: FLS = fore leg score, RLS = rear leg score, FFS = fore feet score, RFS = rear feet score, HH = OC score at the head of
the humerus, CMH = OC score at condylus medialis humeri, HF = OC score at the head of the femur, CMF = OC score at condylus medialis femori, BMD = bone
mineral density, BMC = bone mineral contents;
c
chromosomal position in Kosambi cM;
d
significance of the QTL: * significant on a chromosome-wide level with
P ≤ 0.05; ** significant on a chromosome-wide level with P ≤ 0.01; *** significant on a genome-wide level with P ≤ 0.05;
e
additive effect and standard error:
positive values indicate that Duroc alleles result in higher values than Pietrain alleles; negative values indicate that Duroc alleles result in lower values than
Pietrain alleles;
f
dominance effect and standard error;
g
percentage of phenotypic variance explained by the QTL;
h
95% confidence interval;
i
closest marker to the
QTL peak.
Laenoi et al. Genetics Selection Evolution 2011, 43:13
/>Page 5 of 7
this chromosomal region is the follicle-stimulating hor-
mone receptor (FSHR) gene, which directly regulates
bone mass [15]. These QTL for BMC and BMD are
novel and do not overlap with previously reported QTL.
Most of the identified QTL show large dominance
effects rather than additive affects (Table 3). It is impor-
tant to note that the transformation done on the leg
score traits in this study did not change the identified
QTL regions since the interval mapping results for these
traits using the original score ranging from 1-5 or the
scale 0-2 were the same. This implies that the transfor-
mation done on the leg score is not the reason for over-
dominance in this experiment.
In another QTL study in the same population, 31 of
71 QTL for growth, fatness, leanness and meat quality
traits have also shown high dominance effects [22], as
well as QTL for immune traits [38]. Lee et al. [20] have
also reported that most QTL for LW-related traits in a
Large white × Meishan cross show do minance. In addi-
tion, using principal components analysis, Andersson-
Eklund et al. [17] have identified a QTL for OC with a
significant and large effect of over-domina nce. There-
fore, the results from this study and from previous stu-
dies reported in the literature [17-20,34] suggest that
dominanceplaysaroleinthegeneticcontrolofLW-
related traits.
Most of the traits analysed in this study are categorical
rather than normally distributed. Previous studies have
shown that the QTL an alysis method [39] used is suita-
ble for categorical traits, with little loss of power [19,20].
The low heritability of these traits indicates that they
may be complex traits and may be under a polygenic
control primarily by non-additive gene action or affected
by a major gene with Mendelian transmission [31]. In
this study, most of the QTL were identified as single-
trait regions. This could be explained by the low pheno-
typic correlations observed between the traits in the
population.
Conclusions
This is the first study identifying QTL affecting leg
weakness and its related traits i n a fast growing cross
bred pig population between the Duroc and Pietrain
breeds. Multiple QTL were detected for leg and feet
scores, implying that these traits are controlled by multi-
ple genes and that information from more than one
QTL must be incorporated in selection procedur es. Our
results reveal novel QTL regions on SSC2 for BMC, on
SSC3 for HH, on SSC6 and SSC18 for RLS, and on
SSC14 for CMH, and also support some previously
reported QTL regions. Although confidence intervals
are large, these results will help to fine-map and identify
candidate genes in these Q TL regions using additional
markers or gene polymorphisms located in the identified
regions for LW-related traits in pigs.
Additional material
Additional file 1: Table S1 - Basis of scoring for legs, feet and
osteochondrosis. criteria used in this study to determine leg, feet and
osteochondrosis scores Figure S1 - Sample of histological templates for
the evaluation of OC score OC lesions are classified into four score
values: (1) massive alterations of the cartilage including necrotic or
ossified areas, (2) severe changes in the surface and deeper area of the
articular cartilage like surface erosion, fibrillations, hyperplasia and
chondrocyte necrosis, (3) cartilage shows few changes in surface and
fibrillation, (4) cartilage surface is smooth, the matrix and chondrocytes
are well organized with only a marginally rough surface or a weakly
eosinophilic matrix or fibrillation.
Additional file 2: Table S2 - Markers used in the QTL analysis and
genetic map as established from the DuPi resource population.
a
numbers in brackets at the first and last marker are relative positions of
those in the USDA-MARC v2 linkage map;
b
S0226 not covered by USDA-
MARC v2, but SW14, which is closely linked to S0226 (PigMap v 1.5);
c
S0035 at 0 and S0003 at 144.5 cM in the International Workshop 1 SSC6
integrated map with a total length of 166.0 cM.
Additional file 3: Table S3 - Analysis of variance for different LW-
related traits.
1
FLS = fore leg score, RLS = rear leg score, FFS = fore feet
score, RFS = rear feet score, OC = osteochondrosis, HH = head of the
humerus, CMH = condylus medialis humeri, HF = head of the femur,
CMF = condylus medialis femori, BMD = bone mineral density, BMC =
bone mineral content, BMA = bone mineral area, ADG = average daily
gain.
List of abbreviations used
ADG: average daily gain; BMD: bone mineral density; BMC: bone mineral
content; BMA: bone mineral area; QTL: quantitative trait loci; DXA: dual
energy X-ray absorptiometry; LW: leg weakness; FLS: fore leg score; RLS: rear
leg score; FFS: fore feet score; RFS: rear feet score; OC: osteochondrosis; HH:
head of the humerus; CMH: condylus medialis humeri; HF: head of the
femur; CMF: condylus medialis femori; DuPi: Duroc × Pietrain resource
population.
Acknowledgements
This work was supported by the German Federal Ministry of Education and
Research (BMBF), and was part of the cooperative project ‘FUGATO-plus’
(sub-project GENE-FL), grant nr. FK20315135C. We greatly appreciate the
excellent sample supply from the experimental station ‘Frankenforst’.
Author details
1
Institute of Animal Science, University of Bonn, Endenicher Allee 15, 53115
Bonn, Germany.
2
Reprogen, University of Sydney, 425 Werombi Road,
Camden NSW 2570, Australia.
3
Livestock Center of the Veterinary Faculty,
Ludwig-Maximilians University of Munich, Sankt Hubertusstrasse 12, 85764
Oberschleissheim, Germany.
4
Leibniz Institute of Farm Animal Biology,
Wilhelm-Stahl-Allee 2, 18196 Dummerstorf, Germany.
5
Department of Animal
and Aquatic Science, Faculty of Agriculture, Chiang Mai University, Chiang
Mai, Thailand.
Authors’ contributions
WL performed OC phenotyping, analysed the phenotypes, prepared and
drafted the manuscript. MU contributed to the data analyses, prepared and
edited the manuscript. MC, CL and KW shared manuscript editing. CG
calculated the genetic cards and helped with the statistical analysis. DT
supervised the lab work. EJ and ET supervised the statistical analysis and
edited the manuscript. AS analysed the DXA traits. HJ was responsible for
animal breeding and for collecting leg and feet score phenotypes. HS and
MM supervised the cartilage and bone collection and histological analyses
of the OC trait. CP supervised the whole work and was included in project
Laenoi et al. Genetics Selection Evolution 2011, 43:13
/>Page 6 of 7
management and organisation of samples and work flow. KS supervised the
study and edited the manuscript. All authors read and approved the final
manuscript.
Competing interests
The authors declare that they have no competing interests.
Received: 13 January 2011 Accepted: 20 March 2011
Published: 20 March 2011
References
1. Webb AJ, Russell WS, Sales DI: Genetics of leg weakness in performance-
tested boars. Anim Prod 1983, 36:117-130.
2. de Sevilla XF, Fabrega E, Tibau J, Casellas J: Genetic background and
phenotypic characterization over two farrowings of leg conformation
defects in Landrace and Large White sows. J Anim Sci 2009, 87:1606-1612.
3. López-Serrano M, Reinsch N, Looft H, Kalm E: Genetic correlations of
growth, backfat thickness and exterior with stayability in Large White
and Landrace sows. Livest Prod Sci 2000, 64:121-131.
4. Huang S, Tsou H, Kan M, Lin W, Chi C: Genetic study on leg weakness
and its relationship with economic traits in central tested boars in
subtropical area. Livest Prod Sci 1995, 44:53-59.
5. Jorgensen B, Andersen S: Genetic parameters for osteochondrosis in
Danish Landrace and Yorkshire boars and correlation with leg weakness
and production traits. Anim Sci 2000, 71:427-434.
6. Lundeheim N: Genetic analysis of osteochondrosis and leg weakness in
the Swedish pig progeny testing scheme. Acta Agric Scand 1987,
37:159-173.
7. Ytrehus B, Carlson CS, Ekman S: Etiology and pathogenesis of
osteochondrosis. Vet Pathol 2007, 44:429-448.
8. Ytrehus B, Ekman S, Carlson CS, Teige J, Reinholt FP: Focal changes in
blood supply during normal epiphyseal growth are central in the
pathogenesis of osteochondrosis in pigs. Bone 2004, 35:1294-1306.
9. Hill M: Economic relevance, diagnosis, and countermeasures for
degenerative joint disease (osteoarthrosis) and dyschondroplasia
(osteochondrosis) in pigs. J Am Vet Med Assoc 1990, 197:254-259.
10. Uhlhorn H, Dalin G, Lundeheim N, Ekman S: Osteochondrosis in wild boar-
Swedish Yorkshire crossbred pigs (F2 generation). Acta Vet Scand 1995,
36:41-53.
11. Jorgensen B, Nielsen B: Genetic parameters for osteochondrosis traits in
elbow joints of crossbred pigs and relationships with production traits.
Anim Sci 2005, 81:319-324.
12. Kadarmideen HN, Schworer D, Ilahi H, Malek M, Hofer A: Genetics of
osteochondral disease and its relationship with meat quality and
quantity, growth, and feed conversion traits in pigs. J Anim Sci 2004,
82:3118-3127.
13. Stern S, Lundeheim N, Johansson K, Andersson K: Osteochondrosis and leg
weakness in pigs selected for lean tissue growth rate. Livest Prod Sci
1995, 44:45-52.
14. Amin S, Riggs BL, Atkinson EJ, Oberg AL, Melton LJ Iii, Khosla S: A
potentially deleterious role of IGFBP-2 on bone density in aging men
and women. J Bone Miner Res
2004, 19:1075-1083.
15. Xu ZR, Wang AH, Wu XP, Zhang H, Sheng ZF, Wu XY, Xie H, Luo XH,
Liao EY: Relationship of age-related concentrations of serum FSH and LH
with bone mineral density, prevalence of osteoporosis in native Chinese
women. Clin Chim Acta 2009, 400:8-13.
16. Hu ZL, Reecy JM: Animal QTLdb: beyond a repository. A public platform
for QTL comparisons and integration with diverse types of structural
genomic information. Mamm Genome 2007, 18:1-4.
17. Andersson-Eklund L, Uhlhorn H, Lundeheim N, Dalin G, Andersson L:
Mapping quantitative trait loci for principal components of bone
measurements and osteochondrosis scores in a wild boar × Large White
intercross. Genet Res 2000, 75:223-230.
18. Christensen OF, Busch ME, Gregersen VR, Lund MS, Nielsen B, Vingborg RKK,
Bendixen C: Quantitative trait loci analysis of osteochondrosis traits in
the elbow joint of pigs. Animal 2009, 4:417-424.
19. Guo YM, Ai HS, Ren J, Wang GJ, Wen Y, Mao HR, Lan LT, Ma JW, Brenig B,
Rothschild MF, Haley CS, Huang LS: A whole genome scan for
quantitative trait loci for leg weakness and its related traits in a large F2
intercross population between White Duroc and Erhualian. J Anim Sci
2009, 87:1569-1575.
20. Lee GJ, Archibald AL, Garth GB, Law AS, Nicholson D, Barr A, Haley CS:
Detection of quantitative trait loci for locomotion and osteochondrosis-
related traits in Large White × Meishan pigs. Anim Sci 2003, 76:155-156.
21. Mao H, Guo Y, Yang G, Yang B, Ren J, Liu S, Ai H, Ma J, Brenig B, Huang L:
A genome-wide scan for quantitative trait loci affecting limb bone
lengths and areal bone mineral density of the distal femur in a White
Duroc × Erhualian F2 population. BMC Genet 2008, 9:63.
22. Liu G, Jennen DG, Tholen E, Juengst H, Kleinwachter T, Holker M, Tesfaye D,
Un G, Schreinemachers HJ, Murani E, Ponsuksili S, Kim JJ, Schellander K,
Wimmer K: A genome scan reveals QTL for growth, fatness, leanness and
meat quality in a Duroc-Pietrain resource population. Anim Genet 2007,
38:241-252.
23. Zentralverband der Deutschen Schweineproduktion (ZDS): Richtlinie für die
Stationsprüfung auf Mastleistung, Schlachtkörperwert und
Fleischbeschaffenheit beim Schwein, 10.12.2003. Book Richtlinie für die
Stationsprüfung auf Mastleistung, Schlachtkörperwert und
Fleischbeschaffenheit beim Schwein, 10.12.2003 Bonn .
24. Laenoi W, Uddin MJ, Cinar MU, Phatsara C, Tesfaye D, Scholz AM, Tholen E,
Looft C, Mielenz M, Sauerwein H, Schellander K: Molecular characterization
and methylation study of matrix gla protein in articular cartilage from
pig with osteochondrosis. Gene 2010, 459:24-31.
25. Mitchell AD, Scholz AM, Pursel VG: Total body and regional
measurements of bone mineral content and bone mineral density in
pigs by dual energy X-ray absorptiometry. J Anim Sci 2001, 79:2594-2604.
26. O’Connell JR, Weeks DE: PedCheck: a program for identification of
genotype incompatibilities in linkage analysis. Am J Hum Genet 1998,
63:259-266.
27. Green P, Fall K, Crooks S: Documentation for CRIMAP, Version 2.4.
Washington University School of Medicine, St Louis, MO 1990.
28. Seaton G, Haley CS, Knott SA, Kearsey M, Visscher PM: QTL Express:
mapping quantitative trait loci in simple and complex pedigrees.
Bioinformatics 2002, 18:339-340.
29. Churchill GA, Doerge RW: Empirical threshold values for quantitative trait
mapping. Genetics 1994, 138:963-971.
30. de Koning DJ, Rattink AP, Harlizius B, van Arendonk JA, Brascamp EW,
Groenen MA: Genome-wide scan for body composition in pigs reveals
important role of imprinting. Proc Natl Acad Sci USA 2000, 97:7947-7950.
31. Kadarmideen HN, Janss LL: Evidence of a major gene from Bayesian
segregation analyses of liability to osteochondral diseases in pigs.
Genetics 2005, 171:1195-1206.
32. Van der Wal PG, Goedegebuure SA, Van der Valk PC, Engel B, Van Essen G:
Leg weakness and osteochondrosis in pigs; differences between the
sexes of four breeds. Livest Prod Sci 1978, 16:65-74.
33. Rothschild MF, Christain LL: Genetic control of front-leg weakness in
Duroc swine. I. Direct response to five generations of divergent
selection. Livest Prod Sci 1988, 19:459-471.
34. Uemoto Y, Sato S, Ohnishi C, Hirose K, Kameyama K, Fukawa K, Kudo O,
Kobayashi E: Quantitative trait loci for leg weakness traits in a Landrace
purebred population. Anim Sci J 2010, 81:28-33.
35. de Koning DJ, Carlborg O, Haley CS: The genetic dissection of immune
response using gene-expression studies and genome mapping. Vet
Immunol Immunopathol 2005, 105:343-352.
36. Yerle M, Archibald AL, Dalens M, Gellin J: Localization of the PGD and TGF
beta-1 loci to pig chromosome 6q. Anim Genet 1990, 21:411-417.
37. Thorp BH, Ekman S, Jakowlew SB, Goddard C: Porcine osteochondrosis:
Deficiencies in transforming growth factor-β and insulin-like growth
factor-I. Calcif Tissue Int 1995, 56:376-381.
38. Uddin MJ, Cinar MU, Große-Brinkhaus C, Tesfaye D, Tholen E, Juengst H,
Looft C, Wimmers K, Phatsara C, Schellander K: Mapping quantitative trait
loci for innate immune response in the pig. Int J of Immunogenet 2011,
38:121-131.
39. Visscher PM, Haley CS, Knott SA: Mapping QTLs for binary traits in
backcross and F
2
populations. Genet Res 1996, 68:55-63.
doi:10.1186/1297-9686-43-13
Cite this article as: Laenoi et al.: Quantitative trait loci analysis for leg
weakness-related traits in a Duroc × Pietrain crossbred population.
Genetics Selection Evolution 2011 43:13.
Laenoi et al. Genetics Selection Evolution 2011, 43:13
/>Page 7 of 7