Báo cáo sinh học: " Quantitative genetics of taura syndrome resistance in pacific white shrimp (penaeus vannamei): a cure model approach" pot
Bạn đang xem bản rút gọn của tài liệu. Xem và tải ngay bản đầy đủ của tài liệu tại đây (393.59 KB, 7 trang )
RESEARCH Open Access
Quantitative genetics of taura syndrome
resistance in pacific white shrimp (penaeus
vannamei): a cure model approach
Jørgen Ødegård
1,2*
, Thomas Gitterle
3,4
, Per Madsen
5
, Theo HE Meuwissen
2
, M Hossein Yazdi
3
, Bjarne Gjerde
1,2
,
Carlos Pulgarin
4
and Morten Rye
3
Abstract
Background: In aquaculture breeding, resistance against infectious diseases is commonly assessed as time until
death under exposure to a pathogen. For some diseases, a fraction of the individuals may appear as “cured”
(non-susceptible), and the resulting survival time may thus be a result of two confounded underlying traits, i.e.,
endurance (individual hazard) and susceptibility (whether at risk or not), which may be accounted for by fitting a
cure survival model. We applied a cure model to survival data of Pacif ic white shrimp (Penaeus vannamei)
challenged with the Taura syndrome virus, which is one of the major pathogens of Panaeid shrimp species.
Methods: In total, 15,261 individuals of 513 full-sib families from three generations were challenge-tested in 21
separate tests (tanks). All challenge-tests were run until mortality naturally ceased. Time-until-event data were
analyzed with a mixed cure survival model using Gibbs sampling, treating susceptibility and endurance as separate
genetic traits.
Results: Overall mortality at the end of test was 28%, while 38% of the population was considered susceptible to the
disease. The estimated underlying heritability was high for susceptibility (0.41 ± 0.07), but low for endurance (0.07 ±
0.03). Furthermore, endurance and susceptibility were distinct genetic traits (r
g
= 0.22 ± 0.25). Estimated breeding values
for endurance and susceptibility were only moderately correlated (0.50), while estimated breeding values from classical
models for analysis of challenge-test survival (ignoring the cured fraction) were closely correlated with estimated
breeding values for susceptibility, but less correlated with estimated breeding values for endurance.
Conclusions: For Taura syndrome resistance, endurance and susceptibility are apparently distinct genetic traits.
However, genetic evaluation of susceptibility based on the cure model showed clear associations with standard
genetic evaluations that ignore the cure fraction for these data. Using the current testing design, genetic variation
in observed survival time and absolute survival at the end of test were most likely dominated by genetic variation
in susceptibility. If the aim is to reduce susceptibility, earlier termination of the challenge-test or back-truncation of
the follow-up period should be avoided, as this may shift focus of selection towards endurance rather than
susceptibility.
Background
Genetic evaluation of resistance against infectious
diseases in aquaculture species is typically based on data
from challenge-tests, where individuals are exposed to
the relevant pathogen under controlled environmental
conditions. Traditionally, such evaluations have been
based on cross-sectional models, i.e., models considering
survival as an all-or-non trait (survived/dead at a specific
point in time). More recent studies in aquaculture
species have suggested using more advanced longitudi-
nalsurvivalmodels[1-3],suchasproportionalhazards
frailty models [4] or survival score models [5]. These
models take into account not only whether the indivi-
dual survives a given time period, but also time until
death. A typical assumption in survival analysis is that
* Correspondence:
1
Nofima Marin, NO-1432 Ås, Norway
Full list of author information is available at the end of the article
Ødegård et al. Genetics Selection Evolution 2011, 43:14
/>Genetics
Selection
Evolution
© 2011 Ødegård et al; licensee BioMed Central Ltd. This is an Open Access article dist ributed under the terms of the Creative
Commons Attribution License ( 0), which permits unrestrict ed use, distribution, and
reproduction in any medium, provided the original work is properly cited.
all individuals are at risk, i.e., censored lifespans are
simply the result of a limited follow-up period. However,
this assumption is violated if a fraction of the individuals
are non-susceptible (e.g., not infected or tolerant), which
is not unlikely when testing for resistance against
specific pathogens [e.g., [6,7]]. Given that a fraction of
non-susceptible individuals exists, mortality is expected
to l evel out when the majority of the susceptible indivi-
duals have died, rather than approaching 100%.
Genetic evaluations of binary traits are expected to be
most accurate at intermediate frequencies [8]. To
achieve this, challenge-tests in aquaculture breeding
programs have often been term inated at intermediate
but still increasing mortalities, or evaluation datasets
have been back-tru ncated at such frequencies. However,
this would only be an advantage when analyzing survival
data with cross-sectional models that treat survival as a
binary trait. For classical longitudinal survival models,
high mortality (and thus limited censoring) would be an
advantage in genetic analysis [9]. Furthermore, the prac-
tice of early termination or back-truncation is based on
the assumption that survival time and long-term survival
under exposure to the pathogen are equivalent genetic
traits. Given the presence of non-susceptible individuals,
this may not be the case. For example, in wild Atlantic
salmon,someBalticpopulationsaretoalargeextent
tolerant to the ectoparasite Gy rodact ylus salaris, while
East Atlantic stocks are highly susceptible [10,11], lead-
ing to mass mortalities in infected rivers [12]. Hence ,
comparing these populations on survival time would be
inappropriate. Furthermore, even within a highly suscep-
tible Norwegian river population, a small fraction of
long-term survivors was identified. In the latter popula-
tion, susceptibility (long-t erm survival) and endurance
(time until death of non-survivors) appeared to have a
low genetic correlation, indicating that these two aspects
of parasite resistance are genetically distinct traits [12].
Given that a non-susceptible f raction exists and that
endurance and susceptibility are distinct genetic traits,
selection programs for improved disease resistance
would (if given the opportunity) most likely favor
improvement of non-susceptibility over endurance, as
the latter may postpone mortality rather than avoid it in
the long run. Existence of non-susceptible individuals
mayalsoreducepathogenicpressureinthepopulation,
while highly endurant (but infected) individuals may
produce large numbers of infectious disease agent s dur-
ing their long period of infection. Still, in real disease
testing schemes, follow-up periods are o ften limited due
to practical considerations, and survivors are thus
expected to be a mixture of non-susceptible and suscep-
tible individuals with censored lifespans. A mixture cure
model [13] is a survival model that attempts to
distinguish susceptible and non-susceptible (“cured” )
survivors, which may be of great advantage in the analy-
sis of time-to-event data that contain a cure fraction.
Taura syndrome (TS) is an economically important
viral disease affecting Panaeid shrimp and has been
responsibleformassmortalityinPacificwhiteshrimp
(Penaeus vannamei). The Taura syndrome virus (TSV)
was first discovered in South America, but has later
spread to North America, Hawaii and Asia [14-16].
A substantial underlying heritability (0.30 ± 0.13) has
been estimated for TS resistance, and selective breeding
is successfully implemented; i.e., survival after exposure
to TSV increased by 18.4% after only one generati on of
selection for TS resistance [17]. Furthermore, in a
Colombian mass selection program for TS resistance,
overall survival in TSV infected areas is now back to the
levels prior to the first outbreak of TS [18].
The aim of the study was to apply a cure model to
survival data from challenge testing of Pacific white
shrimp with TSV and to compare this model with clas-
sical models of analysis of such data.
Methods
Data
The study was based on recorded survival times of
15,261 Pacific white shrimp from Colombia. The
shrimp originated from 513 full-sib families (266 sires
and 484 dams). The parents were selected for TS resis-
tance and growth through a combined individual and
family-based selection program [18]. The dataset con-
tained individuals from seven different batches, includ-
ing three consecutive generations. Parents were used
across several batches, resulting in good genetic ties
between the different groups in the dataset. All
families were kept separate in different tanks until they
were individually tagged when the population reached
the average size of one gram (normally eight weeks
after hatching). Animals from the same full-sib family
were randomly selected and tagged with a common
color code by injecting differently colored fluorescent
elastomers into the 6th abdominal segment of each
animal. Each batch was tested separately in three
different test-tanks. Shrimp from the first b atch were
orally infected with TSV-infected minced muscle tissue
for seven consecutive days at a feeding intensity of
10% of the tank biomass per day. Due to low mortality,
the animals o f the second batch onward were infected
through intramuscular in jections of 20 μLofapurified
inoculum of the pathogen. For each test, mortalities
were recorded on an hourly basis until no more dead
animals were recorded for 24 hours. The length of the
recording periods in the different test lasted from 18
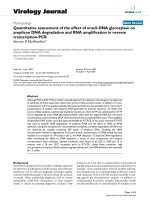
to 30 days (Figure 1).
Ødegård et al. Genetics Selection Evolution 2011, 43:14
/>Page 2 of 7
Statistical analysis
Survival times in hours were transformed to test-day
(24 h) binary survival scores. Hence, the number of
records per individual equals the number of days
(measured from the time of the first observed mortality
in the test) unt il death or censoring. For each period, an
individual was scored as dead (= 1) if it was recorded as
dead during that period andasalive(=0)otherwise,
e.g., an animal dying at day 4 had survival scores of [0 0
0 1]. The model and Bayesian setup is described in
more detail by Ødegård et al.[19]. Here, the probability
of an individual i being censored (c
i
=1)attheendof
the follow-up period (survival time y
i
= t) is:
Pr
y
i
= t, c
i
=1
=
Pr
(
Z
i
=1
)
t
j
=1
Pr
S
ij
=0
+Pr
(
Z
i
=0
)
(1)
where Z
i
is the susceptibility status (susceptible = 1;
non-susceptible = 0), S
ij
is the endurance score for per-
iod j,i.e.whetherindividuali survives (0) or dies (1) in
time period j, given that it is susceptible.
Given Z and S, the cure model is reduced to a bivari-
ate threshold model, where the first trait (susceptibility
status, Z) is whether the animal is susceptible to the dis-
ease, and the second trait consists of endurance scores
(S), which are only observable for putatively susceptible
animals (Z
i
= 1). The corresponding underlying liabil-
ities of the two traits were analyzed with the following
model (CURE):
λ =
λ
1
λ
2
=
X
1
μ
1
+ Z
t
t + Z
a1
a
1
+ Z
f1
f
1
+ e
1
X
2
μ
2
+ Z
b
b + Z
a2
a
2
+ Z
f2
f
2
+ e
2
,
(2)
where l
1
and l
2
are vectors of liabilities associated
with endurance scores and susceptibility statuses,
respectively,
μ =
μ
1
μ
2
is a vector of “fixed” effects
(batch-tank and overall mean for endurance and
susceptibility, respectively),
t ∼ N
0,Iσ
2
t
is a vector of
random (batch-tank) test-day effects on l
1
,
with variance
σ
2
t
,
b ∼ N
0,Iσ
2
b
is a vector of
random batch-tank effects on l
2
,withvariance
σ
2
b
,
a =
a
1
a
2
∼ N
(
0,G ⊗ A
)
is a v ector of random addi-
tive genetic effects of all individuals,
f =
f
1
f
2
∼ N
(
0,F ⊗ I
)
is a vector of random common
environmental family effects (i.e., potential effects
of separate rearing of families prior to tagging,
maternal effects and dominance genetic effects),
e =
e
1
e
2
∼ N
(
0,I
)
is a vector of random residuals
associated with both traits, G is the genetic co-variance
matrix, F is the co-variance matrix of common environ-
mental family effects, A is the additive genetic relation-
ship matrix and I denotes an identity matrix of
appropriate size. As endurance can only be observed in
putatively susceptible individuals, the residual covariance
between the two underlying traits i s not identifiable and
was restricted to be zero [19], as indicated above.
In the CURE model, the susceptibility status (Z
i
)ofa
survivor i, surviving t days in a given test was sampled
from a Bernoulli distribution with a conditional
probability for susceptibility [19] calculated as:
τ
i
=
w
2i
θ
t
j=1
1 −
w
1ij
θ
1 −
w
2i
θ
+
w
2i
θ
t
j
=1
1 −
w’
1ij
θ
,
(3)
where θ is a vector of all location parameters, the w’
vectors are appropri ate row incidence vectors associated
with the location parameters of the endurance and
susceptibility liabilities of the individual. The standard
normal cumulative density function
w
2i
θ
is thus the
prior probability of b eing susceptible (Z
i
=1)for
individual i (given the model parameters) and
t
j
=1
1 −
w
1ij
θ
is the probability (given the mo del
parameters) for individual i to survive until day t (end
of test), given that the individual is susceptible. Based
on observed survival time and the sampled putative
susceptibility status, we defined a set of putative “endur-
ance scores”, which were defined based on the recorded
survival time and censoring status (as described above)
for the putatively susceptible individuals, and defined as
missing for the putatively non-susceptible ones (as
endurance does not influence survival time in non-
susceptible animals). Given the endurance scores and
the susceptibility statuses, all parameters of the CURE
model were sampled as in a standard bivariate threshold
model using Gibbs sampling.
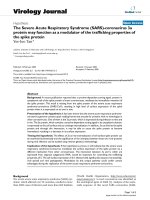
Figure 1 Kaplan-Meier survival curves for the dif ferent TSV
challenge tests. The different challenge tests are numbered as
“batch_tank” (batches 17 to 23).
Ødegård et al. Genetics Selection Evolution 2011, 43:14
/>Page 3 of 7
For comparison purposes the survival data were also
fitted using a “naïve” (assuming that all individuals are
susceptible) survival score threshold model (NAÏVE)
and a simple cross-sectional threshold model for
observed survival until the end of test (SIMPLE).
The NAÏVE model was:
λ
1
= X
1
μ
1
+ Z
t
t + Z
a1
a
1
+ Z
f1
f
1
+ e
1
,
(4)
where l
1
is a vector of liabilities associated with the
survival scores, and the other parameters are as
described above.
The SIMPLE model was:
λ
2
= X
2
μ
2
+ Z
a2
a
2
+ Z
f2
f
2
+ e
2
(5)
where l
2
is a vecto r of liabilities associated wit h
observed survival to the end of test, μ
2
is a vector of
fixed batch-tank effects and the ot her parameters are as
described a bove. To avoid bias problems typical of ani-
mal threshold models [20], genetic (co)variance compo-
nents were estimated with a n algorithm that was based
on parental breeding values only [21], while all other
dispersion and location parameters were est imated as in
a standard animal threshold model.
All genetic analyses were performed using a modified
Gibbs sampling module in the DMU software package
[22]. Convergence was checked through visual inspec-
tion of trace plots and Raftery and Lewis diagnostics
[23]. The NAÏVE and SIMPLE models were run in sin-
gle chains for 110,000 rounds, discarding the initial
10,000 rounds as burn-in, and storing parameters of
every 10
th
sampling round. The CURE model had con-
siderably slower mixing compared with the SIMPLE and
NAÏVE models and two separate longer chains were
thus chosen for this model (2×340,000 rounds, discard-
ing the first 40,000 as burn-in). Two separate chains
rather than one long chain were chosen to reduce the
computing time (which varied between 82 h to 123 h),
and results were averaged across the two chains. Due to
limitations in storing capacity, samples from every 100
rounds were kept for the latter model.
Results
Descriptive statistics of the data set are given in Table 1,
and Kaplan-Meier survival curves for the different tanks
and batches are given in Figure 1. Across challenge-
tests, the average mortality was 28% but varied substan-
tially between tests. Environment and management
(water temperature and tank densities) were standar-
dized across tanks and batches to achieve as high as
possible mortality during the testing period, and no
clear phenotypic trends over generations and batches
were therefore evident. Even though the tests lasted
until mortality naturally stopped, survival was above
50% in all challenge tests. Furthermore, most survival
curves showed a clear tendency towards fl attening out
at moderate or high frequencies, which is consistent
with a substantial fraction of non-susceptible individuals
in the population.
Results of the current analyses are presented in
Table 2. Based on the SIMPLE model, the underlying her-
itability of end-survival was substantial (h
2
= 0.39 ± 0.06).
The fraction of underlying variance explained by common
environmental effects was small (c
2
= 0.05 ± 0.02) but
significant (based on a likelihood ratio test, using a linear
model). Likewise, the NAÏVE model also indicated moder-
ate heritable variation for endurance, with an estimated
underlying heritability of 0.16 ± 0.03 for test-day endur-
ance scores, while common environmental family effects
explained only a minor part of the total underlying
variance for endurance scores (c
2
= 0.02 ± 0.01). The esti-
mated test-day (environmental) variance was rather small
and explained only 9% of the underlying variation in
endurance liability (posterior mean).
For the CURE model, the posterior mean of the p er-
centage of putative susceptible shrimp was 38% (± 1%),
while 28% of the shrimp actually died (Table 1). Hence,
across tests, 86% ((1-0.38)/(1-0.28) = 0.86) of the survi-
vors were considered as non- susceptible. For the CURE
model, the estimated underlying heritability (h
2
= 0.07 ±
0.03) for endurance was smaller than for the NAÏVE
model, while the estimated underlying heritabili ty of
susceptibility was similar (h
2
= 0.41 ± 0.07) to t he esti-
mated heritability for end-survival for the SIMPLE
model. The genetic correlation between endurance and
susceptibility within the CURE model tended to be posi-
tive but not significantly different from zero (r
g
=0.22±
0.25). Furthermore, the sampled genetic correlation
between endurance and susceptibility was lower than
0.8 in 99% of the sampling rounds of the Gibbs chain,
indicating that endurance and susceptibility should be
considered as distinct genetic traits. As for the other
models, common environmental effects explained a
Table 1 Descriptive statistics of the data set
Item
Shrimp with data 15,261
Full-sib families 513
Sires 266
Dams 484
Generations with data 3
Batches with data 7
Challenge-test tanks per batch 3
Average mortality (across tests) 28%
Median time until death
1
(across tests) 157 h (56 h)
1
Excluding individuals with censored lifespans. Between-test standard
deviation is presented in parenthesis.
Ødegård et al. Genetics Selection Evolution 2011, 43:14
/>Page 4 of 7
relatively small part of the underlying liability variance
for both endurance and susceptibility for the CURE
model (c
2
=5%andc
2
= 7%, respectively). The correla-
tion between common environmental effects on the two
traits was low (r
f
= -0.06 ± 0.05). Finally, the random
tank-test-day effects for endurance and the random
batch-tank effects for susceptibility explained a relatively
small fraction of the underlying liability variances (pos-
terior means of 11% and 7%, respectively).
Table 3 shows the Pearson and Spearman correlation
coefficients between pre dicted breeding values (EBV)
from the three models. Correlations between EBV of
the SIMPLE and NAÏVE models were close to unity
(0.99), and both models showed very high correlations
(0.98-0.99) with the EBV of susceptibility in the CURE
model; while the correlations with the endurance EBV
were substantially lower (0.57-0.63). Similarly, the EBV
for endurance and susceptibility from the CURE model
were only moderately correlated to each other
(0.50-0.51).
Discussion
The estimated underlying heritability of end-survival
using the SIMPLE model was substantial (0.39 ± 0.06).
This is in line with previously reported estimates of her-
itability for survival to TS (0.30 ± 0.1 3) from a different
population of Pacific white shrimp [17]. The NAÏVE
model also indicated considerable heritable variation for
survival scores, but lower than for end-survival. This
was expected, as the model splits the lifespan in several
shorter periods. The estimated underlying heritability of
susceptibility from the CURE model was similar (0.41 ±
0.07) to the estimated heritability of end-survival from
the SIMPLE model, which may be due to the fact that
challenge-tests were continued until mortality naturally
ceased. Hence, few suscept ible individuals were likely to
survive, which is supported by the high fraction of puta-
tively “cured” animals among the survivors in the CURE
model (86%). The estimated heritability for endurance
from th e CURE model was about half the corresponding
heritability of the NAÏVE model, i.e. , in a standard
survival model, the more highly heritable susceptibility
status is likely to dominate survival time and thereby
increase the estimated genetic variance.
Based on the results from the CURE model, endur-
ance and susceptibility appear to be distinct genetic
traits with respect to TS resist ance. If the aim is to
improve long-term survival to TS in the population,
Table 2 Posterior means of parameters for the CURE, SIMPLE and NAÏVE threshold models (± posterior standard
deviations)
Parameters
1
Trait CURE SIMPLE NAÏVE
Fraction susceptible (%) 38 ± 1 - 100
σ
2
t
Endurance/survival scores 0.14 ± 0.01 - 0.13 ± 0.01
σ
2
g
Endurance/survival scores 0.09 ± 0.04 - 0.21 ± 0.05
Susceptibility/mortality 0.82 ± 0.23 0.72 ± 0.16 -
r
g
Endurance - susceptibility 0.22 ± 0.25 - -
σ
2
f
Endurance/survival scores 0.07 ± 0.02 - 0.03 ± 0.01
Susceptibility/mortality 0.13 ± 0.04 0.08 ± 0.03
r
f
Endurance - susceptibility -0.06 ± 0.05 - -
σ
2
b
Susceptibility 0.16 ± 0.10 - -
h
2
Endurance/survival scores
2
0.07 ± 0.03 - 0.16 ± 0.03
Susceptibility/mortality
3
0.41 ± 0.07 0.39 ± 0.06 -
c
2
Endurance/survival scores
4
0.05 ± 0.01 - 0.02 ± 0.01
Susceptibility/mortality
5
0.07 ± 0.02 0.05 ± 0.02 -
1
σ
2
t
= variance of tank-test-day effects,
σ
2
g
= genetic variance, r
g
= genetic correlation,
σ
2
f
= variance of common environmental family effects, r
f
= correlation
of common environmental family effects,
σ
2
b
= variance of batch-tank effects,
2
h
2
= σ
2
g
σ
2
g
+ σ
2
f
+ σ
2
t
+1
,
3
h
2
= σ
2
g
σ
2
g
+ σ
2
f
+1
4
c
2
= σ
2
f
σ
2
g
+ σ
2
f
+ σ
2
t
+1
,
5
c
2
= σ
2
f
σ
2
g
+ σ
2
f
+1
Table 3 Pearson (above diagonal) and Spearman (below
diagonal) correlation coefficients between posterior
means of breeding values for the different models
Model CURE SIMPLE NAÏVE
Trait Endurance Susceptibility End-survival Survival
CURE Endurance 0.51 0.57 0.63
Susceptibility 0.50 0.99 0.98
SIMPLE End-survival 0.57 0.99 0.99
NAÏVE Survival 0.61 0.98 0.99
Ødegård et al. Genetics Selection Evolution 2011, 43:14
/>Page 5 of 7
selection for increased time until death or s urvival to
the end of test is therefore likely to be suboptimal, and
more so if testing is based on data from challenge-tests
with short follow-up periods or survival data that are
back-truncated to a point in time where mortality is still
increasing. In a simulation study, it was concluded that
if selecti on aims at improvi ng susceptibility the error of
applying a classical “non-cure” survival model was non-
neglible, especially if endurance and susceptibility were
lowly genetically correlated and when genetic variance
of endurance is substantial [19]. However, b y using the
current testing strategy where the testing period con-
tinues until mortality naturally ceases, there were small
practical differences between selection for increased sur-
vival using cl assical models (SIMPLE and NAÏVE) and
the more advanced CURE model. Hence, correlations
between EBV of the SIMPLE and NAÏVE models were
close to unity, and both models showed good agreement
with the EBV for s usceptibility from the CURE model.
Still, the EBV for endurance from the CURE model
were only moderately correlated to EBV for susceptibil-
ity from that same model (and to EBV for the SIMPLE
and NAÏVE models). These results indicate that genetic
variation in recorded end-survival a nd time until death
of the current data set are dominated by genetic varia-
tion in susceptibility. Furthermore, stopping the test at
an earlier stage would shift the focus of selection
towards endurance (especially for classical models).
In a the oretical study, Ødegård et al. [19] have shown
that a truly positive genetic c orrelation between endur-
ance and susceptibility in a cure model may be underes-
timated as result of large uncertainty (giving more room
for downward than upward errors). This could in part
explain the l ow genetic correlation obtained f or endur-
ance and susceptibility in this study. Still, based on the
range of the sampled genetic correlations, the true
genetic correlation between endurance and susceptibility
is likely far from unity (as only 1% of the sampl ed
genetic correlations were above 0.8).
In the current study, tank-test-day effects were defined
as random, implying the assumption that test-day effects
are randomly distributed around the overall mean in
each test. If the hazard rate (for the susceptible indivi-
duals) changes substantially over time during each test,
these effects should ideally be fitted as fixed, to better
account f or potentially large temporal shifts in the
hazard. However, preliminary analyses showed that
fitting tank-test-day effects as fi xed resulted in extreme-
category problems in the cure model (results not
shown). This is due to the fact that susceptibility sta-
tuses are unknown and thus inferr ed thro ugh the Gibbs
sampler. Hence, at some point, all survivors in a specific
test may be viewed as being non-susceptible (i.e., all
remaining susceptible individuals die during the last
test-day), resulting in extreme-category problems for the
endurance trait. These problems were solved by fitting
the tank-test-day effects as random [24]. Likewise, fitting
the batch-tank effect for susceptibility as fixed may
cause s imilar problems (i.e., as all individuals in a given
tank at some point may be viewed as susceptible). These
effects were therefore also fitted as random for the
susceptibility trait in the CURE model.
The NAÏVE model is a sub-model of the CURE model
when assuming 100% susceptible animals. Hence, if the
NAÏVE model is the true model underlying the data, the
estimated susceptible fraction is expected to approach
100%, as has been observed in simulated data sets [19].
However, in the data analyzed here, the susceptible frac-
tion was very accurately estimated at 38% (± 1) and was
never even close to the value assumed by the NAÏVE
model. As previously mentioned, all challenge-tests were
continued until mortality stopped for 24 h. Despite this,
mortality never approached 100% in any of the chal-
lenge-tests. Thus, the study gives clear evidence for the
existence of a substantial fraction of Colombian Pacific
white shrimp being non-susceptible to TS.
In aquaculture breeding programs, challenge tests for
infectious diseases have frequently been terminated at
intermediate and often still increasing mortality. The
reason for this (apart from obvious practical and eco-
nomical limitations in follow-up time) is that genetic
evaluations have frequently been based on survival mea-
sured a s a binary trait, for which intermediate frequen-
cies are advantageous in genetic evaluation. However, if
the aim is to reduce susceptibility, rather than prolong-
ing time until death (increase endurance), this is not
optimal. Actually, terminating the test at a still increas-
ing mortality implies that selection is shifted towards
improved endurance rather than reduced susceptibility.
If possible, challenge tests should therefore continue
until mortality naturally ceases, as this ma ximizes the
potential importance of susceptibility status o n the
recorded end-survival (and survival/censoring time).
This testing strategy is thus o ptimal for the CURE
model and will also minimize differences in ranking of
selection candidates among different statistical models
(SIMPLE, NAÏVE and CURE) and, thus, increase robust-
ness of the genetic evaluations.
For classical survival models in general, a high degree
of censoring is always viewed as unfavorable, as this is
considered as loss of information. For cure survival
models, a high degree of cens oring may, however, be an
advantage, provided that this to a large extent is
explained by presence of non-susceptible individuals.
Theproposedcuremodelcanbeextendedtoinvolve
single gene effects and/or genomic breeding values. For
example, a cure survival model has been used to discri-
minate between single gene effects on incidence and
Ødegård et al. Genetics Selection Evolution 2011, 43:14
/>Page 6 of 7
latency of s crapie in sheep [25]. In Atlantic salmon, a
major QTL has been identified that gives virtually
complete protection against the viral disease infectious
pancreatic necrosis [26], indicating that a cure survival
model may be appropriate for this trait. Furthermore,
the cure model can be used to ac count for incomplete
exposure to infection in field data, i.e., the “ cured”
animals may be unexposed (in this case susceptibility
has no heritability). If not accounted for, presence of
unexposed animals could give downwardly biased
estimates of the underlying geneticvarianceofdisease
resistance [27].
Acknowledgements
The research was co-funded by Akvaforsk Genetics Center AS (AFGC) and
The Research Council of Norway in project no. 192331/S40.
Author details
1
Nofima Marin, NO-1432 Ås, Norway.
2
Norwegian University of Life Sciences,
NO-1432 Ås, Norway.
3
Akvaforsk Genetics Center AS, NO-6600 Sunndalsøra,
Norway.
4
CENIACUA, Bogotá, Colombia.
5
Aarhus University, DK-8830 Tjele,
Denmark.
Authors’ contributions
JØ did the statistical analysis and wrote the manuscript, PM and JØ
developed the statistical software to handle these models, TG and CP were
responsible for recording of data and challenge-test protocols, MHY was
responsible for data management and editing, MR coordinate d the project
and BG and THEM participated in writing the draft manuscript. All authors
read and approved the final manuscript.
Competing interests
The authors declare that they have no competing interests.
Received: 13 December 2010 Accepted: 21 March 2011
Published: 21 March 2011
References
1. Ødegård J, Olesen I, Gjerde B, Klemetsdal G: Evaluation of statistical
models for genetic analysis of challenge test data on furunculosis
resistance in Atlantic salmon (Salmo salar): Prediction of field survival.
Aquaculture 2006, 259(1-4):116-123.
2. Gitterle T, Ødegård J, Gjerde B, Rye M, Salte R: Genetic parameters and
accuracy of selection for resistance to White Spot Syndrome Virus
(WSSV) in Penaeus (Litopenaeus) vannamei using different statistical
models. Aquaculture 2006, 251:210-218.
3. Ødegård J, Olesen I, Gjerde B, Klemetsdal G: Evaluation of statistical
models for genetic analysis of challenge-test data on ISA resistance in
Atlantic salmon (Salmo salar): Prediction of progeny survival. Aquaculture
2007, 266(1-4):70-76.
4. Ducrocq V, Casella G: A Bayesian analysis of mixed survival models.
Gen Sel Evol 1996, 28:505-529.
5. Veerkamp RF, Brotherstone S, Engel B, Meuwissen THE: Analysis of
censored survival data using random regression models. Anim Sci 2001,
72:1-10.
6. Tournoud M, Ecochard R: Application of the promotion time cure model
with time-changing exposure to the study of HIV/AIDS and other
infectious diseases. Stat Med 2007, 26:1008-1021.
7. Tournoud M, Ecochard R, Kuhn L, Coutsoudis A: Diversity of risk of
mother-to-child HIV-1 transmission according to feeding practices, CD4
cell count, and haemoglobin concentration in a South African cohort.
Trop Med Int Health 2008, 13(3):310-318.
8. Fjalestad KT, Gjedrem T, Gjerde B: Genetic improvement of disease
resistance in fish: an overview. Aquaculture 1993, 111:65-74.
9. Ducrocq V, Besbes B, Protais M: Genetic improvement of laying hens
viability using survival analysis. Gen Sel Evol 2000, 32:23-40.
10. Bakke TA, Jansen PA, Hansen LP: Differences in the host resistance of
Atlantic salmon, Salmo salar L., stocks to the monogenean Gyrodactylus
salaris Malmberg, 1957. J Fish Biol 1990, 37:577-587.
11. Dalgaard MB, Larsen TB, Jorndrup S, Buchmann K: Differing resistance of
Atlantic salmon strains and rainbow trout to Gyrodactylus salaris
infection. J Aquat Anim Health 2004, 16:109-115.
12. Salte R, Bentsen HB, Moen T, Tripathy S, Bakke TA, Ødegård J, Omholt S,
Hansen LP: Prospects for a genetic management strategy to control
Gyrodactylus salaris infection in wild Atlantic salmon (Salmo salar) stocks.
Can J Fish Aquat Sci 2010, 67:121-129.
13. Farewell VT: The use of mixture-models for the analysis of survival-data
with long-term survivors. Biometrics 1982, 38:1041-1046.
14. Overstreet RM, Lightner DV, Hasson KW, McIlwain S, Lotz JM: Susceptibility
to Taura syndrome virus of some penaeid shrimp species native to the
Gulf of Mexico and the southeastern United States. J Invertebr Pathol
1997, 69:165-176.
15. Lightner DV, Redman RM, Hasson KW, Pantoja CR: Taura syndrome in
Penaeus-Vannamei (Crustacea, Decapoda) - gross signs, histopathology
and ultrastructure. Dis Aquat Organ 1995, 21:53-59.
16. Tu C, Huang H-T, Chuang S-H, Hsu J-P, Kuo S-T, Li N-J, Hsu T-L, Li M-C,
Lin S-Y: Taura syndrome in Pacific white shrimp Penaeus vannamei
cultured in Taiwan. Dis Aquat Organ 1999, 38:159-161.
17. Argue BJ, Arce SM, Lotz JM, Moss SM: Selective breeding of Pacific white
shrimp (Litopenaeus vannamei) for growth and resistance to Taura
Syndrome Virus. Aquaculture 2002, 204:447-460.
18. Cock J, Gitterle T, Salazar M, Rye M: Breeding for disease resistance of
Penaeid shrimps. Aquaculture 2009, 286:1-11.
19. Ødegård J, Madsen P, Labouriau R, Gjerde B, Meuwissen THE: A sequential
threshold cure model for genetic analysis of time-to-event data. J Anim
Sci 2011, 89:943-950[ />20. Hoeschele I, Tier B: Estimation of variance components of threshold
characters by marginal posterior modes and means via Gibbs sampling.
Gen Sel Evol 1995, 27:519-540.
21. Ødegård J, Meuwissen THE, Heringstad B, Madsen P: A simple algorithm to
estimate genetic variance in an animal threshold model using Bayesian
inference. Gen Sel Evol 2010 Jul, 42:29.
22. Madsen PJ: Just: DMU a package for analysing multivariate mixed
models. 2007.
23. Raftery AT, Lewis SM: Comment: One long run with diagnostics:
Implementation strategies for Markov chain Monte Carlo. Statistical
Science 1992, 7:493-497.
24. Luo MF, Boettcher PJ, Schaeffer LR, Dekkers JCM: Bayesian inference for
categorical traits with an application to variance component estimation.
J Dairy Sci 2001, 84:694-704.
25. Corbiere F, Barillet F, Andreoletti O, Fidelle F, Laphitz-Bordet N, Schelcher F,
Joly P: Advanced survival models for risk-factor analysis in scrapie. J Gen
Virol 2007, 88:696-705.
26. Houston RD, Haley CS, Hamilton A, Guy DR, Mota-Velasco JC, Gheyas AA,
Tinch AE, Taggart JB, Bron JE, Starkey WG,
et al: The susceptibility of
Atlantic salmon fry to freshwater infectious pancreatic necrosis is largely
explained by a major QTL. Heredity 2010 Sep, 105(3):318-327.
27. Bishop SC, Woolliams JA: On the genetic interpretation of disease data.
PLoS ONE 2010, 5:e8940.
doi:10.1186/1297-9686-43-14
Cite this article as: Ødegård et al.: Quantitative genetics of taura
syndrome resistance in pacific white shrimp (penaeus vannamei): a cure
model approach. Genetics Selection Evolution 2011 43:14.
Ødegård et al. Genetics Selection Evolution 2011, 43:14
/>Page 7 of 7