Báo cáo sinh học: " Persistence of accuracy of genomic estimated breeding values over generations in layer chickens" pdf
Bạn đang xem bản rút gọn của tài liệu. Xem và tải ngay bản đầy đủ của tài liệu tại đây (674.96 KB, 8 trang )
RESEARC H Open Access
Persistence of accuracy of genomic estimated
breeding values over generations in layer chickens
Anna Wolc
1,2*
, Jesus Arango
3
, Petek Settar
3
, Janet E Fulton
3
, Neil P O’Sullivan
3
, Rudolf Preisinger
4
, David Habier
2
,
Rohan Fernando
2
, Dorian J Garrick
2
and Jack CM Dekkers
2
Abstract
Background: The predictive ability of genomic esti mated breeding values (GEBV) originates both from associations
between high-density markers and QTL (Quantitative Trait Loci) and from pedigree information. Thus, GEBV are
expected to provide more persistent accuracy over successive generations than breeding values estimated using
pedigree-based methods. The objective of this study was to evaluate the accuracy of GEBV in a closed population
of layer chickens and to quantify their persistence over five successive generations using marker or pedigree
information.
Methods: The training data consisted of 16 traits and 777 genotyped animals from two generations of a brown-egg
layer breeding line, 295 of which had individual phenotype records, while others had phenotypes on 2,738 non-
genotyped relatives, or similar data accumulated over up to five generations. Validation data included phenotyped
and genotyped birds from five subsequent genera tions (on average 306 birds/generation). Birds were genotyped for
23,356 segregating SNP. Animal models using genomic or pedigree relationship matrices and Bayesian model
averaging methods were used for training analyse s. Accuracy was evaluated as the correlation between EBV and
phenotype in validation divided by the square root of trait heritability.
Results: Pedigree relationships in outbred populations are reduced by 50% at each meiosis, therefore accuracy is
expected to decrease by the square root of 0.5 every generation, as observed for pedigree-based EBV (Estimated
Breeding Values). In contrast the GEBV accuracy was more persistent, although the drop in accuracy was substantial
in the first generation. Traits that were considered to be influenced by fewer QTL and to have a higher heritability
maintained a higher GEBV accuracy over generations. In conclusion, GEBV capture informat ion beyond pedigree
relationships, but retraining every generation is recommended for genomic selection in closed breeding
populations.
Background
Genomic selection is based on the estimation of breeding
values using high-density marker data [1] and provides
opportunities to en hance genetic improvement programs
[2,3]. The resulting marker-based or genomic estimated
breeding values (GEBV) exploit associations between
markers and QTL (Quantitative Trait Loci) through link-
age disequilib riu m (LD) and linkage, along with the cap-
ture of pedigree relationships between animals [4]. In
contrast, estimated breeding values (EBV) obtained with
the pedigree-based BLUP animal model rely completely
on pedigree-based genetic relationships. The accuracy of
GEBV is expected to be more persistent across genera-
tions than that of pedigree-based EBV because marker-
based relationships resulting from LD and linkage are
expected to erode during the successive meioses at a
slower rate than genetic relationships. The initial hopes
that after a single training analysis, genomic selection
would permit to completely abandon progeny testing and
phenotyping for traits that are expensive or difficult to
measure [1] appear unrealistic. Several simulation studies
have been carried out to determine which factors af fect
the persistency of the accuracy of GEBV over genera-
tions. Sonesson and Meuwissen [5] observed a rapid
decline in the accuracy of GEBV in the generation imme-
diately following the discontinuation of phenotyping. The
* Correspondence:
1
Department of Genetics and Animal Breeding, Poznan University of Life
Sciences, Wolynska st. 33, 60-637 Poznan, Poland
Full list of author information is available at the end of the article
Wolc et al. Genetics Selection Evolution 2011, 43:23
/>Genetics
Selection
Evolution
© 2011 Wolc et al; licensee BioMed Central Ltd. This is an Open Access article distributed under the terms of the Creative Commons
Attribution License ( g/licenses/by/2.0), which permits unrestricted use, distri bution, and reprod uction in
any medium, provided the original work is properly cited.
decline in accuracy over generations was greater at low
marker densities. Solberg et al. [6] also reported that
higher marker densities help maintain accuracy over gen-
erations. These results are in agreement with those of
Habier et al. [4] who showed that 1,000 to 2,00 0 markers
are sufficient to capture most pedigree relationships and
that accuracy due to LD, which requires higher densities ,
is more persistent. Muir [7] showed that the accuracy of
GEBV declines much more rapidly over generations with
selection on GEBV compared to random selection. How-
ever, Sonesson and Meuwiss en [5] showed that the effect
of selection on accuracy was small if retraining was done
every generation. Habier et al. [4] compared the decline
in accuracy over generations for different methods of
breeding value estimation and found that the Bayesian
model averaging method Bayes-B of [1] outperformed
fixed regression least squares and a model equivalent to
genomic BLUP, i.e., the BLUP animal model using mar-
ker-based relationships. In addition, the persistency of
accuracy was greater for all marker-based methods than
for EBV obtained from standard pedigree-based BLUP
analyses.
Simulation studies provide insight into some of the
mechanisms that influence the accuracy of EBV but they
rely on assumptions for data g eneration, the validity of
which is unknown in real data, such as the number of
QTL, the distribution of their effects, and the population
history that contributed to the current LD structure.
Except for Habier et al. [8], who showed the decay in
accuracy with decreasing pedigree relationship, to our
knowledge, no studies on the dynamics of changes in
accuracy of GEBV over generations in real data are avail-
able in the literature. Thus, the objective of this study
was to evaluate the accuracy of EBV and to quantify the
persistence of accuracy over five generations using mar-
ker versus pedigree information in a co mmercial breed-
ing line of layer chickens.
Methods
Data
The data on 16 economically important tr aits measured
at early (e) or later (l) ages, along with marker genotype
data, were collected for a brown-egg layer line: age of
sexual maturity (eSM), body weight at late age (lBW),
shell colour for first three eggs (eC3), at early (eCO) and
late age (lCO), egg weight forfirstthreeeggs(eE3),at
early (eEW) and late age ( lEW), egg production at early
(ePD) and late age (lPD), puncture score at early (ePS)
and late age (lPS), albumen height at early (eAH) and late
age (lAH), yolk weight at early (eYW) and late age (lYW).
Early measurements were taken at 26-28 weeks of age.
Late measurements were taken at 42-46 weeks of age on
birds not culled after early measurements. Early and late
egg quali ty measurements were record averages on three
to five eggs. Observations deviating from the within-
hatch generation mean by more than three standard
deviations were excluded as outliers. All data used in this
study were obtained from the routine breeding program
data collection of Hy-Line Int. Birds were genotyped for
23,356 segregating SNP obtaine d from a custom high-
density Illumina SNP panel (minor allele frequency
> 0.025; maximum prop ortion of missing genotypes
< 0.05; maximum mismatch rate between parent-off-
spring pairs < 0.05). No editing was done based on GC
score. Genotyped birds within a generation included all
males and females used for breeding (approximately 60
male and 310 female parents per generation) and some
additional progeny. Data cumulated over generations are
described in Table 1. The population was under selection
for the 16 traits, using EBV from pedigree-based BLUP
(PBLUP) up to generation 3 and on a combina tion of
GEBV and phenotype afterwards.
Statistical analysis
In order to evaluate the accuracy of EBV (accuracy in
progeny), training was done on all d ata accumulated up
to a given generation and validation was on genotyped
progeny with own phenotypes. To analyze the persis-
tence of EBV accuracy (accuracy in future generations),
training was done on data accumulated through genera-
tion 1 and validation used genotypes and phenotypes of
progeny from each subsequent generation. The follow-
ing methods were used to compute EBV:
1) PBLUP - pedigree-based animal model with
REML estimates of variance components. Pedigree
starting at generation -1 was used.
2) GBLUP - reduced animal model using the geno-
mic relationship matrix estima ted by the method in
[9], with allele frequencies based on the full data set.
This model allows for the inclusion of phenotypes of
non-genotyped progeny of genotyped parents. See
[10] for details.
3) BayesA - a Bayesian model averaging method
described by [1].
4) BayesCπ - a Bayesian model averaging method
similar to the Bayes-B method in [1] but including
an estimation of the proportion of SNP with zero
effects (π) a nd assuming a common variance for all
fitted SNP [11]. A scaled inverse chi-square distribu-
tion was used as the prior for the common variance
with degrees of freedom υ
a
= 4.2 and scale para-
meter
S
2
a
=
σ
2
a
(υ
a
− 2)
0.05υ
a
K
k
=1
2p
k
(1 − p
k
)
,where
σ
2
a
is the
additive genetic va riance and p
k
is the allele fre-
quency at locus k.
Wolc et al. Genetics Selection Evolution 2011, 43:23
/>Page 2 of 8
For traits which had early and late records, single trait
and bivariate (indicated by adding b to the method’s
abbreviation) analyses were used for the PBLUP and
GBLUP methods. Bivariate analyses were not possible
for the Bayesian model ave raging methods with the
available software. The fixed effect of hatch wit hin gen-
eration was fitted in the model for PBLUP and GBLUP.
For the Bayesian model averaging methods, data were
pre-corrected for fixed effects solutions obtained from
PBLUP to enable use of family means to include pheno-
types from non-genotyped progeny of genoty ped ani-
mals (see [10] for details). For the Bayesian model
averaging methods, the chain length was 160,000 itera-
tions, with the first 50,000 excluded as the burn-in per-
iod. Analyses were performed using the software
packages ASREML [12] and GenSel [13].
The accuracy of EBV was evaluated in the validation
datasets as the correlation of EBV with hatch corrected
phenotype, divided by the square root of heritability, as
estimated in single trait PBLUP using all available data.
In order to evaluate which factors influence the accuracy
of GEBV, the following linear model was fitted to the
accuracy obtained from method i in generation j for
trait k;
y
ijk
= μ + method
i
+ b
1
generation
j
+ b
2
generation
2
j
+ b
3
π
k
+ b
4
h
2
k
+ b
5
method
i
∗ generation
j
+ b
6
π
k
∗ generation
j
+ b
7
h
2
k
∗ generation
j
+ e
i
jk
where b
1
through b
7
are regression coefficients, h
2
k
is
the estimate of heritability for trait k,andπ
k
is the esti-
mate of the proportion of SNP with zero effect, as
obtained from the BayesCπ method using all data.
Accuracy was also evaluated using the above model
equation but excluding all terms involving π (which is
equivalent to fitting average π), because in most of the
methods π is not estimated. The effect of differences
between early versus late traits in terms of the number
of phenotypes used for training (Table 1) was also evalu-
ated by adding “early versus late” as an effect in the
modelbutthiswasnotfoundtobesignificant(p>
0.05) and those results are not reported.
Results and discussion
Accuracy in progeny
For all the methods, accuracy varied substantially
between traits (Additional file 1, Figure S1), which may
be due to differences in heritability, number of records
and genetic architecture of traits. Variability in accur acy
for the same trait was larger between generations than
between methods. This is at least partially explained by
the relatively small size of the validation data sets (on
average 306 birds/generation), resulting in large sam-
pling errors of the correlation coefficient. Changes in
allele frequencies between generations due to drift and
selection may have also contributed to variability in
accuracy. The observation that differences between
methods were small compared to their standard errors
was also reported by Luan et al. [14] and Hayes et al.
[2].
Effect of training size
From generation 1 to 5, the number of observations
available for training increased about five fold (Table 1).
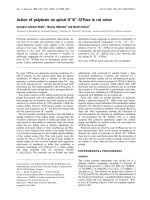
Figure 1 presents the accuracies averaged across traits
for the prediction of breeding values in the progeny gen-
eration, as information accumulates over generations.
For all the methods, accuracy tended to increase with
additional information but increases were small after
generat ion 2. The increase was greater for marker-based
methods than for PBLUP. According to [2], for a given
effective population size, the accurac y of GEBV depends
on four parameters: level of LD between markers a nd
QTL, size of the training data set, heritability, and distri-
bution of QTL effects. An increase in accuracy is
expected with an increase in size of the training popula-
tion according to results of simulation studies for both
Bayesian mod el averaging [1] and GBLUP methods [15].
For example, in [1], an increase in training size from
Table 1 Numbers of individuals with phenotypic and marker genotype data available for training and validation per
generation
Training data*
Generation Cumulated
number
genotyped
Cumulated number
genotyped with own record
Cumulated number of progeny with
genotyped parents Early/Late
Number genotyped and with own
record in validation data
0 365 0 0 -
1 777 295 2,443/342 322
2 1,215 618 4,892/804 295
3 1,628 913 7,562/1,287 357
4 2,108 1,273 9,319/1,686 274
5 2,708 1,563 11,486/2,455 262
*Training data included only phenotypes prior to a given generation; validation data consisted of hens from that generation with genotypes and own
phenotypes; these hens contributed to training data in subsequent generations; the intention was to measure all traits for the genotyped birds, therefore they
had very few missing values, at most 23 missing phenotypes for a give trait for 1,563 genotyped hens.
Wolc et al. Genetics Selection Evolution 2011, 43:23
/>Page 3 of 8
500 to 1,000 individuals led to an increase in accuracy
from 0.708 to 0.787 for BayesB and from 0.579 to 0.659
for GBLUP. An increase in accuracy with training data
size was a lso confirmed in real data in several studies
[8,11,16]. However, using Australian Holstein-Friesian
data, Moser et al . [17] reported that larger training data
sets did not result in significant gains in accuracy for
GEBV derived using Partial Least Squares Regression.
Whereas the studies by Meuwissen [1] and Goddard
[15] did not include selection, Muir [7] found that with
selection on GEBV, the accuracy of PBLUP could actu-
ally exceed accuracy of GEBV over time as the favorable
LD erodes with selection on GEBV. However, Sonesson
and Meuwissen [5] pointed out that this may no t be the
case if retraining is done every generation. In our study,
selection was on EBV from PBLUP up to generation 3
and on a combina tion of GEBV and phenotype after-
wards, and the advantage of marker-based methods over
PBLUP, in terms of accuracy, seemed to slightly increase
over generations with inc reases in the size of the train-
ing data.
Effect of π and heritability
When all available data were used for training, poster-
ior means for π obtained with the BayesCπ method
ranged fro m 0.88 to 0.99 , suggesting that from 1 to
12% of the SNP had non-zero e ffects. Habier et al. [11]
showed by simulation that trends in π estimates
obtained by the BayesCπ method agreed well with the
trends in true number of QTL. These estimates were
used as the assumed π in further analyses. Marker-
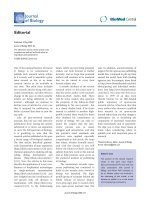
based methods resulted in greater EBV accuracy than
pedigree-based methods for a ll traits. However, the
superiority of the marker-based methods was more
pronounced for traits with higher estimates of π,pre-
sumably determined b y fewer QTL (Figure 2). The dif-
ference between pedigree and marker-based methods
also increased with heritability, however this trend was
less clear than for π (Figure 2).
In order to jointly investigate the impact of π and herit-
ability on the accuracy of marker-based models, le ast
square means from the linear regression model fitted to
accuracies were obtained. Accuracies from pedigree-based
models were omitted in this analysis because they are not
expected to depend on π, in the observed π range. Herit-
ability (p = 0.028), π (p = 0.025), h
2
k
*generation (p =
0.002) and generation
2
(p = 0.033) had an effect on accu-
racy at the 0.1 significance level. Results in Figure 3 show
that accuracy increased more with the size of the training
data for tr aits with a low estimate of π (interpreted as
determination by many loci) (Figure 3a) and high herit-
ability (Figure 3b). We observed a higher accuracy for
traits with high π with all the GEBV estimation methods.
Differences between methods were small but the ranking
of methods depended on π and heritability; with high π or
0.7
0.6
0.5
0.4
c
curacy
0.3
A
c
BayesA BayesCʋ
0.2
GBLUPb GBLUP
0.1
PBLUPb PBLUP
0
12345
Generation
Figure 1 Accuracy of EBV in progeny from training on accumulated information over generations using pedigree- (PBLUP) or marker-
based (GBLUP, BayesA, BayesCπ) methods. PBLUBb and GBLUPb indicate bivariate analyses; all other methods were single trait.
Wolc et al. Genetics Selection Evolution 2011, 43:23
/>Page 4 of 8
high heritability, methods that weighted markers differen-
tially (BayesA and BayesCπ) had the highest accuracy,
while GBLUP had the highest accuracy for traits with low
π or low heritability. Although these differences were not
significant, these trends agree with the literature [11,18].
Persistency of accuracy across generations
Method of estimation
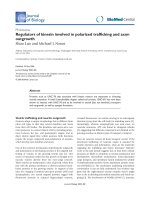
Figure 4 shows the accuracies of pedigree a nd genomic
EBV per generation, averaged over the 16 traits, when
training only on data up to generation one. This rate of
decline was observed f or pedigree-based EBV but the
accuracies of GEBV were more persistent. With the ped-
igree-based analysis, when validation and training were
more than three generations apart, the predictive ability
for some traits was practically zero ( Additional file 2,
Figure S2). For marker-based methods, the accuracy also
dropped over time but substantial accuracy was retained
even after five generations. The drop in accuracy was
greatest in the first generation,likelybecauseoflossof
info rmation through pedigree relationships. The highest
drop in accuracy in the first generation after the pheno-
typing was stopped was also observed in simulation stu-
dies [4,5]. We did not observe large differences between
GBLUP and Bayesian model averaging methods in per-
sistency of accuracy. This is in agreement with results
from [8], except for milk yield, where BayesB was more
persistent. Where available, EBV from bivariate analyses
were slightly more predictive than EBV from single-trait
analyses (Figure 2).
Effect of π and heritability
At the 0.1 significance level, h
2
(p = 0.063), generation (p =
0.002), generation
2
(p = 0.0001), π*generation (p = 0.054),
and h
2
*generation (p = 0.092) had an effect on accuracy.
Least square means from the linear regression model (Fig-
ure 3C) suggest higher persistency of accuracy over time
for traits with high estimates of π (egg weight, body
weight), indicating that the GEBV for these trait s capture
more information through LD or linkage with QTL, com-
pared to traits which seem to be more polygenic a nd
where markers explain mostly pedigree relationships.
Traits with a low heritability showed less persistent
accuracy.
With five generations separating t raining and valida-
tion, accuracy in the last generation in Additional file 2,
Figure S2 should be a good estimate of accuracy due to
LD. Goddard [15] showed that accuracy due to LD from
GBLUP depends on the number of independent
09
1
0.8
0
.
9
0.7
0.6
a
cy
0.4
0.5
Accur
a
0.3
0.2
BayesA BayesCʋ
GBLUPb GBLUP
0
0.1
PBLUPb PBLUP
ʋ h2
h
2
0
lAH eSM eYW ePS lCO lPS eC3 ePD eCO lPD eAH lYW eEW eE3 lEW lBW
Tr
a
i
t
Figure 2 Average accuracy across gener ations of EBV in progeny from tr aining on accumulated informati on using pedigree (PBLUP)
and marker based (GBLUP, BayesA, BayesCπ) models. PBLUBb and GBLUPb indicate bivariate analyses; all other methods were single trait;
traits are ranked by the estimate of π from model BayesCπ.
Wolc et al. Genetics Selection Evolution 2011, 43:23
/>Page 5 of 8
0.7
0.7
BayesAʋ=
0
.
99
c
0.5
0.6
0.5
0.6
y
BayesCʋʋ=0.99
GBLUPbʋ=0.99
GBLUPʋ=0.99
c
a
0.2
0.3
0.4
Accurac
y
0.2
0.3
0.4
Accurac
y
BayesAʋ=0.8
BayesCʋʋ=0.8
GBLUPbʋ=0.8
GBLUP
ʋ=0 8
0
0.1
1
2
3
4
5
0
0.1
1
2
3
4
5
GBLUP
ʋ=0
.
8
Expectedʋ=0.99
Expectedʋ=0.8
1
2
3
4
5
Generation
06
0.7
b
1
2
3
4
5
Generation
06
0.7
BayesAh2=0.7
BayesCʋh2=0.7
d
h
2
h
2
0.4
0.5
0
.
6
r
acy
0.4
0.5
0
.
6
r
acy
GBLUPbh2=0.7
GBLUPh2=0.7
BayesAh2=0.2
h
2
h
2
h
2
h
2
0.2
0.3
Accu
r
0.2
0.3
Accu
r
BayesCʋh2=0.2
GBLUPbh2=0.2
GBLUPh2=0.2
Expected h2=0 7
h
2
h
2
h
2
h
2
0
0.1
12345
Generation
0
0.1
12345
Generation
Expected
h2=0
.
7
Expectedh2=0.2
h
2
h
2
Generation
Generation
Figure 3 Least square means for accuracy of marker-based methods over time when predicting progeny using accumulating data (a,
b) or when predicting future generations when training on data prior to Generation 1 (c, d). In a and c: comparison of accuracy for traits
with different estimates of π for heritability of 0.5; in b and d: comparison for traits with different heritabilities, ignoring π; broken lines are
expected declines in accuracy based on declines in genetic relationships
0.7
BayesA BayesCʋ
0.6
GBLUPb GBLUP
0.5
PBLUPb PBLUP
Exp PBLUP
Exp GBLUP
0.4
c
curacy
Exp
PBLUP
Exp
GBLUP
0.3
A
c
0.2
0.1
0
12345
Generation
Figure 4 Accura cy of EBV from t raining on g eneration 1 i n subsequent generations using pedigree- (PBLUP) and marker-base d
(GBLUP, BayesA, BayesCπ) models, compared to the expected decline of accuracy based only on the decay of relationships (Exp
PBLUP, Exp GBLUP).
Wolc et al. Genetics Selection Evolution 2011, 43:23
/>Page 6 of 8
chromosomal segments. Daetwyler et al. [18] have
shown that accuracy due to LD is expected to depend
on the smaller of the numb er of QTL and the number
of independent chromosomal segments for Bayesian
model averaging met hods . On the other hand, they rea-
soned that accuracy for GBLUP does not depend on the
number of QTL [18]. In our study, the average accuracy
for the four traits with the highest π estimates was 0. 52,
0.48 and 0.43 for BayesCπ , BayesA and GBLUPb, and
0.23, 0.23 and 0.24 for the four traits with the lowest π.
This confirms the theoretical prediction that Bayesian
model averaging methods have a higher accuracy for
traits that are determined by a small number of genes
compa red to traits determined by many genes, as classi-
fied according to the π estimate. However, our results
show that accuracy of GBLUP changed with π,incon-
trasttowhatwaspredictedby[18]butthismaybe
caused by other factors that can contribute to the differ-
ences in accuracies between traits, such as the distribu-
tion of QTL effects and non-additive or more complex
types of genetic determination. On average, accuracy
due to LD (retained after five generations) was similar
for all marker-based methods, as was also the rate of
decline in accuracy. Habier et al. [8] reported similar
results for somatic cell score and fat yield, however, they
found that for other traits, accuracy due to LD o f
BayesB was higher than for GBLUP, especially for larger
training size. Based on simulation results [19], accuracy
and its persistency are expected to increase with increas-
ing marker density for the BayesB method.
Conclusions
Using real data on egg production and quality traits in
layers, this study confirms that the accuracy of EBV
based on dense marker data is on average higher than
that based on pedigree. An increase in size of the train-
ing data improved the accuracy of all methods but not
tothedegreeexpectedbasedontheory,possiblyasa
result of the p opulation being under selection. Marker-
based methods had greater advantage over PBLUP, in
terms of accuracy, for traits with a high estimate of π,
which implies a small number of QTL with large effects.
There were no significant differences between BayesA,
BayesCπ and GBLUP methods in average accuracy or
persistency of accuracy across traits. The accuracy of
the marker-based EBV was more persistent than that of
pedigree-based EBV o ver generations, which indicates
that markers capture informationonQTLthroughLD
and/or linkage. However, the initial drop of accuracy
due t o loss of pedigree relationships limits the value o f
gen omic predictions further than one generation ahead.
When training was on data from generation 0, accuracy
in generation 1 was 0.43 and dropped to 0.33 in genera-
tion 2. However, when data from generations 0 and 1
were used for retraining, accuracy in generation 2
increased to 0.49. Retraining every generation is r ecom-
mended for genomic selection in closed breeding
populations.
Additional material
Additional file 1: Figure S1 - Accuracy of prediction in the progeny
generation with accumulating data. A: PBLUPb; B: BayesA; C: G BLUPb;
D: BayesCπ
Additional file 2: Figure S2 - Accuracy of prediction in subsequent
generations when training on data prior to Generation 1. A: PBLUPb;
B: BayesA; C: GBLUPb; D: BayesCπ
Acknowledgements
This study was supported by Hy-Line Int., the EW group, and Agriculture and
Food Research Initiative competitive grants 2009-35205-05100 and 2010-
65205-20341 from the USDA National Institute of Food and Agriculture
Animal Genome Program. Ian White helped with the REML analysis.
Author details
1
Department of Genetics and Animal Breeding, Poznan University of Life
Sciences, Wolynska st. 33, 60-637 Poznan, Poland.
2
Department of Animal
Science and Center for Integrated Animal Genomics, Iowa State University,
Ames, IA 50011-3150, USA.
3
Hy-Line International, Dallas Center, IA 50063,
USA.
4
Lohmann Tierzucht GmbH, 27472 Cuxhaven, Germany.
Authors’ contributions
All authors conceived the study, contributed to methods and to writing the
paper and also read and approved the final manuscript. AW undertook the
analysis and wrote the first draft. Data were prepared by JA, PS, JF and NPO.
JCMD provided overall oversight of the project.
Competing interests
The authors declare that they have no competing interests.
Received: 14 February 2011 Accepted: 21 June 2011
Published: 21 June 2011
References
1. Meuwissen THE, Hayes BJ, Goddard ME: Prediction of total genetic value
using genome-wide dense marker maps. Genetics 2001, 157:1819-1829.
2. Hayes BJ, Bowman PJ, Chamberlain AJ, Goddard ME: Genomic selection in
dairy cattle: Progress and challenges. J Dairy Sci 2009, 92:433-443.
3. Dekkers JCM: Use of high-density marker genotyping for genetic
improvement of livestock by genomic selection. CAB Reviews: Perspectives
in Agriculture, Veterinary Science, Nutrition and Natural Resources 2010, 5:037
[ />4. Habier D, Fernando RL, Dekkers JCM: The impact of genetic relationship
information on genome-assisted breeding values. Genetics 2007,
177:2389-2397.
5. Sonesson AK, Meuwissen THE: Testing strategies for genomic selection in
aquaculture breeding programs. Genet Sel Evol 2009, 41:37.
6. Solberg TR, Sonesson AK, Woolliams JA, Ødegard J, Meuwissen THE:
Persistence of accuracy of genome-wide breeding values over
generations when including a polygenic effect. Genet Sel Evol 2009, 41:53.
7. Muir WM: Comparison of genomic and traditional BLUP-estimated
breeding value accuracy and selection response under alternative trait
and genomic parameters. J Anim Breed Genet 2007, 124:342-355.
8. Habier D, Tetens J, Seefried FR, Lichtner P, Thaller G: The impact of genetic
relationship information on genomic breeding values in German
Holstein cattle. Genet Sel Evol 2010, 42:5.
9. VanRaden PM: Efficient methods to compute genomic predictions.
J Dairy Sci 2008, 91:4414-4423.
10. Wolc A, Stricker C, Arango J, Settar P, Fulton JE, O’Sullivan NP, Preisinger R,
Habier D, Fernando R, Garrick DJ, Dekkers JCM: Breeding value prediction
Wolc et al. Genetics Selection Evolution 2011, 43:23
/>Page 7 of 8
for production traits in layers using pedigree or genomic relationships
in a reduced animal model. Genet Sel Evol 2011, 43:5.
11. Habier D, Fernando RL, Kizilkaya K, Garrick DJ: Extension of the Bayesian
alphabet for genomic selection. BMC Bioinformatics 2011, 12:186.
12. Gilmour AR, Gogel BJ, Cullis BR, Thompson R: ASReml user guide Release
3.0. VSN Int Ltd; 2008.
13. Fernando RL, Garrick DJ: GenSel - user manual. 2009.
14. Luan T, Woolliams JA, Lien S, Kent M, Svendsen M, Meuwissen THE: The
accuracy of genomic selection in Norwegian red cattle assessed by
cross-validation. Genetics 2009, 183:1119-1126.
15. Goddard ME: Genomic selection: Prediction of accuracy and
maximisation of long term response. Genetica 2009, 136:245-257.
16. VanRaden PM, Van Tassell CP, Wiggans GR, Sonstegard TS, Schnabel RD,
Taylor JF, Schenkel FS: Reliability of genomic predictions for North
American Holstein bulls. J Dairy Sci 2009, 92:16-24.
17. Moser G, Tier B, Crump RE, Khatkar MS, Raadsma HW: A comparison of five
methods to predict genomic breeding values of dairy bulls from
genome-wide SNP markers. Genet Sel Evol 2009, 41:56.
18. Daetwyler HD, Pong-Wong R, Villanueva B, Woolliams JA: The impact of
genetic architecture on genome-wide evaluation methods. Genetics 2010,
185:1021-1031.
19. Meuwissen THE, Goddard ME: Accurate prediction of genetic values for
complex traits by whole genome resequencing. Genetics 2010,
185:623-631.
doi:10.1186/1297-9686-43-23
Cite this article as: Wolc et al.: Persistence of accuracy of genomic
estimated breeding values over generations in layer chickens. Genetics
Selection Evolution 2011 43:23.
Submit your next manuscript to BioMed Central
and take full advantage of:
• Convenient online submission
• Thorough peer review
• No space constraints or color figure charges
• Immediate publication on acceptance
• Inclusion in PubMed, CAS, Scopus and Google Scholar
• Research which is freely available for redistribution
Submit your manuscript at
www.biomedcentral.com/submit
Wolc et al. Genetics Selection Evolution 2011, 43:23
/>Page 8 of 8