Báo cáo sinh học: "Segregation of a major gene influencing ovulation in progeny of Lacaune meat sheep" pdf
Bạn đang xem bản rút gọn của tài liệu. Xem và tải ngay bản đầy đủ của tài liệu tại đây (314.64 KB, 18 trang )
Genet. Sel. Evol. 34 (2002) 447–464 447
© INRA, EDP Sciences, 2002
DOI: 10.1051/gse:2002017
Original article
Segregation of a major gene
influencing ovulation in progeny
of Lacaune meat sheep
Loys B
ODIN
a∗
, Magali S
AN
C
RISTOBAL
b
,
Frédéric L
ECERF
b
, Philippe M
ULSANT
b
, Bernard B
IBÉ
c
,
Daniel L
AJOUS
a
, Jean-Pierre B
ELLOC
d
, Francis E
YCHENNE
e
,
Yves A
MIGUES
f
, Jean-Michel E
LSEN
a
a
Station d’amélioration génétique des animaux,
Institut national de la recherche agronomique,
BP 27, 31326 Castanet-Tolosan, France
b
Laboratoire de génétique cellulaire,
Institut national de la recherche agronomique,
BP 27, 31326 Castanet-Tolosan, France
c
Département de génétique animale,
Institut national de la recherche agronomique,
BP 27, 31326 Castanet-Tolosan, France
d
Coopérative OVI-TEST, Route d’Espalion,
12850 Onet-le-Château, France
e
Domaine expérimental de Langlade,
31450 Montgiscard, France
f
Labogena, Domaine de Vilvert, 78352 Jouy-en-Josas, France
(Received 17 September 2001; accepted 13 February 2002)
Abstract – Inheritance of the ovulation rate (OR) in the Lacaune meat breed was studied
through records from a small nucleus of 36 hyper-prolific ewes screened on farms on the basis
of their natural litter size, and from progeny data of three selected Lacaune sires. These sires
were chosen at the AI centre according to their breeding values estimated for the mean and the
variability of their daughters’ litter size. Non-carrier Lacaune dairy ewes were inseminated to
produce 121 F1 daughters and 27 F1 sons. Twelve sons (four from each sire) were used in turn
to inseminate non-carrier Lacaune dairy ewes providing 260 BC progeny ewes. F1 and BC
progeny were brought from private farms and gathered after weaning on an experimental farm
where ovulation rates were recorded in the first and second breeding seasons. With an average
of 6.5 records each, the mean OR of hyper-prolific ewes was very high (5.34), and 38.4% of
records showed a rate of 6 or more. F1 data showed high repeatability of OR (r = 0.54)
within ewe, with significant variability among ewes. High OR (≥ 4) were observed in each
∗
Correspondence and reprints
E-mail:
448 L. Bodin et al.
family. A segregation analysis provided a significant likelihood ratio and classified the three
founders as heterozygous. BC ewes also displayed high repeatability of OR (r = 0.47) and the
mean OR varied considerably between families (from 1.24 to 1.78). Seven of the 12 BC families
presented high-ovulating ewes (at least one record ≥ 4) and segregation analysis yielded a highly
significant likelihood ratio as compared to an empirical test distribution. The high variability
of the mean ovulation rate shown by a small group of daughters of BC ewes inseminated by
putative carrier F1 rams, and the very high ovulation rate observed for some of these ewe
lambs, confirmed the segregation of a major gene with two co-dominant alleles borne by an
autosome. The difference between homozygous non-carriers and heterozygous ewes was about
one ovulation on the observed scale and 2.2 standard deviations on the underlying scale.
sheep / major gene / ovulation
1. INTRODUCTION
Since 1982, when evidence of the first major gene for prolificacy was found
by Piper and Bindon [23], and Davis et al. [7] in Booroola Merinos, various
authors like Hanrahan and Owen [13], Hanrahan [12], Jonmundsson and Adal-
steinsson [17], Bradford et al. [4], Radomska et al. [26], and Davis et al. [5]
have suspected or demonstrated that ovulation in other sheep breeds could
also result from mixed (polygenic background + major gene) inheritance. In
addition, Galloway et al. [11] have found the DNA mutation responsible for the
Inverdale genotype shown by Davis et al. [6,8]. Moreover Mulsant et al. [20]
and Wilson et al. [30] have discovered the DNA mutation for the Booroola
genotype. The Lacaune breed with 1.2 million ewes is the major French sheep
breed. Several strains exist, each being bred for a specific purpose i.e. milk
or suckling lamb production. In 1975, the artificial insemination co-operative
(OVI-TEST) implemented an on-farm selection scheme designed to improve
prolificacy [22]. During the first 20 years, natural prolificacy was the main
objective, but significant progress then led to consider new objectives like
meat traits. The large and fast selection response for prolificacy, reputed to
be difficult to select for, together with several other indications suggested non
polygenic inheritance of prolificacy in this selected population. The main
points observed were:
• A fast and high response to selection. The mean prolificacy of ewe lambs
mated in June-July at about 11 months of age was 1.28 in 1975 [2]. Using
similar management, at the same age and season, prolificacy was 1.98 in
1996 for five pioneer flocks, which were the only flocks that had been under
selection since 1975.
• The occurrence of an exceptionally high litter size. Some ewes presented
repeatedly exceptional prolificacy (≥ 4) when compared to the population
mean. The number of these hyper-prolific ewes has increased very quickly
over the last few years.
Major gene for ovulation rate in Lacaune sheep 449
• A very high heritability coefficient for the litter size (h
2
∼ 0.4 [1,27]),
which did not agree with conventional values as expressed in the literature.
As quoted by Le Roy and Elsen [18], high heritability coefficient values are
the first indicators of segregation of a major gene.
• It was also observed that some sires with very high breeding values, as
estimated using a sire model through performance of their daughters, had
very low breeding values when estimates were made through performance
of their granddaughters alone [3]. Assuming there to have a dominant major
gene controlling prolificacy, sons of these sires could have inherited the
wrong alleles of this segregating gene.
• Preliminary segregation analysis performed on litter size recorded within
the nucleus led to the rejection of a strictly polygenic inheritance of prolific-
acy [9].
• Estimations of genetic components of litter size with a heteroscedastic model
as developed by SanCristobal-Gaudy et al. [28] showed variances between
sires to be heterogeneous.
However, none of these observations constituted formal proof of the exist-
ence of a major gene, and a specific program aiming to observe possible gene
segregation was devised in order to clarify the situation [3]. This program is
based on the hypothesis that prolificacy in the Ovitest Lacaune strain is partially
controlled by a major gene with two alleles: L (inducing higher ovulation) and
+ (or wild). The results of these observations are reported in the present paper.
2. MATERIALS AND METHODS
Two experiments were set up in order to determine the existence of a
putative major gene in the Lacaune population managed by OVI-TEST. The
first concerned the screening on farms of a few hyper-prolific ewes and the
observation of their ovulation rates over several cycles on an experimental
farm. The second aimed at observing the segregation of the putative gene
within half-sib progeny of three potential carrier sires and of twelve of their
sons back-crossed to non-prolific Lacaune strains.
2.1. Establishing a nucleus of hyper-prolific Lacaune ewes
2.1.1. Screening of ewes on farms
In July 1996 and 1997, extensive screening of hyper-prolific ewes was carried
out on about 40 farms in the OVI-TEST selection scheme. Selection was made
in a population of about 10 000 adult ewes, although only those which were
neither pregnant nor suckling at the dates of screening were considered. A
very small sample (18 ewes each year) was selected on the basis of breeding
450 L. Bodin et al.
value for prolificacy as estimated by the national recording system [24], and of
their own performance. They had lambed more than twice in natural conditions
(without oestrus synchronisation), and had had either a litter size ≥ 3 twice, or
a litter size ≥ 5 once. They were brought from private farms to Langlade: an
Inra experimental centre.
2.1.2. Ovulation rate controls
Ovulation rates were recorded several times (up to 12) by laparoscopy,
either during an induced cycle, five to eight days after oestrus synchronisation
(a vaginal sponge inserted for 14 days without PMSG at withdrawal), or during
the two following cycles (three and six weeks after the first observation).
2.2. Progeny test design
2.2.1. Animals
In April 1996, the 157 Lacaune sires then in the OVI-TEST selection scheme
AI Centre had their breeding values estimated using a heteroscedastic model
fitting the natural prolificacy of their daughters. This model [27] allows
individual breeding values for the mean (u) and for the variability of litter
size (v) to be estimated together. Three rams were chosen for having high
breeding values for the mean litter size and for the litter size variability of
their daughters, and were consequently thought to be heterozygous for the
putative major gene. These three rams were used for artificial insemination of
178 adult Lacaune dairy ewes (a reputedly non-prolific strain) on six private
farms, and of 72 adult Lacaune ewes of the “Gebro strain” (a Lacaune strain of
suckling ewes known not to be prolific) on the Inra Langlade farm. “F1” ewe
lambs born on the private farms from these inseminations were bought after
weaning at two months of age (n = 86) and put together with those born on the
experimental farm (n = 35). F1 ram lambs (n = 24) born on the private farms
were also bought by the OVI-TEST insemination centre and reared as semen
producers. Three other F1 rams born from the AI carried out on the Langlade
farm were also kept and reared as future semen producers. In August 1997,
twelve of these sons (11 born on private farms from Lacaune dairy ewes and
one born on the Langlade farm from a Gebro Lacaune ewe) were then used to
inseminate dairy or Gebro Lacaune ewes (respectively 716 and 65 adult ewes).
As with the first generation, after weaning, back-cross (BC) ewe lambs were
gathered on the Langlade farm (n = 260). At the end of their first breeding
season, and after three ovulation records, a small sample of high-ovulating BC
ewes were selected and inseminated with semen from six F1 rams which were
expected to be L+ (heterozygous for the putative major gene) on the basis of
the first three OR of their daughters. Ewe lambs (F1 × BC; n = 31) born of
these inseminations were kept for control purposes. The other BC ewes were
inseminated by Ile-de-France rams for lamb production.
Major gene for ovulation rate in Lacaune sheep 451
A I w i t h ♂ for A I w i t h s e l e c t e d F 1 r a m s
m e a t p rod u c t i on
O R 1 ; 2 ; 3
O R 4 ; 5 ; 6
O R 1 ; 2 ; 3
S e p t . 9 6
A u g . 9 7
J a n . 9 8
D e c . 9 8
J a n . 0 0
A p r i l 9 6
1 2 1 ♀ F 1
2 7 ♂ F 1
1 2 ♂ F 1 x 7 8 1 ♀ ( n o t p r o l i f i c L a c a u n e )
M a y 9 8
2 6 0 ♀ B C
M a y 9 9
S e p t . 9 9
3 ♂ x 2 5 0 ♀ ( n o t p r o l i f i c
L a c a u n e )
O R 4 ; 5
l a m b i n g
A u g . 0 0
x
x
3 1 ♀ F 1 x B C
O R 1 ; 2 ; 3
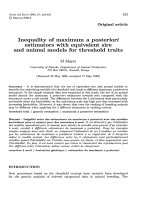
Figure 1. Schedule and design of the progeny test of three putative carrier sires.
2.2.2. Phenotype observations
Oestrus in the F1 and BC ewe lambs was synchronized using a vaginal
sponge (without PMSG injection) when they were about eight months old. In
order to determine the ovulation rate, numbers of corpora lutea were counted
using laparascopy between four and eight days after sponge withdrawal and
then three and six weeks later for the two subsequent cycles. When they were
24 months old, laparoscopy was again performed on the F1 and BC ewes
two and three times respectively. Figure 1 summarises the schedule of this
experiment. It is worth noting that after the first series of observations and
mating, the BC ewes, which lambed, reared their lambs until weaning at about
three months of age.
All animals in this program were bled and the extracted DNA was used for
confirmation of paternity, and frozen for future research of DNA markers.
2.3. Statistical analysis
Variation factors of OR to be included in the later segregation analysis
were determined by BLUP on the F1 data using the Proc mixed procedure
452 L. Bodin et al.
(SAS
R
) and considering four fixed effects: the origin of the dam (Dairy or
Gebro Lacaune ewes); the laparoscopy number which includes the effects of
date and age (8 and 24 months); the suckling state (not having lambed, or
long interval since weaning vs. short interval since weaning) and the founder
sire. The ewes nested within their respective sire were considered as random
effects. For the BC data, similar analyses were performed considering the
same four fixed effects, but in this case, the sires nested within the grandsire
and the ewes nested within their respective sire were considered as random
effects; no relationships between random effects were considered. Variance
components of OR (on the observable scale) were estimated by REML, and
finally heritability was calculated regarding the sire variance as a quarter of the
additive genetic variance.
As in Le Roy et al. [19] and Ilahi et al. [16], a segregation analysis method
was run, comparing likelihoods under two inheritance hypotheses:
• H1: mixed inheritance hypothesis. This model describes the transmission
of ovulation rate ability by polygenic effects to which a major gene effect
is added. The model assumes that the observed ovulation rate is related to
an underlying normal distribution rate and to a set of fixed thresholds which
impose discontinuity in its visible expression. We assume that only two
alleles (L and +) segregate and, according to the particular pattern of crosses,
that two or three genotypes can be encountered: LL, L+ and ++. The
parameters to be estimated are: the thresholds, the mean of each genotype
(µ++, µL+, µLL), and their respective frequency (p++, pL+ and pLL),
for the sires. Parameters that have been fixed in the model are: the allele
frequencies for the dams (p++ = 1.0 while pL+ and pLL = 0.0), as well
as heritability (h
2
= 0.29) and repeatability (r = 0.42); these values coming
from previous analyses of a large data set of Mérinos d’Arles ovulation rates
are much more precise than parameters estimated in the present sample.
• H0: polygenic inheritance hypothesis. This model, which is a sub-model of
the H1 mixed inheritance hypothesis, merely assumes that: p++ = 1 for
the sires.
The likelihoods
0
and
1
were computed respectively for the hypotheses
H0 and H1, and the ratio L = −2 log(
0
/
1
) compared with a threshold τ. The
estimation of parameters maximising the likelihoods was carried out using the
Gauss-Hermit quadrature (D01BAF) and optimisation (E04JYF) subroutines
of the NAG FORTRAN Library [21] with a quasi-Newton algorithm in which
the derivatives were estimated by finite differences.
A first segregation analysis was performed on the F1 data. The model
considered five ovulation rates of the F1 daughters, progeny of the three founder
sires and 128 homozygous ++ dams. It also included the fixed effects which
were found significant in the previous analysis: the age when laparoscopy was
Major gene for ovulation rate in Lacaune sheep 453
Table I. Empirical thresholds of rejection of the H0 hypothesis deducedby segregation
analysis of 1200 samples randomly simulated under the H0 hypothesis.
Threshold = τ Number of replicates with L > τ Corresponding α risks
4.26 120 0.10
6.04 60 0.05
10.12 11 0.01
13.31 1 0.001
carried out, and the origin of the dam. A second analysis was performed on the
six OR records of the BC population, progeny of the 12 sons of the founders
and 228 homozygous ++ dams. It considered the grand-sire, the age at which
laparoscopy was carried out, the origin of the dam and the rearing status as
fixed effects. Ewes classified as L+ had a probability of over 0.85, while those
classified as ++ had a probability of less than 0.15; for L+ sires the minimum
probability was 0.98.
The polygenic inheritance hypothesis is rejected when L > τ. The exact
distribution of the likelihood ratio is unknown. Usually, a χ
2
test is performed
with the degrees of freedom equal to the number of parameters to be fixed
for going from H1 to H0. However, as noticed by Titterington et al. [29],
this rule does not apply in mixture analysis. We therefore carried out similar
analyses on two Booroola data samples of comparable size in which we knew
that a major gene was segregating. We also computed an empirical rejection
threshold from simulations. The actual structure of pedigree and performance
of the BC populations (242 daughters of 12 sires and 228 dams; six records of
OR) was used to generate 2 000 replicates under polygenic transmission which
were submitted to segregation analysis. The rejection thresholds with desired
α risks are directly given by the distribution of the likelihood ratio and are
summarised in Table I.
3. RESULTS
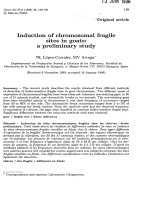
3.1. Ovulation of hyper-prolific ewes
The ovulation rate distribution observed in the small nucleus of hyper-prolific
ewes is given in Figure 2. The mean ovulation rate was very high (µ = 5.34;
n = 229), with 24.7% of recorded rates being ≥ 7 (38.9% ≥ 6) while only
20.3% were ≤ 3. The maximum observed was 20, and single ovulation was
observed only twice. The two highest-ovulating ewes presented an average of
12.4 and 11.5 corpora lutea respectively over five and six records.
454 L. Bodin et al.
0
1 0
2 0
3 0
4 0
5 0
1 2 3 4 5 6 7 8 9 1 0 1 1 1 2 1 3 1 4 1 5 1 6 1 7 1 8 1 9 2 0
OR
n
Figure 2. Distribution of ovulation rates observed in the small hyper-prolific nucleus.
3.2. Ovulations of F1 daughters
Distribution of ovulations in F1 daughters of the three founders is displayed
in Table II. In the first set of observations in July-August 1997, the ewe lambs
were relatively young and for this reason a high percentage did not respond to
the synchronisation treatment used without PMSG injection. Thus, 37.2, 61.4
and 33.6% of the ewes did not ovulate in the first, second and third observations
respectively. In contrast, when these F1 ewes were two years old, very few did
not ovulate (< 2%).
The mean ovulation rate was 2.04 at 11 months of age (1.86, 2.11 and
2.13 respectively for the three founders), increasing in the second year
(OR
2y
= 3.03) with 68.80% the ewes displaying at least once an ovulation
rate of three or more. These high-ovulating ewes were found in each family.
Among ewes with three ovulation records during their first year, two sets of
ewes with significant differences in OR could be clearly observed in each
family, respectively: 1.30 and 2.29 − 1.44 and 2.73 − 1.38 and 2.60.
Variance analysis considering the sire (founder sires) and the date of obser-
vation (1 to 5) as fixed effects, and ewe within sire as a random effect, enabled
ovulation rate repeatability (r = 0.54) and a small but significant difference
between sires to be estimated. Segregation analysis using these data (5 OR
per female; 372 records) yielded a likelihood ratio of 14.3 (Tab. V). Based on
this analysis, the three founders were classified as heterozygous and the effect
of the gene was found to be 1.09 ovulation on the observed scale and 1.72
standard deviations on the continuous underlying scale.
Major gene for ovulation rate in Lacaune sheep 455
Table II. Distribution of OR at each observation stage according to the type of female and their age.
Date of recording OR Total µ (OR = 0) % 0
0 1 2 3 4 5 6 7
Daughters 01–07-97 42 22 25 17 3 3 1 113 2.20 37.2
of 3 founders (F1) 23–07-97 70 19 17 7 1 114 1.77 61.4
10–11 months 12–08-97 38 21 32 20 1 1 113 2.05 33.6
F1 16–10-98 1 6 35 27 13 6 5 1 94 2.97 1.1
25–26 months 06–11-98 2 3 28 29 25 4 3 94 3.09 2.1
Daughters 25–11-98 9 156 67 8 3 243 1.39 3.7
of 12 sons (BC) 14–12-98 6 140 74 17 5 242 1.52 2.5
10–11 months 07–01-99 37 121 71 8 6 243 1.51 15.2
Daughters 06–12-99 20 95 82 10 3 1 211 1.60 9.5
of 12 sons (BC) 22–12-99 23 85 78 18 5 209 1.69 11.0
24 months 10–01-00 24 82 79 19 3 207 1.69 11.6
Total 272 750 588 180 68 15 9 1 1 883 1.78 14.4
456 L. Bodin et al.
Table III. Sire effect on OR of the BC daughters.
Sire
†
Geno.
‡
Ewe Number Standard CV Lsmeans
number of rcds deviation
A_104 L+ 11 52 0.81 0.46 1.66
A_108 L+ 19 98 0.74 0.45 1.58
A_114 ++ 19 103 0.48 0.36 1.27
A_118 ++ 15 75 0.49 0.38 1.25
B_109 L+ 14 61 0.85 0.50 1.62
B_115 L+ 21 92 0.91 0.49 1.76
B_121 ++ 20 107 0.57 0.42 1.28
B_122 L+ 17 80 0.91 0.50 1.78
C_102 L+ 13 64 0.96 0.53 1.77
C_110 L+ 25 130 0.77 0.48 1.55
C_119 ++ 22 121 0.48 0.37 1.24
C_960856 ++ 46 253 0.54 0.35 1.50
Total 242 1 236
†
The first letter indicates the founder family.
‡
According to the segregation analysis.
3.3. Ovulation of BC ewes
When they were less than one year old, the 245 BC ewe lambs presented
a lower ovulation rate (OR
11m
= 1.47) than the F1 ewes at a similar age
(OR
11m
= 2.04). However, in spite of this young age very few failed to ovulate
(Tab. II) in the first two series of observation in full breeding season (3.7 and
2.5% respectively in November and early December), while for the last series,
which occurred in January, some ewe lambs had already finished their first
breeding season and did not ovulate (15.2%). Ovulation rates were higher
when ewes were older (Tab. II), but the increase with age was not as high as
that observed for the F1 ewes. Variance analyses were also performed on F1
data with a model considering as fixed effects the origin of the dam (dairy or
Gebro Lacaune ewe), the grandsire, the date of observation and the suckling
status, and as random effects, sire and ewe within sire. Repeatability was
estimated at 0.48 and heritability at 0.30. However, considering the sire as a
fixed effect showed significant differences among sires (Tab. III).
From the distribution of the greatest OR of each ewe (Tab. IV), it can be
seen that there are two groups of sire family according to the percentage of
daughters displaying an ovulation rate of three or more (
OR ≥ 3) at least
once, recorded at about 11 months of age. Addition of ovulation rates recorded
Major gene for ovulation rate in Lacaune sheep 457
Table IV. Distribution of the highest ovulation rate in BC ewes per sire family.
% of
OR>3
n of
with at least n
once OR > than
Sire Geno.
†
< 1 year global 0 1 2 3 4 5
A_104 L+ 0.27 0.45 1 1 5 4 1 12
A_108 L+ 0.16 0.42 5 6 6 2 19
A_114 ++ 0.00 0.00 6 13 19
A_118 ++ 0.00 0.07 6 8 1 15
B_109 L+ 0.14 0.29 5 5 2 2 14
B_115 L+ 0.33 0.38 3 10 5 2 1 21
B_121 ++ 0.05 0.20 1 5 11 4 21
B_122 L+ 0.29 0.35 4 7 3 3 17
C_102 L+ 0.31 0.38 4 4 1 4 13
C_110 L+ 0.20 0.32 1 6 11 5 3 26
C_119 ++ 0.05 0.05 6 15 1 22
C_960856 ++ 0.04 0.09 7 35 3 1 46
Total 0.14 0.22 3 58 130 35 18 1 245
†
According to the segregation analysis.
at two years of age allowed the same families to be distinguished, and it is
worthwhile noting that the increase of OR ≥ 3 with age was generally very
low in families where the percentage observed at about 11 months was already
low.
The likelihood ratio in the segregation analysis (L = 41.3; Tab. V) was
much higher than our empirical threshold for a 1‰ α risk (Tab. I). The gene
effect was about one ovulation on the observed scale, and seven sires out of
12 were found to be heterozygous with a probability estimated at over 0.98.
The number of heterozygous sires was respectively two, three and two for each
founder family, which agrees with the independent results obtained in the F1
analysis also showing the three founders to be heterozygous.
3.4. Ovulation of F1 × BC daughters
Table VI shows the first three records of daughters of BC ewes sired by F1
rams. Although the highest-ovulating BC ewes were chosen for mating with
F1 rams after their first three records, the segregation analysis performed later
when six records were available allowed us to classify some of these ewes
as non-carriers. These mis-classifications concerned the few high-ovulating
daughters of non-carrier F1 rams. Extremely high ovulation rates were
observed repeatedly in some F1 × BC ewes while others showed only low
458 L. Bodin et al.
Table V. Results of segregation analyses on different samples.
Genotype Lacaune Booroola Booroola
Mérinos Romanov
Samples 3 founders sires 12 sons 12 sires 10 sires
F1 BC
Age of OR (months) 11 & 24 11 & 24 13 13
Records/ 5 6 3 2
Total records 372 1 236 360 293
Ovulation mean 2.01 1.56 1.26 2.87
Gene effect
(underlying scale) 1.72 2.22 3.20 3.46
(observed scale) 1.09 1.05 1.15 1.81
µ++ (obs. scale) 1.94 1.24 1.02 1.98
µL+ (obs. scale) 3.03 2.29 2.17 3.79
nb. of heteroz. sires 3 / 3 7 / 12 4 / 12 5 / 10
Likelihood ratio 14.3 41.2 35.2 61.8
ovulation rates, with a high degree of repeatability within ewe (r = 0.70). The
++ BC ewes produced two groups of daughters: one group never displayed
an ovulation rate higher than two (as with most of the ++ BC ewes when they
were young), while the other group reached as many as four and showed an
OR pattern very close to that of the young L+ BC ewes. The few L+ BC ewes
sired by L+ rams produced three groups of daughters. A first group classified
as ++ for the pattern of their OR similar to the pattern of ++ BC; a second
group classified as L+ for having the same pattern as their dam; and a third
high-ovulating LL group which displayed ovulation which had never before
been observed, either among F1 daughters of the founder rams or among the
BC daughters of the F1 rams, either during the first breeding season or even at
the adult stage.
3.5. DNA analyses
Within the F1 and BC families, the BMPR-1B mutation responsible for
the Booroola genotype [20,30] was not found. Moreover, there was no co-
segregation of ovulation with markers of the Booroola locus, which allowed us
to exclude the involvement of the Booroola mutation and other possible alleles
at the same locus.
Major gene for ovulation rate in Lacaune sheep 459
Table VI. Ovulation records of daughters of BC ewes sired by L+ rams.
†
Genotype and probability provided by the segregation analysis on OR records over
two years.
BC dam Dam OR First three OR
of F1 × BC Daughter
per supposed genotype
Number Genotype
†
L+ Prob.
†
1st year 2nd year LL L+ ++
982054 L+ 1.00 4 4 1 3 4 6 4
982012 L+ 1.00 4 3 2 2 3 6 5 6 3 2 3
982073 L+ 0.99 2 2 4 4 2 2 11 5 5
982055 L+ 0.93 2 2 3 1 2 3 4 6 3 3 3
982059 L+ 0.92 2 1 2 3 2 2 5 3 3
982036 L+ 0.85 1 3 2 2 2 6 3 6 4 3 4
982136 L+ 0.85 2 2 2 5 4 3
982089 L+ 0.92 2 2 1 2 2 3 4 2 2
982115 L+ 0.94 2 2 2 3 3 3 2 2 2
982003 L+ 0.92 2 3 1 2 2 1 1
982167 ++ 0.01 2 2 2 1 2 2 3 3
982167 ++ 0.01 2 2 2 1 2 4 1 2
980109 ++ 0.00 1 2 2 2 2 2 4 1 2
980187 ++ 0.00 2 2 2 2 2 2 3 3 3
980270 ++ 0.00 2 2 2 2 4 2 3 2 2
980270 ++ 0.00 2 2 2 2 4 2 4 3 3
980043 ++ 0.00 1 2 2 1 2 1 1 1 2
980043 ++ 0.00 1 2 2 1 2 1 2 2 2
980080 ++ 0.00 2 2 2 1 1 2 2 2 2
980160 ++ 0.00 3 2 2 1 2 2 1 1 1
4. DISCUSSION
Natural ovulation rates observed in the hyper-prolific ewes were higher
than any value reported in the literature, and even higher than ovulation
rates recorded in prolific Romanov ewes introgressed with the FecB Booroola
gene [9].
The low response of F1 to the first synchronisation treatment was due to the
effects of age and season. In the second year, the ovulation rate was higher
and consequently variability also increased. But this increase led to a clearer
460 L. Bodin et al.
discrimination among the ewes rather than a higher residual. There was thus a
high degree of repeatability.
The lower ovulation rate of BC ewes compared to F1 ewes shows the
polygenic effects of the selection undertaken in this population since 1975
when the selection for prolificacy was initiated. The genetic progress assessed
using an animal model on the whole population under selection showed an
increase of 0.02 extra lambs per lambing each year [9].
For the three founders, we observed a heterogeneous ovulation rate within
each family. Assuming the existence of a major gene allowed us to discard two
hypotheses: that high ovulation rates are not controlled by a recessive allele,
and that the major gene is autosomal and not carried by the X chromosome
as the Inverdale gene evidenced in the Romney population by Davis et al. [6,
8] and Galloway et al. [11], or the putative imprinted Woodlands gene also
strongly suggested by Davis et al. [5].
There is a considerable difference in the mean OR among the twelve families,
and except for progeny of the sons born of Gebro Lacaune ewes and progeny
tested on Gebro Lacaune ewes, there is a clear relationship between the least
square means and the coefficient of variation. The polygenic background of
Gebro Lacaune ewes is slightly more prolific than that of the Dairy Lacaune
ewes, which merely explains the special situation of the Gebro crossed animals.
Estimated repeatability was high (r = 0.48) and agrees with the estimate
obtained in F1 ewes. This value is higher than the value of 0.20 to 0.40 for
populations where there is no evidence of segregation of a major gene [10,14,
25]. Moreover, heritability, although estimated on a very small and specific
genetic sample, is high (h
2
= 0.30) for this trait compared to values in the
literature cited by Hanrahan and Quirke [15].
Results of the segregation analyses performed on two quasi-independent
samples (F1 and BC populations) were very similar, confirming their validity.
In contrast with expectations from the breeding values estimated by a het-
eroscedastic model through daughter litter size [27], the segregation analyses
established the genotype of the three founders as heterozygous. The weak
relationship between ovulation rate and litter size explains this discrepancy and
clearly shows that mere observations of litter size obtained on farms are of little
help in detecting major genes for ovulation.
The software used for the segregation analysis did not provide a statistical
test since the distribution of the likelihood ratio is only roughly a Chi-square
distribution. Following the example of Ilahi et al. [16], an empirical test
performed on repeated simulations based on the true pedigree and perform-
ance structures yielded a distribution of the likelihood ratios under H0, and
the rejection thresholds. However, in contrast with Ilahi et al. [16], these
rejection thresholds were only slightly higher than those provided by the Chi-
2 distribution, perhaps due to the numbers and structure of the performance
Major gene for ovulation rate in Lacaune sheep 461
associated with the very simple experimental design. It could be interesting
to investigate in the future the use of MCMC techniques and Bayes factor
that could overwhelm the problem of simulations needed to obtain the test
distributions. The entire data set could also be treated this way, considering
father and grandfather path at the same time.
From the two segregation analyses, it seems that the gene effect is about
one extra ovulation at the heterozygous level. The observed heterogeneity of
the ovulation rate within F1 and BC families proves that the allele controlling
high ovulation rates is neither recessive nor dominant. We can suppose that
the effect is merely additive as for the Booroola FecB gene. The very high
repeatability of ovulation rates observed within BC × F1 ewe lambs and some
very high observations cannot be explained by mere polygenic inheritance but
is fully consistent with the segregation of a co-dominant major gene. In this
small group, we were able to classify L+ and LL ewes with the same criteria
as Davis et al. [7] used for Booroola FF ewes, and the proportions of each
genotype agreed with expectations. At this stage, the Lacaune major gene
seems to have similar effects to the Booroola gene, either at a heterozygous or
a homozygous level.
Extremely high ovulation rates (OR > 10) observed repeatedly in the small
group of hyper-prolific Lacaune ewes are not in accordance with a mere additive
effect of the gene found at a heterozygous level in “F1”and in “BC”ewes. That
leads us to suppose a more complex phenomenon: the simplest would be a
multiplicative effect of the gene at the homozygous level, but the existence of
several alleles of the same gene, or even involvement of other major genes,
cannot be discarded.
Since the polymorphism observed around the locus of the BMPR-1B gene,
responsible for the Booroola genotype, is fully independent of the ovulation
phenotypes in F1 and BC populations, it is clear that the new Lacaune major
gene is not close to the Booroola FecB locus. Complementary analyses with
a large set of DNA markers have already been undertaken. Estimates of the
allelic frequencies in the OVI-TEST Lacaune population and their effect on
the genetic background of this population will be available only when close
markers of this gene are found.
5. CONCLUSION
Evidence of a new major gene affecting ovulation has been found in the
Lacaune population, using a statistical approach. This study confirms the
previous results obtained in preliminary data of this program and presented
by Bodin et al. [3]. Before proposing decisions about its possible interest for
breeders, more research is needed to study its frequency in the population under
control, its effect on homozygous ewes and the relationship with other traits.
462 L. Bodin et al.
ACKNOWLEDGEMENTS
The authors acknowledge the financial support of the Conseil Régional
de Midi-Pyrénées, the OVI-TEST Cooperative and the staff of the Langlade
experimental farm who take care of the animals. They also thank J. Rallières
for her technical assistance.
REFERENCES
[1] Bodin L., Bibé B., Blanc M.R., Ricordeau G., Genetic correlation relationship
between prepuberal plasma FSH levels and reproductive performance in Lacaune
ewe lambs, Genet. Sel. Evol. 20 (1988) 489–498.
[2] Bodin L., Chemineau P., Premiers résultats d’un testage en ferme sur l’aptitude
au désaisonnement en race Lacaune, Mémoire de fin d’études Ensat: Inra Itovic,
1976.
[3] Bodin L., Elsen J.M., Poivey J.P., SanCristobal-Gaudy M., Belloc J.P., Eychenne
F., Hyper-prolificacy in the French Lacaune sheep breed; a possible major gene,
in: Proceedings of the 6th WCGALP, Armidale, 11–16 January 1998, University
of New England, Armidale Australia, vol. 27, pp. 11–14.
[4] Bradford G.E., Quirke J.F., Sitorus P., Inonou I., Tiesnamurti B., Bell F.L.,
Fletcher I.C., Torell D.T., Reproduction in Javanese sheep: evidence for a gene
with large effect on ovulation rate andlitter size, J. Anim. Sci. 63 (1986) 418–431.
[5] Davis G.H., Dodds K.G., Wheeler R., Jay N.P., Evidence that an imprinted gene
on the X chromosome increases ovulation rate in sheep, Biol. Reprod. 64 (2001)
216–221.
[6] Davis G.H., McEwan J.C., Fennessy P.F., Dodds K.G., Farquhar P.A., Evidence
for the presence of a major gene influencing ovulation rate on the X-chromosome
of sheep, Biol. Reprod. 44 (1991) 620–624.
[7] Davis G.H., Montgomery G.W., Allison A.J., KellyR.W., Bray M.R., Segregation
of a major geneinfluencing fecundity inprogeny of Booroola sheep, N.Z.J.Agric.
Res. 25, (1982) 525–529.
[8] Davis G.H., Shackell G.H., Kyle S.E., A putative major gene for prolificacy in
Romney sheep, in: Elsen J.M., Bodin L., Thimonier J., Inra (Eds.), Proceedings
of the 2nd International Workshop on Major Genes for Reproduction in Sheep,
Toulouse, 16–18 July 1990, pp. 61–65.
[9] Elsen J.M., Bodin L., François D., Poivey J.P., Teyssier J., Genetic improvement
of litter size in sheep, in: Proceedings of the 5th WCGALP, Guelph, University
of Guelph, Canada, 1994, vol. 19, pp. 237–244.
[10] Eythorsdottir E., Adalsteinsson S., Jonmundsson J.V., Hanrahan J.P., Research
work on the Icelandic Thoka gene, in: Elsen J.M., Bodin L., Thimonier J.,
Inra (Eds.), Proceedings of the 2nd International Workshop on Major Genes for
Reproduction in Sheep, Toulouse, 16–18 July 1990, pp. 75–84.
[11] Galloway S.M., McNatty K.P., Cambridge L.M., Laitinen M.P.E., Juengel J.L.,
Jokiranta T.S., McLaren R.J., Luiro K., Dodds K.G., Montgomery G.W., Beattie
A.E., Davis G.H., Ritvos O., Growth differentiation factor 9B mutations cause
Major gene for ovulation rate in Lacaune sheep 463
increased ovulation rate and infertility in a dosage-sensitive manner, Nat. Genet.
25 (2000) 279–283.
[12] Hanrahan J.P., Evidence for single gene effects on ovulation rate in the Cam-
bridge and Belclare breeds, in: Elsen J.M., Bodin L., Thimonier J., Inra (Eds.),
Proceedings of the 2nd InternationalWorkshop on Major Genes forReproduction
in Sheep, Toulouse, 16–18 July 1990, pp. 93–102.
[13] Hanrahan J.P., Owen J.B., Variation and repeatability of ovulation rate in Cam-
bridge ewes, Anim. Prod. 40, (1985), 529 abstr.
[14] Hanrahan J.P., Quirke J.F., Contribution of variation in ovulation rate and embryo
survival to within-breed variation in litter size, in: Land R.B., Robinson D.W.
(Eds.), Genetic of Reproduction in Sheep, Butterworths, London, 1985, pp. 193–
201.
[15] Hanrahan J.P., Quirke J.F., Breeding season and multiple births in small rumin-
ants, in: Proceedings of the 3rd WCGALP, Lincoln Nebraska, 16–22 July 1986,
vol. 11, pp. 30–45.
[16] Ilahi H., Manfredi E., Chastin P., Monod F., Elsen J.M., Le Roy P., Genetic
variability in milking speed of dairy goats, Genet. Res. Camb. 75 (2000) 315–
319.
[17] Jonmundsson J.V., Adalsteinsson S., Single gene for fecundity in Icelandic
sheep, in: Land R.B., Robinson D.W. (Eds.), Genetics of reproduction in sheep,
Butterworths, London, 1985, pp. 159–168.
[18] Le Roy P., Elsen J.M., First statistical approaches of the major gene detection
with special reference to discrete traits, in: Elsen J.M., Bodin L., Thimonier J.,
Inra (Eds.), Proceedings of the 2nd International Workshop on Major Genes for
Reproduction in Sheep, Toulouse, 16–18 July 1990, pp. 431–440.
[19] Le Roy P., Naveau J., Elsen J.M., Sellier P., Evidence for a new major gene
influencing meat quality in pigs, Genet. Res. Camb. 55 (1990) 33–40.
[20] Mulsant Ph., Lecerf F., Fabre S., Schibler L., MongetPh., LannelucI., PisseletC.,
Riquet J., Monniaux D., Callebaut I., Cribiu E., Thimonier J., Teyssier J., Bodin
L., Cognié Y., Chitour N., Elsen J.M., Mutation in bone morphogenetic protein
receptor-IB is associated with increased ovulation rate in Booroola Merino ewes,
PNAS, 98 (2001) 5104–5109.
[21] Numerical Algorithms Group, The NAG Fortran Library Manual, NAG Ltd.
Oxford, 1990.
[22] Perret G., Bodin L., Mercadier M., Scheme for genetic improvement of repro-
ductive abilities in Lacaune sheep, in: 43rd Annual meeting of the EAAP, 1992,
Madrid, Spain.
[23] Piper L.R., Bindon B.M., Genetic segregation for fecundity in Booroola Merinos
sheep, in: Barton R.A., Smith W.C. (Eds.), Proceedings of the World Congress
on Sheep and Beef Cattle Breeding, 1982, Palmerston North, N.Z., pp. 395–400.
[24] Poivey J.P., Cournut J., Jullien E., Bibé B., Perret G., Elsen J.M., Berny F.,
Bouix J., Bodin L., Estimation of meat sheep breeding values in French on farm
performance recording system, in: 41st Annual meeting of the EAAP, 1990,
Toulouse, France.
[25] Quirke J.F., Bradford G.E., Famula T.R., Torell D.T., Ovulation rate in sheep
selected for weaning weight or litter size, J. Anim. Sci. 61 (1985) 1421–1430.
464 L. Bodin et al.
[26] Radomska M.J., Martyniuk E., Klewiec J., Knothe A., Inheritance of high
prolificacy of the Olkuska sheep (preliminary results), J. Agric. Sci. 60 (1988)
597–598.
[27] SanCristobal-Gaudy M., Bodin L., Elsen J.M., Chevalet C., Genetic of litter size
variability in sheep, Genet. Sel. Evol. 33 (2001) 249–271.
[28] SanCristobal-Gaudy M., Elsen J.M., Bodin L., Chevalet C., Prediction of the
response to a selection for canalisation of a continuous trait in animal breeding,
Genet. Sel. Evol. 25 (1998) 3–30.
[29] Titterington D.M., Smith A.F.M., Makov U.E., Statistical analysis of Finite
Mixture Distribution, John Wiley, New York, 1985.
[30] Wilson T., Wu X Y., Juengel J.L., Ross I.K., Lumsden J.M., Lord E.A., Dodds
K.G., Walling G.A., McEwan J.C., O’Connell A.R., McNatty K.P., Montgomery
G.W., Highly prolific Booroola sheep hace a mutation in the intracellular kinase
domain of bone morphogenetic protein 1B receptor (ALK-6) that is expressed in
both oocytes and granulosa cells, Biol. Reprod. 64 (2001) 1225–1235.
To access this journal online:
www.edpsciences.org