Báo cáo sinh học: "Selection responses for the number of fertile eggs of the Brown Tsaiya duck (Anas platyrhynchos) after a single artificial insemination with pooled Muscovy (Cairina moschata) semen" pptx
Bạn đang xem bản rút gọn của tài liệu. Xem và tải ngay bản đầy đủ của tài liệu tại đây (108.88 KB, 15 trang )
Genet. Sel. Evol. 34 (2002) 597–611
597
© INRA, EDP Sciences, 2002
DOI: 10.1051/gse:2002025
Original article
Selection responses for the number
of fertile eggs of the Brown Tsaiya duck
(Anas platyrhynchos) after a single
artificial insemination with pooled
Musco vy (Cairina moschata) semen
Yu Shin C
HENG
a
,RogerR
OUVIER
b,c
,
Jean Paul P
OIVEY
b
, Jui Jane Liu T
AI
a
,CheinT
AI
d∗
,
Shang Chi H
UANG
a
a
Taiwan Livestock Research Institute, Council of Agriculture, Hsin-Hua,
Tainan, 71210 Taiwan, Republic of China
b
Station d’amélioration génétique des animaux,
Institut national de la recherche agronomique, Centre de recherches de Toulouse,
BP 27, 31326 Castanet-Tolosan Cedex, France
c
Department of Animal Science, National Chung-Hsing University,
Taichung 40227 Taiwan, Republic of China
d
Institute of Biotechnology, National Cheng-Kung University,
Tainan, 712 Taiwan, Republic of China
(Received 7 June 2001; accepted 6 May 2002)
Abstract – A seven-generation selection experiment comprising a selected (S) and a control
(C) line was conducted with the objective of increasing the number of fertile eggs (F) of the
Brown Tsaiya duck after a single artificial insemination (AI) with pooled Muscovy semen. Both
lines consisted of about 20 males and 60 females since parents in each generation and each
female duck was tested 3 times, at 26, 29 and 32 weeks of age. The fertile eggs were measured
by candling at day 7 of incubation. The selection criterion in the S line was the BLUP animal
model value for F. On average, 24.7% of the females and 15% of the males were selected. The
direct responses to the selection for F, and correlated responses for the number of eggs set (Ie),
the number of total dead embryos (M), the maximum duration of fertility (Dm) and the number
of hatched mule ducklings (H) were measured by studying the differences across the generations
of selection between the phenotypic value averages in the S and C lines. The predicted genetic
responses were calculated by studying the differences between the S and C lines in averaged
values of five traits of the BLUP animal model. The selection responses and the predicted
responses showed similar trends. There was no genetic change for Ie. After seven generations
∗
Correspondence and reprints
E-mail:
598 Y.S. Cheng et al.
of selection, the average selection responses per generation were 0.40, 0.33, 0.42, 0.41 genetic
standard deviation units for F, M, Dm, and H respectively. Embryo viability was not impaired
by this selection. For days 2–8 after AI, the fertility rates (F/Ie) were 89.2% and 63.8%, the
hatchability rates (H/F) were 72.5% and 70.6%, and (H/Ie) were 64.7% and 45.1% in the S and
C lines respectively. It was concluded that upward selection on the number of fertile eggs after
a single AI with pooled Muscovy semen may be effective in ducks to increase the duration of
the fertile period and the fertility and hatchability rates with AI once a week instead of twice a
week.
selection response / fertile egg / Brown Tsaiya / Muscovy / duck
1. INTRODUCTION
Mule duck production for meat (roasted duck) is traditionally important
in Taiwan. In the last ten years, it has increased tremendously in France,
where male mule ducks are force-fed to produce “foie gras” (fatty liver) and
the female can be used for meat production. The efficiency of production
depends greatly on artificial insemination (AI) to overcome the behavioral
barriers in reproduction between the two parents of the hybrid mule ducklings,
which are the Muscovy (Cairina Moschata) drake and the Common duck
(Anas Platyrhynchos) dam [14,35]. These two genera do not have the same
chromosome complement [10,21]. So, in the last few decades, it has become
common to use AI as a production technique, both in Franceand Taiwan [28,29,
32]. Unfortunately, owing to the short duration of fertility in this intergeneric
crossbreeding, AI has to be practised twice a week in order to maintain the
fertility rate [16,19,27]. It would be economically beneficial to inseminate
the female duck once a week instead of twice a week, without decreasing
the fertility rate. So our question was to study the value of selection for an
increased duration of the fertile period in order to reduce the frequency of the
required AI. Previous results in domestic fowl have shown that selection for
a longer fertile period is feasible [2,23,24]. Because of the possible negative
consequences due to the genetic correlation between the duration of the fertile
period and embryo death [2], an alternative model of selection for the duration
of the fertile period was preferred, based on the number of hatched chicks
after a single AI [3,5]. Nevertheless, the optimum selection criterion and the
selection responses to selection for an increased duration of the fertile period
could be different in the intergeneric crossbreeding of ducks from domestic
fowl and breeding within the species. On the contrary, the mean maximum
duration of the fertile period has been found to be much shorter in i ntergeneric
crossbreeding (5.5 days, [33]) than in domestic fowl breeding (12 days, quoted
in Lake [17]). It is also shorter in t he intergeneric crossbreeding compared to
pure breeding in the common duck (4.2 d. vs. 7.1 d.) [6]. So it seemed helpful to
determine a selection criterion, and to conduct a selection experiment in order
Selection responses for number of fertile eggs 599
to study what genetic progress could be achieved in increasing the duration of
the fertile period in the intergeneric crossbreeding of ducks.
Tai et al. [33] found that the best selection criterion for the duration of
fertility seems to be the number of fertile eggs laid from the 2nd to the 15th
day after a single AI with pooled Muscovy semen. So, in 1992, the Taiwan
Livestock Research Institute (TLRI), Hsinhua, Tainan [7] initiated a selection
experiment for an increased number of fertile eggs (F) (measured by candling
on the 7th day after egg set) in the Brown Tsaiya female duck after a s ingle AI
with pooled Muscovy semen,using a selected and a control (unselected) line. In
order to increase the efficiency of the selection method, the best linear unbiased
predictors (BLUP) using an animal model were preferred to the conventional
selection index, to evaluate the breeding values of the male and female ducks.
The purpose of this study was to analyze the direct and correlated responses
to selection for an increased number of fertile eggs after a single AI with pooled
Muscovy semen.
2. MATERIALS AND METHODS
2.1. Animals and experimental procedures
The number of ducks involved in each generation, the number of hatches,
the percentage of selected animals, and the selection differentials on breeding
values of F i n the C line are shown in Table I. The first hatch in G1 was on
February 16, 1992 and the last one in G8 was on June 14, 1999. One hundred
and six Brown Tsaiya females and 28 Brown Tsaiyamales of Line 105, assumed
unrelated, were used as the founder stock (G0). Line 105 was studied at TLRI,
Ilan Station, for laying traits [8,9]. For the first generation (G1), 165 females
and 117 males, progeny of the founder animals, were produced, and the data of
the females were recorded. These ducks were divided into two groups in order
to constitute the G1 of the parents of the selected line (S) and of the control
or unselected line (C). Both lines were maintained at the same time under
standardized conditions at the TLRI experimental farm in Hsinhua, Tainan.
Their management is described in Poivey et al. [26].
In the S line, male and female ducks in each generation were selected
by truncation on superior values of the BLUP animal model for the number of
fertile eggs from the 2nd to the 15th day after AI (3 replications). The model for
the prediction of additive genetic values of the selected trait was the following,
as described in Cheng [7]:
y = Xb + Z
1
a + Z
2
p + e
where
600 Y.S. Cheng et al.
Tabl e I. The experimental population for the selection on the number of fertile eggs.
Generation Line Batch of hatch Ducks Parents % of selection S.D
G0 M = 28
F = 106
G1 1 M = 117 M = 23(S) 19.7
F = 165 F = 48 29.1
M = 20(C) −0.036
F = 46
G2 S 2 M = 170 M = 20 11.8
F = 214 F = 51 23.8
C1M= 97 M = 20 −0.160
F = 151 F = 53
G3 S 1 M = 96 M = 20 20.8
F = 213 F = 58 27.2
C1M= 60 M = 20 +0.196
F = 228 F = 56
G4 S 2 M = 133 M = 20 15.0
F = 232 F = 58 25.0
C2M= 67 M = 19 −0.052
F = 135 F = 53
G5 S 1 M = 184 M = 20 10.9
F = 248 F = 50 20.2
C1M= 120 M = 20 −0.044
F = 193 F = 54
G6 S 1 M = 105 M = 20 19.0
F = 175 F = 55 31.4
C1M= 126 M = 20 +0.011
F = 173 F = 53
G7 S 2 M = 126 M = 20 16.0
F = 296 F = 61 20.6
C2M= 158 M = 20 −0.019
F = 290 F = 61
G8 S 1 M = 114
F = 204
C1M= 94
F = 157
Total S M = 1 045
F = 1 747
G1–G8 C M = 839 −0.104
F = 1 492
M: male; F: female; S: selected line; C: control line; S.D: Selection differential in
the C line.
Selection responses for number of fertile eggs 601
y = the vector of observations;
b = the vector of fixed effects of hatching date;
a = the vector of random genetic effects with E(a) = 0, Var(a) = Aσ
2
a
,where
A is the additive genetic relationship matrix of the animals, σ
2
a
= the
additive genetic (co)-variances;
p = the vector of random repeat effects with E(p) = 0, Var(p) = Iσ
2
p
,where
I is the identity matrix, σ
2
p
= the (co)-variances of repeat effects;
e = the vector of random residual effects with E(e) = 0, Var(e) = Iσ
2
e
,where
σ
2
e
= the (co)-variances of random residual effects;
X, Z
1
and Z
2
= the matrices relating the elements of b, a and p to the obser-
vations.
In each generation, all the ancestors of the selection candidates back to
the founder animals were taken into account to establish the additive genetic
relationship matrix. The performance of ducks in all generations (from G1)
was also taken into account.
The genetic parameters used were h
2
= 0.34 [33] and repeatability r = 0.47
(estimated from G1 data), for G1 up to G3. From G4 they were h
2
= 0.29
and r = 0.40 (estimated from the data of the first 3 generations, in Cheng [7]).
The predicted additive genetic values of the candidate to be selected were
computed using a program by Poivey [25] for G1 to G3, and with the PEST
program [12] thereafter. It was scheduled to select 20 males and 60 females in
each generation, in order t o mate one male with three females to produce the
offspring t o be measured in the following generation.
Theoretically, t he control line was bred from 20 sires and 60 dams (three
dams per sire). One son of each sire was randomly chosen to replace his father
and one daughter of each dam was randomly chosen to replace her mother, for
mating according to a rotational scheme [20].
Starting from the progeny of the founder stock, this selection experiment was
conducted over 8 generations from 1992 to 1999 (G1 to G8). The generations
were kept separate and the generation interval was one year. In total, from G1
to G8, 2 792 and 2 331 ducks in the S and C line respectively were recorded. In
the S line, the percentage selected was between 20.2% and 31.4% in females
and between 10.9% and 19.7% in males.
2.2. Measurements
Pedigree hatching was carried out in each generation, and an individual
recording system was used to collect the performance of each duck and to
register the pedigree (PALMI system, [1]). The ducks at 26, 29, and 32 weeks
of agewere artificially inseminated(vaginal foldseverted method) with0.05 mL
of pooled semen from 10 to 15 Muscovy drakes from line 302 of TLRI, Ilan
Station [34]. After a single AI, the eggs were collected from day 2 to 15 for G1
602 Y.S. Cheng et al.
to G6, and from day 2 to 18 for G7 and G8. They were incubated for 7 days and
9 days respectively. Fertility was estimated by candling the eggs after 7 days
of incubation, and the number of live hatched ducklings was recorded. Data
regarding the number of eggs set (Ie), the number of fertile eggs at candling
(F), the number of total dead embryos (M), the maximum duration of fertility
from the 2nd day after AI up to the day of the last fertile egg (Dm), and the
number of hatched mule ducklings (H) were analyzed.
2.3. Statistical analysis
The elementary statistical parameters (means and variances) of phenotypic
values were obtained using the SAS
®
procedure [30]. The selection differen-
tials on breeding values of F in the C line were calculated in each generation, as
differences between the averages of animals randomly chosen as parents and
of all animals measured in that generation. They were calculated in order to
detect an unintentional selection. The inbreeding coefficients were calculated
in each generation for the females and the males of each line. The cumulated
generation direct and correlated selection responses were measured as the
differences in the averages of phenotypic performance of animals in the S and
C lines. Their variances were calculated taking into account the variance of
error measurements and the genetic drift variance [11].
The predicted genetic responses to selection on F was estimated from the
within generation line difference (S-C) for average predicted breeding values
for each of the five traits in female ducks. These predicted additive genetic
values were calculated in a 5-trait analysis using BLUP methodology applied to
an individual animal model previously described for one trait. These multiple-
trait BLUP animal model values were calculated using the records of all five
traits together for t he selected and control lines from G1 to G8, using the
PEST 3.1 package [12,13], with a performance file of 7 890 records and a
pedigree file of 4 985 animals. The heritabilities, repeatabilities, genetic and
phenotypic correlations for the five traits were taken from Poivey et al. [26]
for these computations of breeding values. For simplification, the approximate
standard errors for the generation S-C differences were calculated for each trait
with the estimated parameters, considering that the predicted additive genetic
values were computed in univariate analyses [31], as in [18].
3. RESULTS
3.1. Percentage of selection
Table I shows the number of females measured and s elected as parents, the
number of males raised and selected as parents in each generation in the S
line, as well as the percentage of selected animals. In the C line, it shows
Selection responses for number of fertile eggs 603
Table II. Mean ± standard deviation of inbreeding coefficients in females of the S
and C lines.
Generation S line C line
G1 0 0
G2 0 0
G3 0.017 ± 0.024 0.0067 ± 0.017
G4 0.041 ± 0.029 0.022 ± 0.025
G5 0.053 ± 0.034 0.034 ± 0.022
G6 0.067 ± 0.024 0.040 ± 0.028
G7 0.082 ± 0.022 0.047 ± 0.027
G8 0.106 ± 0.028 0.060 ± 0.024
the number of measured females and of raised males, as well as the number
of randomly chosen parents and the realized selection differential, in each
generation. In total, from G1 up t o G8, 1 045 males, 1 747 females, and 839
males, 1 492 females, in the S and C line respectively were controlled. In
the S line, the selection was effective from G1. Over the seven generations
of selection, the average percentage of selected females was 24.7% and the
average percentage of selected males was 15%. The unintended selection
differential which occurred in the C line was very small (−0.104) over the
seven generations of selection and could be neglected. It should be pointed out
that the animals of the S and C lines were born in the same hatches in all the
generations, except in G2. In G1 some parents were used in the constitution of
both the S and C lines; in G2, the animals of the S line were born on 02/10/1993
and on 03/09/1993, while the animals of the C line were born on 04/07/1993.
Although the AIs were performed partly at the same period, this could lead to
some inaccuracy in the measurement of selection response in G2.
3.2. Inbreeding coefficients
Table II shows the mean and standard deviation of inbreeding coefficients
in females of the S and C lines, for each generation. The results for the males
were similar. The founder animals were not supposed to be related nor inbred.
So, the average inbreeding coefficient in G1 was 0. The same was found in G2,
due to the mating plan, which was rotational in the C line and which avoided
sib mating in the S line. Thereafter, it increased more quickly in the S line than
in the C line, as could be expected, but it remained moderate, the mean in G8
being 0.106 and 0.060 in the S and C line respectively.
604 Y.S. Cheng et al.
Table III. The means and phenotypic standard deviations of the traits in the control
line from G2 up to G8.
Generation G2 G3 G4 G5 G6 G7 G8
Ie 12.77 13.02 12.73 12.85 12.90 12.34 15.16
±1.90 ±1.90 ±2.33 ±2.16 ±2.22 ±2.64 ±2.96
F 3.67 4.56 4.37 4.19 4.30 3.18 4.39
±1.78 ±1.81 ±1.82 ±1.78 ±1.77 ±1.63 ±1.77
M 1.16 1.00 1.06 0.80 1.11 0.85 1.29
±1.11 ±1.09 ±1.23 ±0.93 ±1.08 ±0.93 ±1.16
Dm 4.90 5.63 5.63 5.36 5.48 4.38 5.59
±2.01 ±2.13 ±2.15 ±2.12 ±2.02 ±1.98 ±2.12
H 2.51 3.56 3.30 3.39 3.18 2.33 3.10
±1.62 ±1.76 ±1.78 ±1.82 ±1.67 ±1.54 ±1.80
Ie = number of eggs set; F = number of fertile eggs at candling (7th day of
incubation); M = number of total dead embryos; Dm = maximum duration of
fertility; H = number of hatched mule ducklings.
3.3. Selection responses and predicted genetic responses
Table III shows the means and phenotypic standard deviations of the traits in
the control line from G2 up to G8. Table IV shows the mean selection responses
(and standard deviations) and predicted genetic responses (and standard errors)
across the seven generations of selection, for the Ie, F, M, Dm, and H traits.
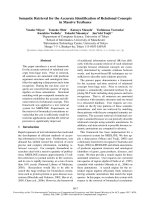
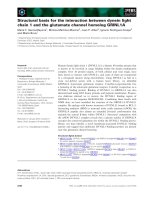
Figure 1 shows the trends of selectionresponses andgenetic predicted responses
of F, M, H, and Dm. Both were similar, except that the former showed more
fluctuations between the generations. The selection responses were highly
significant for the selected trait and the correlated ones, except Ie. Selection
responses became highly significant at G4 for F, Dm and H, but at G7 for M. At
G8, the mean selection response and the mean predicted genetic response were
very similar, being 2.61 and 2.52 respectively for F, 0.60 and 0.53 for M, 2.87
and 2.91 for Dm, 2.02 and 1.82 for H. These genetic increases were represented
as a percentage of the average traits in G1: 61.7% for F, 32.6% for M, 51%
for Dm, and 84.5% for H.
Table V shows the mean (and standard deviation) of fertility and hatchability
rates for days 2–15 or days 2–8 after a single AI for the S and C lines in G8.
The S and C lines were significantly different for the F/Ie, H/Ie frequencies for
days 2–15 and 2–8 after AI. The hatchability rate calculated as the H/F ratio
was significantly higher in the S line than in the C line for days 2–15 after AI,
and it was also higher but statistically the same for days 2–8 after AI.
Selection responses for number of fertile eggs 605
Tabl e IV. Mean of the traits in G1, selection response mean ± standard deviation (1st line), mean of predicted genetic responses
± standard errors (2nd line) for the five traits.
Generation G1 G2 G3 G4 G5 G6 G7 G8
Trait
1
Mean
Ie 11.83 0.70 ± 0.16 0.20 ± 0.20 0.20 ± 0.26 0.22 ± 0.28 0.17 ± 0.31 0.22 ± 0.33 0.36 ± 0.47
0.10 ± 0.001 0.17 ± 0.010 0.18 ± 0.030 0.23 ± 0.050 0.28 ± 0.070 0.37 ± 0.090 0.51 ± 0.110
F4.230.94 ± 0.21 0.50 ± 0.27 1.08 ± 0.32 1.40 ± 0.36 1.22 ± 0.41 1.91 ± 0.43 2.61 ± 0.50
0.16 ± 0.010 0.56 ± 0.030 0.98 ± 0.050 1.30 ± 0.100 1.55 ± 0.140 1.99 ± 0.180 2.52 ± 0.210
M1.840.04 ± 0.08 0.15 ± 0.09 0.15 ± 0.11 0.32 ± 0.11 0.40 ± 0.14 0.79 ± 0.13 0.60 ± 0.15
0.04 ± 0.001 0.16 ± 0.002 0.25 ± 0.003 0.27 ± 0.007 0.34 ± 0.009 0.48 ± 0.012 0.53 ± 0.013
Dm 5.63 0.53 ± 0.22 0.51 ± 0.28 1.16 ± 0.34 1 .56 ± 0.38 1.50 ± 0.43 2.10 ± 0.45 2.87 ± 0.50
0.17 ± 0.010 0.67 ± 0.030 1.19 ± 0.060 1.52 ± 0.110 1.87 ± 0.150 2.40 ± 0.190 2.91 ± 0.220
H2.390.90 ± 0.17 0.35 ± 0.21 0.94 ± 0.25 1.08 ± 0.28 0.83 ± 0.31 1.12 ± 0.33 2.02 ± 0.36
0.12 ± 0.005 0.37 ± 0.010 0.67 ± 0.030 0.97 ± 0.050 1.15 ± 0.070 1.38 ± 0.100 1.82 ± 0.110
1
Ie = number of eggs set; F = number of fertile eggs at candling (7th day of incubation); M = number of total dead embryos;
Dm = maximum duration of fertility; H = number of hatched mule ducklings.
606 Y.S. Cheng et al.
0
0.3
0.6
0.9
1.2
1.5
1.8
2.1
2.4
2.7
3
G1 G2 G3 G4 G5 G6 G7 G8 G9
generation
(a)
number of fertile eggs (eggs)
S-C(P)
S-C(G)
0
0.3
0.6
0.9
1.2
1.5
1.8
2.1
2.4
2.7
3
G1 G2 G3 G4 G5 G6 G7 G8 G9
generation
(b)
number of total dead embryos
(eggs)
S-C(P)
S-C(G)
0
0.3
0.6
0.9
1.2
1.5
1.8
2.1
2.4
2.7
3
G1 G2 G3 G4 G5 G6 G7 G8 G9
generation
(
c)
number of hatched mule
ducklings
S-C(P)
S-C(G)
0
0.3
0.6
0.9
1.2
1.5
1.8
2.1
2.4
2.7
3
G1 G2 G3 G4 G5 G6 G7 G8 G
9
generation
(d)
maximum duration of fertility
(days)
S-C(P)
S-C(G)
Figure 1. Differences in number of fertile eggs at candling (a), number of total dead
embryos (b), number of hatched mule ducklings (c), maximum duration of fertility (d)
between selected (S) and control (C) lines for the phenotypic [S-C(P)] and predicted
genetic [S-C(G)] values across seven generations of selection.
Tabl e V. Mean ± standard deviation of fertility and hatchability rates for days 2–15
or days 2–8 after a single AI for S and C lines in G8.
Days 2–15 after AI Days 2–8 after AI
Line Fertility rate Hatchability rates Fertility rate Hatchability rates
F/Ie% H/Ie% H/F% F/Ie% H/Ie% H/F%
S 54.40
a
39.74
a
73.04
a
89.18
a
64.67
a
72.52
a
±0.58 ±0.57 ±0.70 ±0.51 ±0.79 ±0.78
C 34.39
b
24.28
b
70.60
b
63.79
b
45.06
b
70.64
a
±0.63 ±0.56 ±1.02 ±0.88 ±0.91 ±1.04
Ie = number of eggs set; F = number of fertile eggs at candling (7th dayof incubation);
H = number of hatched mule ducklings.
Two different subscripts (a,b) in a column indicate significant differences (P < 0.05).
Selection responses for number of fertile eggs 607
4. DISCUSSION
The length of the fertile period in birds depends on the sperm storage in
the tubules at the utero-vaginal junction where the spermatozoa are released
to be transported upwards towards the infundibulum for ova fertilization [4].
The purpose of this selection experiment was to show to what extent genetic
progress could extend the fertile period of the Brown Tsaiya duck, and not to
estimate the realized heritability of the selected trait. The selection was thus
made with the BLUP of breeding values using an animal model. It is known that
mixed model methodology has desirable properties, under certain conditions,
when a selection model is involved, to adjust without bias for fixed effects, and
to provide best linear unbiased predictors of random effects of the model [15].
Moreover, we expected that the accuracy of the prediction of breeding values
could be improved by comparison with the conventional combined selection
index. Although the economic target was to increase the number of mule
ducklings born after a single AI, we decided t o select for an increased F and
to study the direct and correlated responses to that selection. Tai et al. [33]
found a heritability value of 0.29, estimated from the sire variance component
in 348 Brown Tsaiya female ducks for that t rait. So it was expected to respond
to selection. A control line is useful to adjust for environmental trends, under
the assumption of no genotype by environment interaction, when measuring
the selection response. The selection responses were calculated, as usual, by
taking the differences across the generations of selection between the average
phenotypic values of the S and C lines [11,22]. Sorensen and Kennedy [31]
have shown that an alternative way of estimating response to selection is t o use
the mixed model approach, since the phenotypic trend can be partitioned into
its genetic and environmental trend.
The r esults indicated that themeasured selection responsesand the calculated
predicted genetic responses were similar. This could indicate the adequacy
of the data representation model and the accuracy of the genetic parameter
estimates in the base population. The genetic progress in F measured by the
selection response was significant, being 2.77 genetic standard deviation or
39.6% of genetic standard deviation per generation. The correlated responses
in Dm and H were also significant, being 2.93 and 2.88 genetic standard
deviation respectively. The increase in M was smaller (2.33 genetic standard
deviation) and the total embryo mortality rate was not increased by selection.
These results are in contrast with those of chicken hens where the duration of
the fertile period was correlated with an increased early embryo mortality [2].
They are consistent with the estimated genetic parameters showing high genetic
correlations between F and Dm (0.92), H (0.91) and between Dm and H (0.82).
According to these results and the fact that the heritability of F is greater than
that of H (0.26 versus 0.19), the selection on F might be more effective in
increasing H than the direct selection on that trait.
608 Y.S. Cheng et al.
5. CONCLUSION
Selection was effective in increasing the number of ova that could be fer-
tilized after a single AI with pooled Muscovy semen, and consequently the
number of eggs able to develop a viable embryo. Such changes had major
consequences in increasing the maximum duration of the fertile period, and the
physiological effects need to be investigated. Correlatively, selection increased
the fertility and hatchability rates according to the eggs set, especially for days
2–8 after AI, showing that selection for one AI per week was possible in this
strain of laying ducks. There was not, as was thought in the fowl, an increased
rate of embryonic death that could have impaired the benefits of selection.
Thus, in the intergeneric crossbreeding of ducks, ova fertilization seems to be
a key point. Nevertheless, the total mortality rate in relation to the number
of fertile eggs was high (27 to 30%). So it would be useful to continue the
selection experiment in order to the study long term effects on fertility and
embryo viability. The present results might depend on the strain used (Brown
Tsaiya), which is a laying duck. Nonetheless, they open the way to selecting
for an extension of the fertile period in meat-type ducks such as the Pekin duck,
since this breed is being used effectively as parents for commercial mule ducks.
Within species selection was based on a hybrid performance and the number
of fertile hybrid eggs was analyzed as a trait of the Brown Tsaiya duck. One
might then ask if the response obtained here was not similar in nature from
what we would have obtained as a correlated hybrid response from selecting
simply within the Tsaiya breed for an increased number of fertile eggs after a
single AI. Doing AI with pooled semen from Muscovy male would insure that
variations due to the genetic interaction with Muscovy and additive genetic
variation between Muscovy were kept at a minimum. This hypothesis seemed
to be confirmed because observed selection response was in good agreement
with the one expected from BLUP under an animal model. Yet, since the mean
maximum duration of fertility was lower in the intergeneric crossbreeding than
in the pure breeding lines, some mechanism involved in the fertilization process
might be different, which remains to be clarified.
ACKNOWLEDGEMENTS
This study was undertaken in 1992 and carried out as a cooperative research
program between the Council of Agriculture, Taiwan Livestock Research
Institute (COA-TLRI) and the Institut national de la recherche agronomique,
Station d’amélioration génétique des animaux du Département de génétique
animale (Inra-SAGA). We would like to thank all the staff at TLRI (especially
Hsin-Hua Station of TLRI) and Inra-SAGA for their help in carrying out this
research, and also the National Science Council (NSC81-0409-B-061-504;
Selection responses for number of fertile eggs 609
NSC82-0409-B-061-016; NSC84-2321-B-061-004; NSC85-2321-B-061-002;
NSC86-2321-B-061-005) and COA-TLRI for their financial support. Thanks
are due to Dr. Catherine Larzul (SAGA) for getting the standard errors of the
predicted genetic responses.
REFERENCES
[1] Batut M.C., Logiciel de gestion des palmipèdes, Station d’amélioration génétique
des animaux, Inra, France, 1996.
[2] Beaumont C., Genetic parameters of the duration of fertility in hens, Can. J.
Anim. Sci. 72 (1992) 193–201.
[3] Beaumont C., Brillard J.P., Millet N., Reviers M.De., Comparison of various
characteristics of duration of fertility in hens, Br. Poult. Sci. 33 (1992) 649–661.
[4] Brillard J.P., Sperm storage and transport following natural mating and artificial
insemination, Poult. Sci. 72 (1993) 923–928.
[5] Brillard J.P., Beaumont C., Scheller M.F., Physiological responses of hens diver-
gently selected on the number of chicks obtained from a single insemination, J.
Reprod. Fertil. 114 (1998) 111–117.
[6] Brun J.M., Sellier N., Brillard J.P., Garreau H., Batellier F., Rouvier R., Para-
mètres génétique de la durée de la fertilité de canes INRA 44 inséminées en
souche pure ou en croisement intergénérique, in: 4
es
Journées de la recherche
sur les palmipèdes à foie gras, 4–5 octobre, Arcachon, France, 2000, pp. 21–24.
[7] Cheng Y.S., Sélection de la race Tsaiya Brune sur la ponte et la durée de la fertilité
en croisement avec le canard de Barbarie, Thèse, Institut national polytechnique
de Toulouse, France, 1995.
[8] Cheng Y.S., Rouvier R., Poivey J.P., Tai C., Genetic parameters of body weight,
egg production and shell quality traits in the Brown Tsaiya laying ducks, Genet.
Sel. Evol. 27 (1995) 459–472.
[9] Cheng Y.S., Poivey J.P., Rouvier R., Tai C., Prediction of genetic gains in body
weight, egg production and shell quality traits in the Brown Tsaiya laying duck
(Anas platyrhynchos), Genet. Sel. Evol. 28 (1996) 443–455.
[10] Denjean B., Ducos A., Darré A., Pinton A., Seguela A., Berland H., Blanc
M.F, Fillon V., Darré R., Caryotype des canards communs (Anas platyrhynchos),
Barbarie (Cairina moschata) et de leur hybride, Rev. Méd. Vét.148 (1997) 695–
704.
[11] Falconer D.S., Mackay T.F.C., Introduction to quantitative genetics, Fourth ed.,
Longman Group Ltd, England, 1996.
[12] Groeneveld E., PEST User’s manual, Department of Animal Sciences, University
of Illinois, Urbana, IL, 1990.
[13] Groeneveld E., Kovac M., A generalized computing procedure for setting up and
solving mixed linear models, J. Dairy Sci. 73 (1990) 513–531.
[14] Gvaryahu G., Robinzon B., Meltzer A., Perek M., Snapir N., Artificial insemina-
tion and natural mating in the crossbreeding of the Muscovy drake and the Pekin
duck, Poult. Sci. 63 (1984) 386–387.
[15] Henderson C.R., Best linear unbiased estimation and prediction under a selection
model, Biometrics 31 (1975) 423–447.
610 Y.S. Cheng et al.
[16] Huang H.H., Chow T.C., Artificial insemination in mule duck production, in:
Proceedings XV World Poultry Congress, New Orleans, 13 August, Louisiana,
1974, pp. 261–262.
[17] Lake P.E., Gamete production and the fertile period with particular reference to
domesticated birds, in: Symposium of the Zoological Society, London, 1975,
vol.35, pp. 225–244.
[18] Le Roy P., Larzul C., Gogué J., Talmant A., Monin G., Sellier P., Selection for
reduced muscle glycolytic potential in Large White pigs. I. Direct responses,
Genet. Sel. Evol. 30 (1998) 469–480.
[19] Liu J.J., Tai C., Huang H.H., Studies on artificial insemination of ducks. II. Effects
of sperm number and sperm concentration on fertility, J. Chin. Soc. Anim. Sci. 9
(1980) 71–77.
[20] Matheron G., Chevalet C., Conduite d’une population témoinde lapins. Évolution
à court terme du coefficient de consanguinité selon le schéma d’accouplement,
Ann. Génét. Sél. Anim. 9 (1977) 1–13.
[21] Mott C.L., Lockhart L.H., Rigdon R.H., Chromosomes of sterile hybrid duck,
Cytogenetics 7 (1968) 403–412.
[22] Nicholas F.W., Size of population required for artificial selection, Genet. Res.
Camb. 35 (1980) 85–105.
[23] Pingel H., Genetics of egg production and reproduction in waterfowl, in: Craw-
ford R.D. (Ed.), Poultry Breeding and Genetics, Elsevier, Amsterdam, 1990,
pp. 771–780.
[24] Pingel H., Planert C.H., Untersuchung uber die moglichkeiten der verlangerung
der befruchtungspersistenz, in: Proceedings 16th World’s Poultry Congress, Rio
de Janeiro, 1987, pp. 116–125.
[25] Poivey J.P., Méthode simplifiée de calcul des valeurs génétiques des femelles
tenant compte de toutes les parentés, Genet. Sel. Evol. 18 (1986) 321–332.
[26] Poivey J.P., Cheng Y.S., Rouvier R., Tai C., Wang C.T., Liu H.L., Genetic
parameters of reproductive traits in Brown Tsaiya ducks artificially inseminated
with semen from Muscovy drakes, Poult. Sci. 80 (2001) 703–709.
[27] Rouvier R., Tai L.J.J., Tai C., L’insémination artificielle des canes communes
pour la production de mulards à Taïwan. La situation actuelle, in: Insémination
artificielle et amélioration génétique : bilan et perspectives critiques, Toulouse-
Auzeville, France, 22–24 novembre, Les Colloques de l’Inra, No. 29, 1984,
pp. 360–367.
[28] Rouvier R., Babilé R., Salzmann F., Auvergne A., Poujardieu B., Répétabilité
de la fertilité des canes Rouen et Pékin (Anas platyrhynchos) en croisement
interspécifique avec le Barbarie (Cairina moschata) par insémination artificielle,
Genet. Sel. Evol. 19 (1987) 103–112.
[29] Rouvier R., Mialon M.M., Salzmann F., Poujardieu B., Fertilité et éclosabil-
ité des œufs d’une souche de cane Pékin (Anas platyrhynchos) en croisement
interspécifique avec le Barbarie (Cairina moschata) par insémination artificielle,
Ann. Zootech. 37 (1988) 73–86.
[30] Statistical Analysis System Institute, User’s guide: Statistics, Release 6.03,
SAS
®
Institute Inc. Cary. NC, 1988.
[31] Sorensen D.A., Kennedy B.W., Analysis of selection experiments using mixed
model methodology, J. Anim. Sci. 63 (1986) 245–258.
Selection responses for number of fertile eggs 611
[32] Tai C., Duck breeding and artificial insemination in Taiwan, in: Farrell D.J.,
Stapleton P. (Eds.), Duck Production Science and World Practice, University of
New England, Armidale, 1985, pp. 193–203.
[33] Tai C., Rouvier R., Poivey J.P., Heritabilities for duration of fertility traits in
Brown Tsaiya female duck (Anas platyrhynchos) by artificial insemination with
pooled Muscovy (Cairina moschata) semen, Br. Poult. Sci. 35 (1994) 377–384.
[34] Tai L.J.J., Tai C., Mule duck production in Taiwan. I. Artificial insemination of
ducks, Food & Fertilizer Technology Center, extension Bulletin No. 328, 1991,
pp. 1–6.
[35] Watanabe M., Experimental studies on the artificial insemination of domestic
ducks with special reference to the production of mule ducks, J. Fac. Fish. Anim.
Husb. Hiroshima Univ. 3 (1961) 439–478.
To access this journal online:
www.edpsciences.org