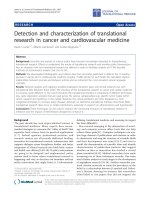
Báo cáo sinh học: " Detection of genes influencing economic traits in three French dairy cattle breeds" potx
Bạn đang xem bản rút gọn của tài liệu. Xem và tải ngay bản đầy đủ của tài liệu tại đây (503.3 KB, 25 trang )
Genet. Sel. Evol. 35 (2003) 77–101 77
© INRA, EDP Sciences, 2003
DOI: 10.1051/gse:2002037
Original article
Detection of genes influencing economic
traits in three French dairy cattle breeds
Didier B
OICHARD
a∗
, Cécile G
ROHS
b
,
Florence B
OURGEOIS
c
, Frédérique C
ERQUEIRA
c
,
Rémi F
AUGERAS
c
, André N
EAU
d
, Rachel R
UPP
a
, Yves A
MIGUES
c
,
Marie Yvonne B
OSCHER
c
, Hubert L
EVÉZIEL
b
a
Station de génétique quantitative et appliquée,
Institut national de la recherche agronomique, 78352 Jouy-en-Josas Cedex, France
b
Laboratoire de génétique biochimique et de cytogénétique,
Institut national de la recherche agronomique, 78352 Jouy-en-Josas Cedex, France
c
GIE Labogena, 78352 Jouy-en-Josas Cedex, France
d
Département de génétique animale, Institut national de la recherche agronomique,
78352 Jouy-en-Josas Cedex, France
(Received 25 February 2002; accepted 20 September 2002)
Abstract – A project of QTL detection was carried out in the French Holstein, Normande,
and Montbéliarde dairy cattle breeds. This granddaughter design included 1 548 artificial
insemination bulls distributed in 14 sire families and evaluated after a progeny-test for 24 traits
(production, milk composition, persistency, type, fertility, mastitis resistance, and milking ease).
These bulls were also genotyped for 169 genetic markers, mostly microsatellites. The QTL were
analysed by within-sire linear regression of daughter yield deviations or deregressed proofs on
the probability that the son receives one or the other paternal QTL allele, given the marker
information. QTL were detected for all traits, including those with a low heritability. One
hundred and twenty QTL with a chromosome-wise significance lower than 3% were tabulated.
This threshold corresponded to a 15% false discovery rate. Amongst them, 32 were genome-
wise significant. Estimates of their contribution to genetic variance ranged from 6 to 40%. Most
substitution effects ranged from 0.6 to 1.0 genetic standard deviation. For a given QTL, only 1
to 5 families out of 14 were informative. The confidence intervals of the QTL locations were
large and always greater than 20 cM. This experiment confirmed several already published QTL
but most of them were original, particularly for non-production traits.
dairy cattle / QTL detection / genetic marker / granddaughter design
∗
Correspondence and reprints
E-mail:
78 D. Boichard et al.
1. INTRODUCTION
Livestock species have been selected for a long time with the aim of
improving traits of economic interest. These traits usually have a complex
determinism, affected by an unknown number of genes and by environmental
factors. The selection strategy has been based on the prediction of the overall
genetic merit of the individuals from the phenotypic and pedigree information
with appropriate statistical tools. This selection has been shown to be very
efficient, although it is based on the wrong biological model and most genes
involved are still unknown.
In the last decade, however, advances in molecular genetics have made it
possible to dissect the genetic variability of complex traits into quantitative
trait loci. A QTL is defined as a chromosomal segment with a Mendelian
transmission pattern and with an effect on the trait of interest. QTL detection is
the first step towards the identification of the genes involved and of the causal
mutations. Moreover, even if the genes involved are still unknown, individual
QTL information could enhance selection efficiency and is known to be par-
ticularly beneficial when the trait is difficult or expensive to measure, when
each individual performance brings little information, or, more generally, when
the polygenic approach has a limited efficiency or a high cost. It is believed
that marker-assisted selection (MAS) could be particularly profitable in dairy
cattle. Indeed, this species concentrates many conditions unfavourable to
phenotypic selection and, therefore, favourable to MAS: most traits of interest
are sex-limited; the generation interval is long; artificial insemination bulls
should be progeny tested before extensive use, which is a long and costly step;
the breeding schemes are more and more designed with bull dams selected
before their first lactation on pedigree information only, in order to reduce
the generation interval; last but not least, functional traits, such as disease
resistance or fertility, have a low heritability but are more and more important
in the breeding goal. Since AI is predominant, the number of key animals in
the breeding scheme is limited and makes MAS relatively easy to implement.
Although MAS could be oriented towards increasing the genetic trend on the
current objective or modifying the breeding objective by efficiently including
low heritability traits, the breeders most likely will use it to decrease the cost
of the breeding programme by reducing the number of bulls sampled.
Before implementing MAS, accurate information is required on the QTL
responsible for the major part of the genetic variability of the important traits.
In dairy cattle, the population structure can be used to implement the so-called
granddaughter design [11,32]. After the pioneering work of Georges et al. [12],
several large projects have been carried out all over the world. In this paper,
we present the results of a large QTL detection experiment carried out in the
French dairy cattle AI populations.
QTL detection in dairy cattle 79
2. MATERIALS AND METHODS
2.1. Material
The QTL experiment was a typical granddaughter design [32] including three
generations: bull sires, artificial insemination (AI) sons, and granddaughters.
Only males of generations 1 and 2 were genotyped for genetic markers, whereas
the granddaughters were recorded for phenotypic traits and were used to predict
the genetic merit of their sire. The advantages of such a design are: (1) its
cost limited to the genotyping work because the population structure and the
phenotypic data already exist for selection purposes; (2) its high detection
power, due to the definition of the trait, similar to a mean and, therefore, with
a small residual variance; and (3) its relative ease of implementation because
DNA could be extracted from semen which is readily available.
In the present study, the design included 1 554 AI bulls distributed in 14
half-sib families (9 in Holstein, 3 in Normande, and 2 in Montbéliarde breeds).
Family size averaged 111 sons per sire and ranged from 59 to 232. Large
families were chosen to ensure a high detection power. The sons were born
from 1988 to 1992. The DNA was obtained from the semen bank maintained
at Inra with the help of the French AI coops. AI bulls were progeny tested
with 85 daughters on average. Phenotypic traits were those routinely collected
and evaluated for selection purposes. They included production (milk, fat,
and protein yields), milk content (fat and protein percentage), protein yield
persistency (100–200 day yield over 100-day yield ratio), mastitis resistance
(milk somatic cell score), milking speed (subjective appraisal given by the
farmers), female post partum fertility (success/failure of each insemination of
the daughters), udder morphology (udder cleft, udder depth, udder balance,
implantation, teat placement front, teat distance side view, teat length, rear
udder attachment), rump (length, width, angle), stature (height at sacrum,
chest depth), and feet and leg characteristics (rear leg set, heel depth). More
details about the definition of the traits and characteristics of the corresponding
genetic evaluations can be found in [17,18].
2.2. Methods
The genetic markers were mostly microsatellites selected on the basis
of their informativity (at least 8 sires out of 14 should be heterozygous),
their location on the genome, and their technical quality. Three hundred
microsatellites were tested and 157 were selected, assembled in 17 sets, and
genotyped with a 377 ABI
®
sequencer. For PCR amplification, the number
of markers amplified in the same PCR multiplex ranged from 1 to 8 and
reached 5 on average. All technical information relative to the markers
(number of alleles and frequencies, informativity, genetic map) and to the
80 D. Boichard et al.
design of sets (multiplex PCR conditions) are available at the following web
site: All 1 568 males (14 sires and
1 554 sons) were typed for the 157 markers, even when the sire was homo-
zygous for a marker. The genotypes were obtained through two independent
softwares, Genotyper
®
(P.E. Biosystems, ABI Prism
TM
) and Gemma [16]. In
case of missing or doubtful results after a first run, the samples were reloaded
and completely analysed a second time. A total of 242 223 genotypes were
obtained, i.e. 240 025 from the progeny and 2 198 from the sires. Eleven
blood group markers were also included. Since they were used for parentage
testing, this information was available for most AI bulls from the Labogena
data base. Because their determinism is dominant, the interpreted genotypes
were used, instead of the raw phenotypes, in order to analyse the codominant
markers only. Similarly, the Blad gene was informative in three families and
was also included. Additional blood groups (15 715) and Blad genotypes
were used, yielding to a total of 257 938 genotypes for the 169 markers. The
markers covered the 29 autosomes and their complete list is presented in Table I.
Because all genotyped progeny were males, they all received the chromosome Y
from their sire, and we neglected the pseudo-autosomal region. The number of
markers per chromosome ranged from 3 to 10.
QTL detection was carried out in two steps [10]: (a) For each chromosome,
the probability of each possible phase of the sires was estimated from progeny
marker information, the most likely phase was retained, and the probability that
each progeny received one or the other chromosomal segment was estimated
at every position, given this phase; and (b) QTL detection sensu stricto was
carried out by within-sire linear regression [20]. All positions were tested with
a 1 cM step. The model was the following:
y
ij
= s
i
+ (2p
ij
− 1)a
i
+ e
ij
.
The dependent variable y
ij
was twice the so-called daughter yield deviation
(DYD, [29]), i.e. the average performance of the n
ij
daughters of son j of sire i,
adjusted for the environmental effects and genetic merit of the dam. In practice,
DYD were obtained from the French genetic evaluation system. For type and
fertility, the DYD was estimated by proof de-regression. For each location x
on the genome, s
i
was the effect of sire i, a
i
was half the substitution effect of
the putative QTL carried by the sire, and p
ij
was the probability of inheriting
one arbitrarily defined QTL allele from sire i for son j, given the marker
information. Finally, e
ij
was the residual, assumed to be normally distributed
with a zero expectation and a heterogeneous variance approximately equal
to σ
2
e
i
/CD
ij
[33], where CD
ij
is the reliability of the proof based on progeny
information only. The residual variance was defined within-sire family to
improve detection robustness [13] and also to simultaneously analyse the traits
expressed in different breeds and, possibly, on different scales. In this approach,
QTL detection in dairy cattle 81
all parameters (sire and QTL effects, variances) were defined within-family, and
the overall likelihood ratio test was simply the sum of the family contributions.
Alternatively, the QTL effect was also considered as a random effect assumed
to be normally distributed. We used the method proposed by Goffinet et al. [13].
The parameters to estimate were the fixed sire effect, the QTL variance σ
2
q
and
the overall residual variance σ
2
e
. Because the sire effect was assumed to be
fixed, the sum of the QTL and residual variances (σ
2
e
+ σ
2
q
) represented 0.75
total genetic variance. On the contrary, σ
2
q
represented the variance of paternal
QTL Mendelian sampling, i.e. only a quarter of the variance due to the QTL in
the population. Therefore the part of the genetic variance due to the QTL in the
whole population was estimated by 4σ
2
q
/[(σ
2
e
+σ
2
q
)/0.75], i.e. by 3σ
2
q
/(σ
2
e
+σ
2
q
).
Because of the multiplicity of the correlated tests along the chromosome, the
theoretical distribution of the maximum likelihood test under H0 was unknown
and rejection thresholds were estimated by within-family permutations [7],
separately for each trait and each chromosome. Ten thousand permutations
were computed for each trait by chromosome combination and, for each
permutation, the highest likelihood ratio test value over the chromosome was
retained. This empirical distribution of tests under H0 was used to define the
critical thresholds. When the first estimate of the probability of no QTL for a
given trait by chromosome combination was below 0.5%, the critical thresholds
were re-estimated from 100 000 permutations. Because of the large number
of traits analysed (24 traits, corresponding to about 15 independent traits),
accounting for the number of traits in the definition of critical thresholds is
believed to be meaningless and would result in the following paradox that less
QTL are found when more traits are analysed. We consider that it is preferable
to control the false discovery rate of QTL [33]. The results are presented
according to three levels of significance: (a) a genome-wise significance of
10%, corresponding to a nominal significance of 0.34% and 29 chromosomes
analysed (this corresponded to about 0.1 false positive expected per trait,
and about 2 false positive expected for all traits); (b) a chromosome-wise
significance of 1%, corresponding to about 7 false positive results expected
out of the 24 × 29 = 696 analyses performed; and (c) a chromosome-wise
significance of 3%, chosen according to the distribution of P-values and the
trend in a false discovery rate.
The number of informative families, i.e. with a sire heterozygous for a
detected QTL, was estimated as follows. Assuming that the QTL exists and
given its location, there is only one remaining parameter per family, the within-
sire QTL effect. The sire was considered to be heterozygous at the P level if
the family contribution to the overall likelihood ratio test exceeded the value
of a χ
2
distribution with one degree of freedom and probability P.
The confidence intervals of the QTL location were estimated by lod drop-off
and by bootstrap [31]. In the first approach, the 5% confidence interval was
82 D. Boichard et al.
defined as the interval bounded by the two locations whose likelihood was equal
to the maximum likelihood minus 3.84 (= χ
2
(1,0.05)
). In the second approach,
the empirical sampling distribution of the location was estimated by repeatedly
analysing a data set of the same size, randomly sampled within-family in the
original data set. Because the distribution of the location of the maximum
likelihood under H0 was not uniformly distributed over the chromosome but
presented accumulations at the marker location, bootstrap location results were
weighed by the inverse of the location frequencies observed under H0 [4],
leading to smaller confidence intervals. These location frequencies under H0
were obtained with the permutation results.
A 2-QTL analysis was also carried out by regression, in order to test for the
presence of two linked QTL on the same chromosome. A two-dimensional
search was performed where all combinations of the positions of the two QTL
were evaluated, and the combination with the highest likelihood was retained.
These two locations were also analysed with the one-QTL model. The one-
QTL hypothesis was rejected if the two-QTL model was significantly better
than both one-QTL models.
3. RESULTS
3.1. Characteristics of the markers and the genetic map
Because of their selection, microsatellites were highly informative, as shown
in Table I. Over the 169 loci, the sire heterozygosity reached 68% on average
and ranged from 63.9 to 73.4% according to the sires. It was higher for the
microsatellites (70%) than for the 12 other loci (48%). Six progeny were found
to be incompatible with their sires. After the first three marker sets, they were
found to be incompatible with at least 7 markers out of 24. These progeny were
not genotyped for the other markers and were simply disregarded in subsequent
analyses, without attempting to determine whether this was due to wrong
pedigree information, a mistake in semen processing, or a manipulation error in
DNA preparation. After excluding these data, 239 845 microsatellite genotypes
of 1 548 progeny were obtained, corresponding to a readability of 98.5%. After
checking, 318 additional genotypes were found to be incompatible, out of
them 154 were concentrated on six markers: CSSM026 (91), IDVGA71 (27),
INRA081 (14), CSSM018 (12), and BM741 (10). Out of the 1 548 progeny,
1 284, 233, 21, 4, 3, and 3 showed 0, 1, 2, 3, 4, and 6–8 incompatibilities. These
individual genotypes were deleted from further analysis. Out of the 239 527
progeny microsatellite compatible genotypes, 157 876 (66%) were different
from those of the sire and were fully informative.
A specific genetic map was built. The chromosome assignation was in
agreement with the published maps [3,19], as well as the marker order, but
QTL detection in dairy cattle 83
Table I. Characteristics of the 157 microsatellites.
Mean Standard deviation
Nr genotypes / marker 1 526 20
Nr heterozygous sires (out of 14) 9.9 2.1
Nr informative meioses 1 007 188
Nr Alleles in the dam population 9.0 3.2
PIC
(1)
in the dam population 0.635 0.134
(1)
PIC = polymorphism information content.
0,3
0,4
0,5
0,6
0,7
0,8
0,9
1 ,0
C h r o m o s o m e s
Informativity
1 73 5 9 11 14 16 19 2 2 2 92 5
1.0
0.9
0.8
0.7
0.6
0.5
0.4
0.3
Figure 1. Information content of the markers used, measured by the mean |1 − 2p
ij
|,
over the whole genome. The limits between chromosomes are reported by vertical
lines.
genetic distances were often quite different (Tab. II). Two genes, the locations
of which were unknown when the project started, were mapped with this
design. The CD18 gene, responsible for the Blad syndrome, was mapped on
chromosome 1, between UWCA46 (12 cM Haldane) and BMS2263 (21 cM).
The EAF blood group was mapped on chromosome 17, between BMS499
(25 cM) and BMS2780 (15 cM), in agreement with [28]. More generally,
the location of the eleven blood groups was updated (Tab. II). The total
map spanned 3 353 cM Haldane or 2 731 cM Kosambi. Among the 128
segments between microsatellite markers, 10, 29, 42, 34, 8, 4, and 1 were in
the [0, 10], ]10, 20], ]20, 30], ]30, 40], ]40, 50], ]50, 60], and ]60, 70] intervals
(cM Haldane), respectively. The average information content over the whole
genome, measured by the mean of |2p
ij
− 1| over all locations and all progeny,
is presented in Table II and reached 0.685. Figure 1 shows that it was lower
than 50% in the five chromosomal regions.
84 D. Boichard et al.
Table II. Characteristics of the genome coverage. (continued on the next page)
Chromo-
some
No. of
markers
Length, cM
Haldane /
Kosambi
Proportion of
heterozygous
sires
(2)
Average
informativity
(3)
Markers (distance, cM Haldane)
(1)
1 10 184 / 154 0.61 0.69 INRA212 (21) DIK70 (29) BM4307 (22) BM1312 (17) INRA073
(25) CSSM032 (35) BM3205 (2) UWCA46 (12) BLAD (21)
BMS2263
2 8 145 / 119 0.70 0.75 TGLA44 (6) TGLA431 (27) TGLA377 (8) CSSM042 (35)
ILSTS082 (41) MM8 (18) INRA135 (10) INRA231
3 7 141 / 115 0.59 0.67 BMS871 (24) ILSTS096 (2) EAL (14) CSSM054 (36) INRA123
(33) HUJI177 (32) INRA197
4 6 119 / 96 0.67 0.66 BL1030 (39) RM188 (31) MAF50 (6) INRA072 (31) HEL25 (12)
RM088
5 7 146 / 118 0.66 0.69 BM6026 (28) RM103 (36) RM500 (13) CSSM022 (47) BM315 (8)
ETH2 (14) ETH152
6 5 163 / 123 0.68 0.60 ILSTS93 (54) BM1329 (12) DIK82 (41) INRAK (56) BM2320
7 5 128 / 101 0.62 0.55 RM6 (47) BM741 (37) INRABER192 (30) ILSTS006 (14)
INRA053
8 7 144 / 116 0.74 0.72 BMS1864 (12) IDVGA11 (36) BMS678 (18) INRA129 (7) HUJ174
(16) HEL9 (55) BMS2847
9 6 127 / 105 0.72 0.69 ETH225 (32) BM2504 (16) UWCA9 (26) BM2377 (21) INRA144
(32) BMS1967
10 6 97 / 80 0.72 0.71 BM1237 (29) TGLA378 (22) INRA071 (36) DIK20 (3) EAZ (7)
CSSM039
11 8 200 / 159 0.70 0.67 HAUT30 (16) INRA044 (36) INRA177 (31) BMS1822 (20)
IDVGA3 (27) INRABER162 (10) BMS2208 (60) EAJ
12 6 141 / 111 0.78 0.73 BMS410 (44) IDVGA57 (33) BM6404 (23) EAB (2) INRA005 (39)
INRA209
13 5 117 / 94 0.80 0.75 TGLA23 (23) BMC1222 (29) HUJ616 (37) ABS10 (28) DIK93
14 5 126 / 95 0.72 0.61 CSSM066 (63) RM011 (23) BMS1899 (39) INRA092 (1) INRA100
QTL detection in dairy cattle 85
Table II. Continued.
Chromo-
some
No. of
markers
Length, cM
Haldane /
Kosambi
Proportion of
heterozygous
sires
(2)
Average
informativity
(3)
Markers (distance, cM Haldane)
(1)
15 5 85 / 70 0.78 0.74 BR3510 (14) INRA224 (27) BMS2684 (8) EAA (36) IOBT395
16 6 107 / 89 0.60 0.74 BM6430 (35) TGLA053 (19) ETH11 (18) INRA048 (30) HUJ625
(5) EAR
17 6 88 / 75 0.57 0.65 BMS499 (25) EAF (15) BMS2780 (25) IDVGA40 (14) CSSM033
(9) BM1862
18 7 123 / 103 0.73 0.72 IDVGA31 (23) ABS13 (40) HAUT14 (22) ILSTS002 (12)
IDVGA55 (11) EAC (15) TGLA227
19 8 155 / 127 0.55 0.65 BM9202 (21) HEL10 (29) URB44 (17) BMS2389 (19) EAT (7)
BMS1069 (12) ETH3 (50) BMC1013
20 5 84 / 70 0.72 0.71 HEL12 (9) BM1225 (25) TGLA126 (25) ILSTS072 (25) UWCA26
21 6 100 / 84 0.85 0.79 BM8115 (30) BP33 (6) EAS (16) ILSTS103 (28) TGLA122 (20)
CSSM018
22 4 106 / 84 0.68 0.59 CSSM026 (37) CSSM006 (37) CSSM041 (32) UWCA49
23 6 84 / 71 0.62 0.75 IOBT528 (14) RM33 (26) EAM (1) BOLADRBP1 (13) BM7233
(30) BM1905
24 4 79 / 65 0.73 0.69 TGLA351 (31) CSSM031 (25) ILSTS031 (23) INRA090
25 4 83 / 68 0.83 0.75 IDVGA71 (34) INRA206 (29) BP28 (20) INRA222
26 4 57 / 48 0.60 0.66 ABS12 (12) BMS907 (15) INRA081 (30) IDVGA59
27 3 58 / 47 0.60 0.54 BM3507 (23) INRAMTT183(35) INRA027
28 5 66 / 57 0.68 0.76 BMS2060 (22) ETH1112 (22) IDVGA43 (16) IDVGA8 (6)
BM2515
29 5 100 / 82 0.72 0.71 ILSTS015 (38) BMC8012 (12) ABS14 (25) BL1100 (25) ILSTS081
Total 169 3 353 / 2 731 0.68 0.685
(1)
For each chromosome, the first marker is the closest to the centromere.
(2)
Proportion of heterozygous sires averaged over all markers of the chromosome.
(3)
Average value of |1 − 2P| over the chromosome.
86 D. Boichard et al.
Table III. Distribution of the observed P-values over all analyses (n = 696).
P value (%) Frequency (%)
0–1 8.7
1–2 5.1
2–3 3.9
3–4 2.7
4–5 3.1
5–10 8.7
10–50 41.6
50–100 26.2
0,00
0,05
0,1 0
0,1 5
0,2 0
0,2 5
0 2 0 4 0 6 0 8 0 1 00 1 2 0 1 4 0 1 6 0
False discovery rate
0,00
0,01
0,02
0,03
0,04
0,05
0,06
0,07
N u m b e r o f r e j e c t e d H 0 h y p o t h e s e s
p
v a l u e
0.25
0.20
0.15
0.10
0.05
0.00
0.07
0.06
0.05
0.04
0.03
0.02
0.01
0.00
Figure 2. Evolution of the false discovery rate (bold) and the chromosome-wise type-1
error (thin) with the number of rejected null hypotheses.
3.2. QTL results
The distribution of the P-values obtained for 696 chromosome × trait
combinations analysed is presented in Table III. A high concentration of
P-values (18%) was observed between 0 and 3% and a clear overrepresentation
could still be noticed up to 10%. Figure 2 presents the false discovery rate as
a function of the number of rejected H0 hypotheses. The false discovery rate
was extremely low (< 5%) for the 20 most significant results. It gradually
increased up to 12% for the next 20 tests, and more slowly increased for the
next 80 tests. For a 3% P-value, the false discovery rate was only around 15%,
showing that more than 100 significant tests out of 120 likely corresponded to
true QTL.
QTL detection in dairy cattle 87
Thirty-two results were genome-wise (or nearly genome-wise) significant
(Tab. IV), 22 results had a chromosome-wise significance level ranging from
0.34 to 1% (Tab. V), and 66 additional results had a significance level ranging
from 1 to 3% (Tab. VI). In all cases, the number of informative sires (i.e.
heterozygous for the QTL) was limited and ranged from 1 to 5 out of 14.
QTL were found for all traits. Figure 3 presents some of the most interesting
results in a standardised way, where the y-axis represents log
10
(1/P). QTL for
production were detected on chromosomes 7, 14, 19, and 26. Chromosome 11
was found to affect the lactation persistency whereas the effect on production
was more limited. Chromosomes 3, 6, 7, 14, 18, and 20 affected fat or
protein content, or both traits. A strong QTL of somatic cell score was found
on chromosome 15, as well as three other putative QTL on chromosomes 9,
10, and 21. Female fertility was influenced by QTL on chromosome 1, 7,
and possibly 21. A major QTL for skeletal development was detected on
chromosome 5, and two others on chromosomes 6 and 13. Chromosome 28
was found to strongly affect the udder cleft, implantation, and teat placement
front, which are correlated traits. The other udder traits were affected by other
regions: chromosomes 9, 18, 19, and 20 for udder balance, 2, 12, and 13 for
teat distance side view, chromosome 27 for teat length. Three putative QTL
were also found for milking speed on chromosome 6, 8, and 13. Rump angle
was characterised by 3 QTL on chromosome 1, 13, and 19, whereas heel depth
was affected by one QTL on chromosome 15.
Most substitution effect estimates ranged from 0.6 to 1 genetic standard
deviation. Estimates of QTL contributions to the genetic variance are shown
in Table VII. They ranged from 6 to 40% but most estimates were between 7
and 18%.
The confidence intervals of QTL location estimated by bootstrap were much
larger than those estimated by the lod drop-off method (Tabs. IV and V). In
the best situations, they ranged from 14 to 30 cM but they frequently exceeded
50 cM and sometimes included the complete chromosome. An illustration of
the bootstrap distribution is given in Figure 4 for SCS on chromosome 15.
The two-QTL analysis provided little additional information (Tab. VIII).
Two linked QTL were suggested for fertility on chromosome 1, rump width on
chromosome 5, protein yield on chromosome 18, fat yield on chromosome 19,
and heel depth on chromosome 24. On chromosome 15, the two-QTL model
was better than the one-QTL models but the locations were quite close to each
other. In all cases, the evidence was not strong for the 2-QTL hypothesis.
4. DISCUSSION AND CONCLUSION
Many results are reported in this paper. This high number of significant
results is explained on the one hand by the large number of traits analysed
88 D. Boichard et al.
Table IV. Genome-wise significant QTL (chromosomewise significance with
P < 0.34%).
Trait Chromo-
some
P (%) Location
of
maximum
(1)
Closest marker Location confidence
interval (cM)
(2)
Number
of hetero-
zygous
sires
Average
substitu-
tion effect
(σ
g
)
Milk 14 0.02 0 CSSM066 0–25 / 0–43 4 0.82
Fat 14 0.11 0 CSSM066 0–42 / 0–108 2 1.04
19 0.13 134 BMC1013 88–154 / 12–132 4 0.98
26 < 0.001 57 IDVGA59 20–51 / 12–57 4 1.02
Protein 7 0.29 84 INRABERN192 71–90 / 30–90 2 0.70
26 0.04 57 IDVGA59 18–51 / 11–57 3 0.81
Fat percent 14 < 0.001 0 CSSM066 0–9 / 0–19 4 1.25
Protein percent 6 0.04 98 INRAK 84–129/ 82–129 3 0.77
14 < 0.001 0 CSSM066 0–70 / 7–82 4 1.25
20 0.35 38 TGLA126 21–50 / 11–53 3 0.68
Persistency 11 0.19 124 INRABER162 115–138 / 88–140 2 0.80
SCS 15 0.05 40 BMS2684 35–45 / 22–48 2 0.64
Udder cleft 28 0.27 4 BMS2060 0–18 / 0–61 3 0.68
Udder balance 18 0.05 98 IDVGA55 90–115 / 70–118 4 0.78
19 0.33 30 HEL10 19–62 / 20–95 2 0.82
Teat distance 12 0.03 88 BM6404 78–100 / 57–105 4 0.57
side view 13 0.05 8 TGLA23 0–44 / 0–58 2 0.72
Implantation 28 0.04 4 BMS2060 0–17 / 0–47 2 1.47
Teat length 27 0.02 40 INRAMTT183 29–52 / 25–52 2 1.01
Height at 5 < 0.001 124 BM315 116–134 / 116–136 3 1.10
Sacrum 6 0.24 54 BM1329 43–63 / 36–75 3 0.64
13 0.40 74 ABS10 62–96 / 22–108 2 1.29
Rump length 5 0.27 124 BM315 114–128 / 54–128 2 1.01
20 0.30 34 TGLA126 22–48 / 17–48 2 0.65
Rump width 5 0.03 124 BM315 110–124 / 67–124 3 0.94
6 0.32 62 DIK82 37–85 / 30–123 3 0.74
8 0.07 140 BMS2847 124–140 / 46–144 4 0.87
20 0.31 24 TGLA126 15–38 / 12–40 2 0.68
Rump angle 1 0.15 40 BM4307 23–58 / 26–103 4 0.60
13 0.06 54 HUJ616 42–66 / 39–66 3 0.82
19 0.23 118 ETH3 100–135 / 29–135 4 0.99
Heel depth 15 0.31 30 BMS2684 22–35 / 18–38 3 1.09
(1)
Location in cM Haldane (see Tab. I).
(2)
[95% Lod Drop-off confidence interval] / [90% Bootstrap confidence interval].
QTL detection in dairy cattle 89
Table V. QTL with a chromosomewise significance level (P) ranging from 0.34 to 1%.
Trait Chromo-
some
Location
of
maximum
(1)
P (%) Closest marker Location confidence
interval (cM)
(2)
Number of
hetero-
zygous
sires
Average
substitu-
tion effect
(σ
g
)
Milk 7 84 0.9 INRABER192 71–92 / 10–120 3 0.67
Fat 7 84 0.6 RM6 60–92 / 5–120 2 0.72
Protein 19 138 0.8 ETH3 120–147 / 50–145 3 1.00
Fat percent 7 76 0.4 INRABER192 52–99 / 11–135 1 0.79
Protein percent 3 24 1.0 ILSTS096 6–32 / 13–123 4 0.63
18 10 0.8 ABS13 0–27 / 0–118 2 0.84
SCS 10 86 0.9 DIK20 66–90 / 6–92 3 0.62
Milking speed 6 160 0.8 BM2320 132–160 / 72–160 1 0.40
8 50 0.8 BMS678 28–58 / 12–60 3 0.37
13 94 0.8 ABS10 85–105 / 72–103 3 0.54
Fertility 1 62 0.5 INRA073 49–100 / 50–133 3 1.12
7 120 0.37 INRA053 116–122 / 91–125 2 1.16
Udder balance 9 48 0.6 UWCA9 40–56 / 37–90 3 0.53
20 30 0.6 TGLA126 8–32 / 6–58 2 0.75
Teat distance
side view
2 38 0.39 CSSM042 22–53 / 19–61 2 0.65
Teat placement
front
28 4 0.6 IDVGA8 0–60 / 0–64 2 0.91
Chest depth 2 40 0.6 CSSM042 33–50 / 32–135 1 1.08
5 124 1.0 BM315 104–129 / 10–135 3 0.85
9 127 0.7 BMS1967 114–127 / 14–127 4 0.89
Rump angle 11 146 0.7 BMS2208 132–184 / 30–178 3 0.89
17 8 0.5 BMS499 0–30 / 2–88 2 1.22
Heel depth 7 32 0.8 BM741 20–40 / 14–120 1 3.80
(1)
Location in cM Haldane (see Tab. I).
(2)
[95% Lod Drop-off confidence interval] / [90% Bootstrap confidence interval].
and, on the other hand, by the size of the overall design and of each individual
family. Only large families were selected to guarantee the highest detection
power. According to [32], such a design should provide a detection power
greater than 90% for biallelic QTL with balanced frequencies and substitution
effects greater than 0.5 genetic standard deviation. The actual detection power
is likely to be lower because QTL allele frequencies are not balanced. This
was clearly shown by the small number (1–5 out of 14) of heterozygous sires
for each detected QTL. This likely reflects the small number of alleles with
90 D. Boichard et al.
Table VI. QTL detected with a chromosomewise significance level (P) ranging from
1 to 3%. (continued on the next page)
Trait Chromo-
some
Location
of
maximum
(1)
Closest marker P (%) Number of
heterozygous
sires
Milk 11 128 INRABERN162 1.8 2
19 129 BMC1113 3.0 1
26 56 IDVGA56 2.1 2
Protein 17 87 BM1862 2.3 1
22 16 CSSM026 2.7 1
Fat percent 15 84 IOBT395 1.8 1
19 93 BMS1069 1.6 3
22 106 UWCA49 2.3 2
Protein percent 15 84 BMS2684 2.2 1
Persistency 17 70 CSSM033 1.4 3
SCS 9 125 BMS1967 1.3 2
21 90 TGLA122 1.5 1
23 19 RM33 1.7 2
Milking speed 5 97 CSSM022 1.3 2
19 94 BMS1069 1.7 3
22 38 CSSM006 1.4 2
Fertility 10 95 CSSM039 2.4 3
20 75 UWCA26 1.5 3
21 56 ILSTS103 1.4 3
Udder cleft 10 55 INRA071 1.8 3
20 9 BM1225 1.2 2
25 78 INRA222 1.6 2
Udder depth 4 44 RM188 2.6 2
6 147 BM2320 2.6 3
9 100 INRA144 1.1 3
10 49 INRA071 2.5 1
13 96 ABS10 2.3 3
20 14 BM1225 1.0 3
21 10 BM8115 1.2 2
Udder balance 1 49 BM4307 1.9 2
14 0 CSSM066 3.0 2
21 24 BP33 1.6 1
QTL detection in dairy cattle 91
Table VI. Continued.
Trait Chromo-
some
Location
of
maximum
(1)
Closest marker P (%) Number of
heterozygous
sires
Teat distance 4 35 RM188 1.4 1
side view 10 42 INRA071 2.2 2
11 100 INRA177 2.4 1
18 115 TGLA227 2.3 2
Teat placement 6 87 INRAK 2.4 3
front 9 56 UWCA9 2.4 2
17 87 BM1862 2.0 2
Implantation 2 34 TGLA377 2.9 3
8 88 HEL9 1.6 4
9 99 INRA144 2.3 2
15 26 INRA224 1.3 2
Rear udder 5 45 RM500 1.7 3
attachment 6 162 BM2320 1.4 1
9 42 UWCA9 1.4 2
Teat length 2 58 CSSM042 2.7 2
6 65 DIK82 2.8 1
8 135 BMS2847 1.5 1
13 0 TGLA23 1.8 2
21 12 BP33 1.6 2
28 40 IDVGA43 1.8 3
Height at sacrum 2 36 TGLA377 1.0 2
11 82 BMS1822 1.4 2
Chest depth 1 83 INRA073 2.6 2
11 86 INRA177 2.7 1
20 14 BM1225 2.1 3
24 56 ILSTS031 1.0 1
Rump length 1 93 INRA073 3.0 2
11 36 INRA177 1.3 2
28 37 IDVGA43 1.8 3
Rump width 11 82 BMS1822 2.3 4
Rump angle 8 48 BMS678 1.1 2
28 56 IDVGA8 1.3 1
Heel depth 9 32 BM2504 1.7 2
18 74 ILSTS002 2.3 2
(1)
Location in cM Haldane (see Tab. I).
92 D. Boichard et al.
0
0.5
1
1.5
2
2.5
0.0 0.2 0.4 0.6 0.8 1.0 1.2 1.4 1.6 1.8
Female
Fertility
0
1
2
3
4
5
0.0 0.2 0.4 0.6 0.8 1.0 1.2 1.4
0
1
2
3
4
0.0 0.2 0.4 0.6 0.8 1.0 1.2 1.4 1.6
0
0.5
1
1.5
2
2.5
0.0 0.2 0.4 0.6 0.8 1.0 1.2
Milk Protein Fertility
0
1
2
3
0.0 0.2 0.4 0.6 0.8 1.0 1.2 1.4 1.6 1.8 2.0
Persistency
0
1
2
3
4
0.0 0.2 0.4 0.6 0.8 1.0 1.2 1.4
Figure 3. Location score profiles, expressed as log
10
(1/P), for 12 chromosomes.
The critical probability P at each location is obtained by the comparison of the
observed likelihood ratio test at this location with the distribution under H0 (obtained
by permutation) of the maximum LRT over the chromosome. As 100 000 permutations
were performed, log
10
(1/P) is bounded to 5.
very different effects and/or the rather low frequency of the QTL alleles with
an extreme effect. Consequently, only a small part of the design contributes to
the detection of a given QTL and a typical design with 10–20 families could
miss a QTL when no family is informative. Assuming a biallelic QTL with
unbalanced frequencies 0.1 and 0.9 (compatible with 20% heterozygous sires)
and a substitution effect of 0.7 σ
g
, the actual detection power of our design is
around 70% and is still quite high.
One hundred and twenty QTL results were tabulated. Of course, 15 to
20 were probably false positives, and were most likely those with P-values
between 1 and 3%. But conversely, this experiment showed that the number
of true QTL is likely to be higher. Indeed, the number of H1 hypotheses could
be roughly estimated from the observed distribution of the tests. Assuming a
uniform distribution of the P-values when H0 is true and also assuming that all
QTL detection in dairy cattle 93
0
1
2
3
4
0.0 0.1 0.2 0.3 0.4 0.5 0.6 0.7 0.8
SCC
0
1
2
3
4
0.0 0.2 0.4 0.6 0.8 1.0 1.2
Udder
Balance
0
1
2
3
4
5
0.0 0.2 0.4 0.6 0.8 1.0 1.2
Milk Fat
0
1
2
3
0.0 0.2 0.4 0.6 0.8 1.0 1.2 1.4
Fat Protein
0
1
2
3
4
5
0 0.1 0.2 0.3 0.4 0.5 0.6
Fat
Protein
0
1
2
3
4
0 0.1 0.2 0.3 0.4 0.5 0.6
Implantation
Figure 3. Continued. Location score profiles, expressed as log
10
(1/P), for 12 chro-
mosomes. The critical probability P at each location is obtained by the comparison
of the observed likelihood ratio test at this location with the distribution under H0
(obtained by permutation) of the maximum LRT over the chromosome. As 100 000
permutations were performed, log
10
(1/P) is bounded to 5.
P-values greater than 50% corresponded to true H0 situations, the number of
true H0 situations could be estimated by twice the number of results in the [50,
100] P-value interval. This method led to 364 H0 situations only, and therefore
to 696 − 364 = 332 H1 situations. This value is much larger than the number
of results tabulated.
QTL were detected for all traits, even those with a very low heritability like
fertility, although the reliability of the bull evaluations was below 0.50 for this
trait. This was predicted by the theory. As pointed out by [32], the residual
variance in a granddaughter design is equal to 3/16h
2
σ
2
p
+ (1 − h
2
/4)σ
2
p
/nd
(where σ
2
p
is the phenotypic variance), and decreases with the heritability when
the number of granddaughters per son (nd) is large enough. Consequently,
94 D. Boichard et al.
Table VII. Estimates of the proportion of variance due to some QTL in the total
genetic variance.
Chromosome Trait Proportion (%)
1 Fertility 15
3 Protein content 7
6 Protein content 18
6 Milking speed 13
7 Protein 8
7 Fertility 16
8 Milking speed 8
9 Cell counts 7
11 Persistency 8
13 Milking speed 9
14 Milk yield 13
14 Fat 9
14 Fat content 40
14 Protein content 30
15 Cell counts 9
18 Protein content 9
19 Fat 9
19 Protein 17
20 Protein content 7
26 Fat 16
26 Protein 10
Table VIII. Results of the 2-QTL analysis.
Chromosome Trait Locations
(1)
P(2 QTL vs.
QTL1), %
P(2 QTL vs.
QTL2), %
1 Fertility 85, 163 5.0 3.2
5 Rump width 75, 124 1.6 5.0
18 Protein yield 58, 70 3.0 2.0
19 Fat yield 67, 155 3.8 4.0
24 Heel depth 17, 45 2.2 4.8
(1)
Location in cM Haldane (see Tab. I).
the detection power increases when the heritability decreases, if the number of
granddaughters per son is high.
The estimates of the QTL effects were rather homogeneous and most substi-
tution effects in the informative families ranged from 0.6 to 1 genetic standard
QTL detection in dairy cattle 95
0
0, 5
1
1 , 5
2
2 , 5
3
3 , 5
0 0, 1 0, 2 0, 3 0, 4 0, 5 0, 6 0, 7 0, 8
0
5 0
1 00
1 5 0
2 00
2 5 0
3 00
Bootstrap distribution of the location
Chromosome 15
log10 ( 1 / p )
9 0 % b o o t s t r a p C I
9 9 % L o d d r o p - o f f C I
3.5
3
2.5
2
1.5
1
0.5
0
0 0.1 0.2 0.3 0.4 0.5 0.6 0.7 0.8
Figure 4. Location score profile, expressed as log
10
(1/P), for somatic cell score on
chromosome 15 and bootstrap distribution of the estimated locations. Triangles show
the location of the markers.
deviation. Note that this mode of expression is preferable in a granddaughter
design, because the variability of twice the DYD tends to the genetic variance
when the number of granddaughters is large. This relative homogeneity in
the estimates could be explained as follows. On the one hand, smaller effects
are difficult to detect and would require many informative families. On the
other hand, larger true effects are likely to be rare, and because this design
included large families, the effects were probably not strongly overestimated.
Some effect estimates, as for heel depth on chromosome 7 (3.8 genetic standard
deviations), were much larger and were likely overestimated.
The most significant QTL is located close to the centromer of chromosome 14
and it affects the production traits and particularly fat content. Its effect also
exceeds the usual range and reached 1.25 genetic standard deviations. In fact,
this QTL, already found in different studies, could be considered as a major
gene. It probably has two alleles only, with a strong substitution effect and it
explains 40% of the genetic variability in this design and around 50% in the
Holstein breed. Before its detection with genetic markers, its existence was
already postulated [5] to explain a clear deviation to the polygenic model in
this breed, the large increase in fat content heritability and changes in genetic
correlations between fat content and other production traits. This QTL has
recently been characterised [14]. It corresponds to a mutation of the DGAT1
gene which encodes an enzyme involved in the fatty acid synthesis.
Except for chromosome 14 on fat (and protein) content, the part of genetic
variance explained by each QTL was rather low and ranged from 6 to 18%.
96 D. Boichard et al.
These values are quite limited. For a given trait, several QTL were necessary
to explain a substantial part of the genetic variability and, in most situations,
the major part of the genetic variability remained unexplained.
The literature is rather abundant for production and milk composition but
more rare for functional traits. For production and milk composition, many
results often reported in the literature were confirmed, particularly on chromo-
somes 3, 6, 7, 14, 20, and 26 [1, 2,8,12, 15,22,23,25,26,30,34]. Other QTL
on chromosomes 1, 17 and 23 reported by several authors were less clear in
the present study (P = 3.9% and 2.3% for chromosome 1 and 17, respectively)
or not detected (chromosome 23). A clear QTL affecting production was also
detected on chromosome 19 and was in agreement with [21] although it was
not confirmed by any large scale study. Several new QTL were found, on
chromosome 11 for persistency, and on chromosome 18 for contents. Finally,
the number of QTL found for milk and protein yields was rather limited,
whereas the number of QTL affecting fat yield, fat or protein contents was
greater. The low number of QTL found for milk yield (and protein yield,
which is highly correlated) could be explained by the intense selection over
time, whereas milk composition was less selected. But the situation of fat
yield, with several strong QTL, is more surprising.
When a chromosomal region was found to affect several traits, the estimated
effects were in agreement with the genetic correlations. However, in many
situations, fat and protein contents were not affected by the same QTL, show-
ing that fat and protein could be disentangled. Similarly, several QTL were
found to affect contents, whereas milk yield, although negatively correlated
to the contents, was not affected. Again, the QTL on chromosome 14 was
an exception. Although milk and fat yields were positively correlated, QTL
effects on these two traits were in the opposite directions, illustrating the
dramatic effect of this QTL on fat content.
Four QTL were found for somatic cell counts, on chromosome 9, 10, 15,
and 21. The latter result was already reported by [15] and the others were
original. None of these QTL co-segregated with QTL for udder type or milking
speed, suggesting that their mechanism is not related to the udder shape or
teat elasticity. In contrast with [24], no effect was found on chromosome 23,
although this chromosome carries the major histocompatibility complex (Bola)
known to be deeply involved in the infection resistance mechanism. Similarly,
the QTL on chromosome 26 detected by [34] was not confirmed.
Three QTL were also found for fertility on chromosome 1, 7, and 21, and
this is the first time that significant QTL are reported for this trait. Only
one QTL, on chromosome 7, could be linked to production, and may reflect
the antagonistic genetic correlation between fertility and production, although
the QTL of fertility seems to be more telomeric. On chromosome 1, the
confidence interval of the location was particularly large and the peak of
QTL detection in dairy cattle 97
individual families suggested the presence of several linked QTL. The 2-QTL
analysis also suggested the presence of two linked QTL.
Several QTL were found to affect the stature on chromosomes 2, 5, 6, and 13.
On the telomeric part of chromosome 5, the likelihood ratio test for the height
at the sacrum by far exceeded the highest individual value obtained under H0
in the 100 000 permutations. The estimated effect reached 1.1 genetic standard
deviations in two families and could be considered as a major gene. This QTL
was already reported by [27].
Udder depth is the most interesting udder trait for selection purposes, because
it is the best morphological predictor of mastitis resistance and longevity. It was
characterised by many (9) putative QTL with a chromosome-wise significance
level ranging from 1 to 4%, but no highly significant QTL was found. This
disappointing result could likely be attributed to the composite definition of
this trait and, therefore, its determinism more complex than for more analytical
traits.
Three different breeds were used and it would be interesting to determine
whether some QTL are breed-specific. In fact, it remains difficult to answer
this question because the number of Montbéliarde or Normande families was
limited (2 and 3, respectively) and because the number of informative families
was also very small (1 to 5, and 3 on average). The analysis of additional
families is needed to address this point. Nevertheless, much less QTL were
found in the Normande breed than in the two other breeds but this may be at
least partly explained by the smaller size of the three Normande families. We
also believe that the genetic determinism of fat content is very specific in the
Holstein breed and this is likely due to the QTL carried by chromosome 14.
Although this gene is not specific to the Holstein, it is responsible for a much
larger part of the genetic variance in this breed than in the others, probably
because of very different allelic frequencies.
In all cases, the location confidence intervals were extremely large. This
disappointing result was expected. With only a few informative families, QTL
locations were estimated with 150–300 informative meioses. This clearly
shows that this design should be expanded in terms of the number of markers
but also in terms of the number of informative families in order to obtain more
reasonable confidence intervals compatible with marker-assisted selection and
fine mapping techniques.
As expected, the 2-QTL analysis provided very limited results. Two linked
QTL can be distinguished in the same families only when they are separated by
two informative markers, a rather rare situation in this design. Linked QTL for
milk composition on chromosomes 3, 6, or 20, suggested by different studies
were not found here. Nevertheless, two linked QTL were suggested for protein
yield on chromosome 18, fat yield on chromosome 19, fertility on chromo-
some 1, rump width on chromosome 5, and heel depth on chromosome 24. On
98 D. Boichard et al.
chromosome 15, the strong QTL effect detected for the somatic cell score could
result from two rather close QTL (20 cM) segregating in different families. In
practice, little results were expected from this two-QTL analysis because of the
limited density of the marker map.
To confirm QTL, Coppieters et al. [9] proposed to analyse the maternal
information. In a granddaughter design, the number of sons per dam is too
small to analyse within-dam segregations. But when the dams originate from
a limited number of maternal grandsires, QTL detection can be carried out
within maternal grandsires. Bolard and Boichard [6] extended their approach
in the case where dams and maternal grand sires are not genotyped. Applied to
this design, this method confirmed many QTL described in the present study.
In most situations, the confidence interval of the location was very large and
it was impossible to test for two linked QTL, emphasizing the need for a denser
marker map and for even larger families. The QTL effects, however, are quite
large and very attractive for MAS. A strong limitation is the small number of
heterozygous sires and the unknown status of the homozygous ones. Therefore,
this project is continued into three different directions by adding new families
in the analysis, by working on the fine mapping and the characterisation of
some QTL, and by using some of these results in marker-assisted selection.
ACKNOWLEDGEMENTS
This program was supported by the French AI industry (UNCEIA), and
by a grant of the Groupe d’étude et de recherche sur les génomes (GREG).
D. Boichard is grateful to the “Mathématiques and marqueurs moléculaires”
(MMM) Inra group for continuous discussions and for the joint development
of the QTL analysis software. V. Ducrocq and H. Larroque are gratefully
acknowledged for providing the type evaluations.
REFERENCES
[1] Arranz J.J., Coppieters W., Berzi P., Cambisano N., Grisart B., Karim L., Marcq
F., Moreau L., Nezer C., Riquet J., Simon P., Vanmanshoven P., Wagenaar
D., Georges M., A QTL affecting milk yield and composition maps to bovine
chromosome 20: a confirmation, Anim Genet. 29 (1998) 107–115.
[2] Ashwell M.S., Van Tassell C.P., Sonstegard T.S., A genome scan to identify
quantitative trait loci affecting economically important traits in a US Holstein
population, J. Dairy Sci. 84 (2001) 2535–2542.
[3] Barendse W., Vaiman D., Kemp S.J., Sugimoto Y., et al., A medium-density
genetic linkage map of the bovine genome, Mamm. Genome 8 (1997) 21–28.
[4] Bennewitz J., Reinsch N., Kalm E., Proposals for improved bootstrap confidence
intervals in QTL. Proc 51st Ann. Meet. Eur. Assoc. Anim. Prod., The Hague,
The Netherlands (2000). Paper G1.9.
QTL detection in dairy cattle 99
[5] Boichard D., Elsen J.M., Le Roy P., Bonaïti B., Segregation analysis of fat
content data in Holstein × European Friesian crossbred cattle. 4th World Cong.
Genet. Appl. Livest. Prod., Edinburgh, Scotland. 14, 4th WCGALP Congress
office, 1990, University of Edinburgh, Scotland, pp. 167–170.
[6] Bolard M., Boichard D., Use of maternal information for QTL detection in a
(grand)daughter design, Genet. Sel. Evol. 34 (2002) 335–352.
[7] Churchill G.A., Doerge R.W., Empirical threshold values for quantitative trait
mapping, Genetics. 138 (1994) 963–971.
[8] Coppieters W., Riquet J., Arranz J.J., Berzi P., Cambisano N., Grisart B., Karim
L., Marcq F., Moreau L., Nezer C., Riquet J., Simon P., Vanmanshoven P., Wagen-
aar D., Georges M., A QTL with major effect on milk yield and composition
maps to bovine chromosome 14, Mamm. Genome 9 (1998) 540–544.
[9] Coppieters W., Kvasz A., Arranz J.J., Grisard B., Farnir F., Riquet J., Georges
M., The great-grand-daughter design: a simple strategy to increase the power of a
grand-daughter design for QTL mapping, Genet. Res. Camb. 74 (1999) 189–199.
[10] Elsen J.M., Mangin B., Goffinet B., Boichard D., Le Roy P., Alternative models
for QTL detection in livestock. I. General information, Genet. Sel. Evol. 31
(1999) 213–224.
[11] Geldermann H., Investigations on inheritance of quantitative characters in anim-
als by gene markers, Theor. Appl. Genet. 46 (1975) 319–330.
[12] Georges M., Nielsen D., Makinnon M., Mishra A., Okimoto R., Pasquino A.T.,
Sargeant L.S., Sorensen A., Steele M.R., Zhao X., Womack J.E., Hoeschele I.,
Mapping quantitative trait loci controlling milk production in dairy cattle by
exploiting progeny testing, Genetics 139 (1995) 907–920.
[13] Goffinet B., Boichard D., Le Roy P., Elsen J.M., Mangin B., Alternative models
for QTL detection in livestock. III. Heteroskedastic model and models corres-
ponding to several distributions of the QTL effect, Genet. Sel. Evol. 31 (1999)
341–350.
[14] Grisard B., Coppieters W., Farnir F., Karim L., Ford C., Berzi P., Cambisano
N., Mni M., Reid S., Simon P., Spelman R., Georges M., Snell R., Positional
candidate cloning of a QTL in dairy cattle: identification of a missense mutation
in the bovine DGAT1 gene with a major effect on milk yield and composition,
Genome Res. 12 (2001) 222–231.
[15] Heyen D.W., Weller J.I., Ron M., Gand M., Feldmesser E., Da Y., Wiggans
G.R., VanRaden P.M., Lewin H.A., A genome scan for quantitative trait loci
influencing milk production and health traits in dairy cattle, Physiol. Genomics
1 (1999) 165–175.
[16] Iannucelli E., Woloszin N., Arhainx J., Gellin J., Milan D., Gemma: a database
to manage and automate microsatellite genotyping, 25th Congr. Int. Soc. Anim.
Genet., 21–25 July 1996, Tours, France, Anim. Genet. 27 (1996) Suppl 2, 55.
[17] Interbull, Sire evaluation procedures for non dairy production traits practised in
various countries, Interbull. Bull. 13, 1996, Upssala, Sweden.
[18] Interbull, National genetic evaluation programmes for dairy production traits
practised in Interbull member countries, Interbull. Bull. 24, 2000, Upssala,
Sweden.
100 D. Boichard et al.
[19] Kappes S.M., Keele J.W., Stone R.T., McGraw R.A., Sonstegard T.S., Smith
T.P., Lopez-Corrales N.L., Beattie C.W., A second-generation linkage map of
the bovine genome, Genome Res. 7 (1997) 235–249.
[20] Knott S.A., Elsen J.M., Haley C.S., Methods for multiple marker mapping of
quantitative trait loci in half-sib populations, Theor. Appl. Genet. 93 (1996)
71–80.
[21] Lagziel A., Lipkin E., Ezra E., Soller M., Weller J.I., An MspI polymorphism
at the bovine growth hormone (gGH) gene is linked to a locus affecting milk
protein percentage, Anim. Genet. 30 (1999) 296–299.
[22] Mosig M.O., Lipkin E., Khutoreskaya G., Tchourzyna E., Soller M., Friedmann
A., A whole genome scan for quantitative trait loci affecting milk protein per-
centage in Israeli-Holstein cattle, by means of selective milk DNA pooling in a
daughter design, using an adjusted false discovery rate criterion, Genetics 157
(2001) 1683–1698.
[23] Plante Y., Gibson J.P., Nadesalingam J., Mehrabani-Yeganeh H., Lefebvre S.,
Vandervoort G., Jansen G.B., Detection of quantitative trait loci affecting milk
production traits on 10 chromosomes in Holstein cattle, J. Dairy Sci. 84 (2001)
1516–1524.
[24] Reinsch N., Xu N., Thomsen H., Looft C., Kalm E., Grupe S., Kuhn C., Schwerin
M., Leyhe B., Hienleder S., Erhard G., Medjugorac I., Russ I., Forster M., Brenig
B., Reents R., Averdunk G., First results on somatic cell counts loci form the
ADR bovine mapping project. Proc. 6th World Cong. Genet. Appl. Livest. Prod.,
26, 6th WCGALP Congress office, 1998, University of New England, Armidale,
Australia, pp. 426–428.
[25] Ron M., Heyen D.W., Weller J.I., Band M., Feldmesser E., Pasternak H., Da Y.,
Wiggans G.R., VanRaden P.M., Ezra E., Lewin H.A., Detection and analysis of
a locus affecting milk concentration in a US and Israeli dairy cattle population.
Proc. 6th World Congr. Genet. Appl. Livest. Prod., 26, 6th WCGALP Congress
office, 1998, University of New England, Armidale, Australia, pp. 422–425.
[26] Spelman R., Coppieters W., Karim L., van Arendonk J.A.M., Bovenhuis H.,
Quantitative trait locus analysis for five milk production traits on chromosome
six in the Dutch Holstein Friesian population, Genetics 144 (1996) 1799–1808.
[27] Schrooten C., Bovenhuis H., Coppieters W., van Arendonk J.A.M., Whole
genome scan to detect quantitative trait loci for conformation and functional
traits in dairy cattle, J. Dairy Sci. 83 (2000) 795–806.
[28] Thomsen H., Reinsch N., Xu N., Looft C., Grupe S., Kuhn C., Brockmann
G.A., Schwerin M., Leyhe-Horn B., Hiendleder S., Erhardt G., Medjugorac I.,
Russ I., Förster M., Brenig B., Reinhardt F., Reents R., Blümel J., Averdunk G.,
Kalm E., Polygenic inheritance of the bovine blood group systems F, J, R, and
Z, determined by loci on different chromosomes. 50th Ann. Meet. Eur. Assoc.
Anim. Prod., Zurich, Swizerland, 22–26/08/1999. Paper G4.10.
[29] VanRaden P.M., Wiggans G.R., Derivation, calculation, and use of national
animal model information, J. Dairy Sci. 76 (1991) 2737–2746.
[30] Vilkki H.J., de Konning D.J., Elo K., Velmala R., Maki-Tanila A., Multiple
marker mapping of quantitative trait loci of Finnish dairy cattle by regression, J.
Dairy Sci. 80 (1997) 198–204.
QTL detection in dairy cattle 101
[31] Visscher P.M., Thompson R., Haley C.S., Confidence intervals in QTL mapping
by bootstraping, Genetics 143 (1996) 1013–1020.
[32] Weller J.I., Kashi Y., Soller M., Power of daughter and granddaughter designs
for determining linkage between marker loci and quantitative trait loci in dairy
cattle, J. Dairy Sci. 73 (1990) 2525–2537.
[33] Weller J.I., Song J.Z., Heyen D.W., Lewin H.A., Ron M., A new approach to
the problem of multiple comparisons in the genetic dissection of complex traits,
Genetics 150 (1998) 1699–1706.
[34] Zhang Q., Boichard D., Hoeschele I., Ernst C., Eggen A., Murkve B., Pfister-
Genskow M., Witte L.A., Grignola F.E., Uimari P., Thaller G., Bishop M.D.,
Mapping quantitative trait loci for milk production and health of dairy cattle in a
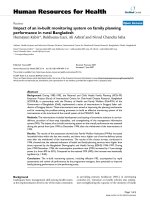
large outbred pedigree, Genetics 149 (1998) 1959–1973.
To access this journal online:
www.edpsciences.org